 Catalogue PIGMA
notPlanned
Type of resources
Available actions
Topics
Keywords
Contact for the resource
Provided by
Years
Formats
Representation types
Update frequencies
status
Scale
Resolution
-

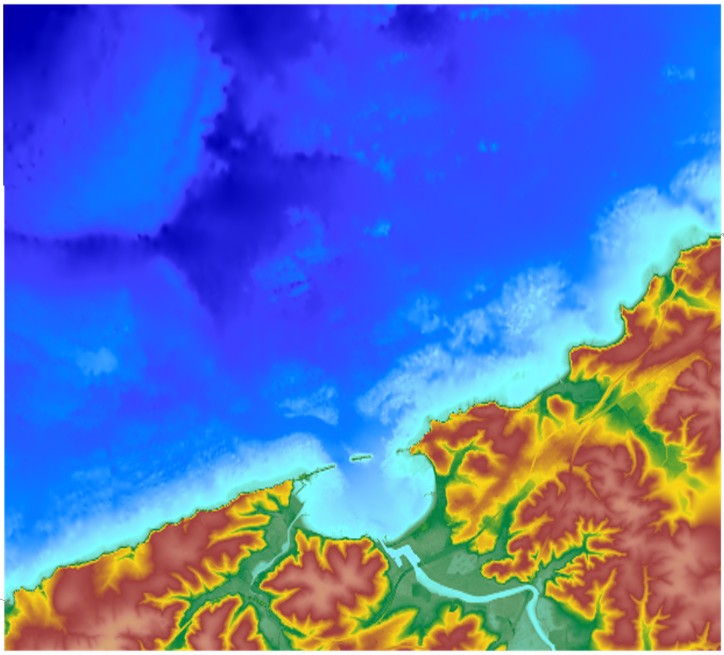
The update of the coastal topo-bathymetric DEM of the Gironde estuary - downstream with a resolution of 0.0002° (~ 20 m) was carried out in the third phase of the HOMONIM project. This DEM covers the downstream part of the Gironde estuary, from Pauillac to its mouth. It is complementary to the DEM covering the upstream estuary. The DEM is intended to be implemented in hydrodynamic models in order to produce forecasts as accurate as possible of water heights and sea states at the coast to improve the relevance of the Wave-Submergence Vigilance. This product is available with either the Lowest Astronomic Tide (LAT) or the Mean Sea Level (MSL) as a vertical reference.
-
-
The product SCAN Littoral® is a collection of continuous colour digital map images of the coast, obtained via georeferenced assembling with grid squares of raster data from Shom nautical charts and IGN 1:25,000 land maps. The SCAN Littoral® solution includes a series of digital images with no additions, legends or georeferencing information.
-
-
-

This product shows the international distribution of types of tides. Four types of tides exist, and are classified based on the number and height of high and low waters each day: semi-diurnal tide: two high tides and two low tides with approximately the same height are recorded each day. Mixed tides with diurnal inequality: two high and low tides are recorded daily (just like with semi-diurnal tides), however the heights of the high and low waters vary significantly over the same day. Diurnal tides: one single high tide and one single low tide are recorded each day. Composite: tides can be diurnal or semi-diurnal or mixed.
-
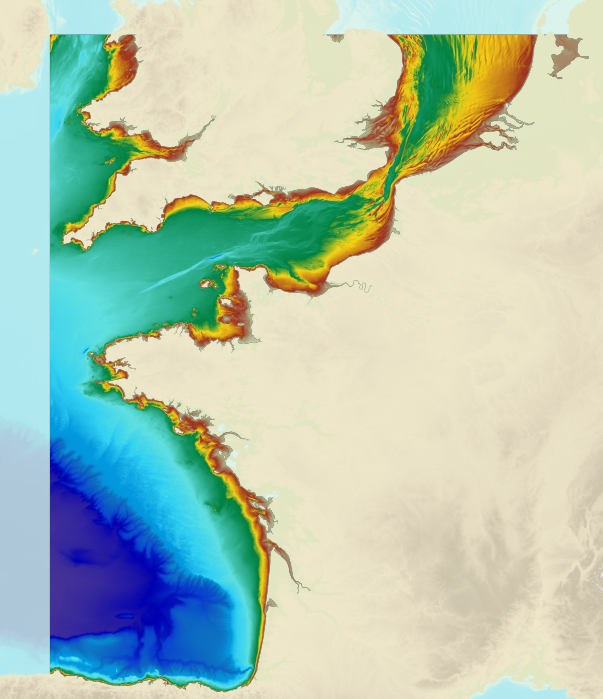
The bathymetric DEM of the atlantic facade with a resolution of 0.001° (~ 100 m) was prepared as part of the HOMONIM project. It encompasses part of the North Sea, the Channel and the Bay of Biscay. Offshore, this DTM extends beyond the slope to approximately 4800 m depth. The DEM is designed to be used in hydrodynamic models in order to produce high-precision forecasts for coastal water levels and sea conditions and therefore improve the pertinence of the Waves-Submersion monitoring programme. This product is available with the Lowest Astronomic Tide (LAT) or the Mean Sea Level (MSL) as a vertical datum.
-

-

The multispectral images of the study area were acquired by drone on 18 September 2025 using the DJI Mavic 3M RTK. The orthomosaic was generated from 5,128 images across five spectral bands (Green, Red, Red Edge, Near-Infrared (NIR), and Alpha), captured at an altitude of 100 meters (2025). The ground resolution achieved was 4.568 cm/pixel, covering a surveyed area of approximately 0.94 km². The Digital Surface Models (DSMs) were resampled to a resolution of 10 cm.
-
The coastal topo- bathymetric DEM for the coasts of the Saint-Jean-de-Luz bay with a resolution of 0.0002° (~ 20 m) was prepared as part of the TANDEM project. It covers Saint-Jean-de-Luz bay and the surrounding area. The DEM is designed to be implemented in the hydrodynamic models of the TANDEM project in order to estimate the coastal effects of tsunamis for the Atlantic and English Channel, where French nuclear power plants have been installed for about 30 years. This product is available with the Lowest Astronomic Tide (LAT) or the Mean Sea Level (MSL) as a vertical datum.