 Catalogue PIGMA
2017
Type of resources
Available actions
Topics
Keywords
Contact for the resource
Provided by
Years
Formats
Representation types
Update frequencies
status
Service types
Scale
Resolution
-
Dans un contexte marqué par de fortes mutations de l’environnement économique et social, le ROME (Répertoire Opérationnel des Métiers et des Emplois) est un outil au service de la mobilité professionnelle et du rapprochement entre offres et candidats. En décembre 2016, les référentiels de compétences du ROME évoluent afin d'améliorer la transversalité lors du rapprochement entre l'offre et la demande. Cette évolution consiste à : • réorganiser les compétences en savoir-faire et savoirs • reformuler les libellés en les simplifiant et les décontextualisant. --- Etat de la disponibilité de la donnée : - Data.gouv : donnée téléchargeable au format excel et mise à jour trimestrielle.
-
L'État a confié à l'IGN le développement du référentiel à grande échelle (RGE). Pour ce faire, il fait appel à ses moyens propres ainsi qu’à des partenariats avec des producteurs principalement de la sphère publique. Le RGE est constitué de 5 composantes: - orthophotographique (BD ORTHO), - topographique (BD TOPO), - adresse (BD adresse), - parcellaire (BD parcellaire) - et altimétrique (RGE ALTI). Remarque : seules les BD TOPO thème hydrographique, BD ORTHO 5m, BD ORTHO 50 cm sont sous Licence Ouverte. Les autres données du RGE sont soumises aux licences IGN. ----- Etat de la disponibilité de la donnée (sous Licence Ouverte): - Data.gouv : les BD TOPO thème hydrographique, BD ORTHO 5m, BD ORTHO 50 cm (pour certains départements) sont accessibles sous format shape, xml et htlm. Mise à jour irrégulière. - PIGMA : données BD ORTHO 50 cm (2015) et BD TOPO v2.2 (2016) accessibles au format shape sous licence IGN. Aucune mise à jour. - Géocatalogue : données BD ORTHO v2 (2013) au format Tif et BD TOPO v2.1 (2015) au format shape, MIF/MID accessibles sous licence IGN. Aucune mise à jour. - IGN : renvoi direct au site IGN où les données sont téléchargeables au format JPEG et shape sous licence IGN. Mise à jour irrégulière.
-

La Base Adresse Nationale est une base de données qui a pour but de référencer l'intégralité des adresses du territoire français. Elle contient la position géographique de plus de 25 millions d'adresses. Elle est constituée par la collaboration entre : des acteurs nationaux tels que l'IGN, La Poste et La Poste ; des acteurs locaux tels que les collectivités, les communes, les SDIS ; des citoyens par exemple à travers le projet OpenStreetMap et l'association OpenStreetMap France. Le projet est co-gouverné par l'Administrateur Général des Données et le Conseil National de l'Information Géographique. --- Etat de disponibilité de la donnée : Data.gouv : donnée téléchargeable en csv et mise à jour hebdomadaire. OpenStreetMap : donnée téléchargeable en csv, shape et json et mise à jour hebdomadaire. PIGMA : lien qui renvoie à la BD Adresse (Octobre 2016). Mise à jour irrégulière.
-
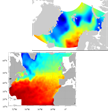
SeaDataNet gridded climatologies are based on the SeaDataNet Temperature and Salinity historical data collection v1.1. For the Atlantic Ocean there are covering 2 European sea basins: North Arctic Ocean, and North Atlantic Ocean The preparation of the products has also improved the quality, the consistency and the overall coherence of the data made available by SeaDataNet. They have been computed using DIVA software.
-

Gestion de la taxe de séjour des Établissements Touristiques aux réels (montant/suivi déclaration/suivi facturation) à l'échelle des communautés de communes.
-
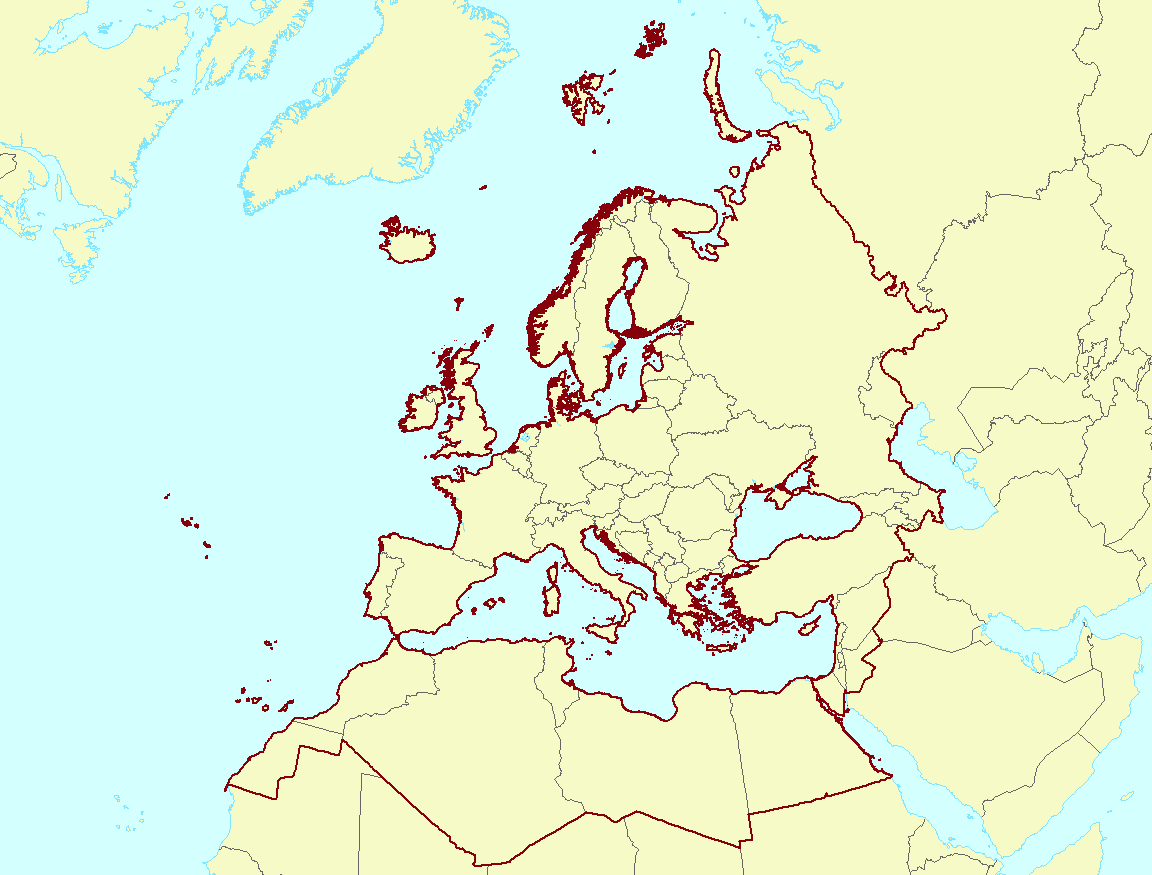
The EEA coastline for analysis is created for highly detailed analysis, e.g. 1:100 000, for geographical Europe. The coastline is a hybrid product obtained from projects using satellite imagery as data source: EUHYDRO (https://land.copernicus.eu/imagery-in-situ/eu-hydro) and GSHHG (http://www.soest.hawaii.edu/pwessel/gshhg/). The defining criteria was altitude level = 0 from EUDEM (https://land.copernicus.eu/pan-european/satellite-derived-products/eu-dem/view). Outside the coverage of the EUDEM, the coastline from GSHHG was used without modifications. A few manual amendments to the dataset were necessary to meet requirements from EU Nature Directives, Water Framework Directive and Marine Strategy Framework Directive. In 2015, several corrections were made in the Kalogeroi Islands (coordinates 38.169, 25.287) and two other Greek little islets (coordinates 36.766264, 23.604318), as well as in the peninsula of Porkkala (around coordinates 59.99, 24.42). In this revision (v3, 2017), 2 big lagoons have been removed from Baltic region, because, according to HELCOM, are freshwater lagoons.
-

Gestion de la taxe de séjour des Etablissements Touristiques aux forfaits (Montant/suivi déclaration/suivi facturation) à l'échelle des communautés de communes.
-

Nature de l'occupation du sol par commune et en m².
-
Calculation of the average annual sediment balance per stretch of coast for the past 100 years for all coastal zones bordering the North Atlantic Ocean. For this scale of study, this has been interpreted in terms of shoreline advance / retreat in mm/year. Required data sources are therefore national or international datasets giving this parameter directly. It is also possible to utilise more aggregated data sources, but annual values would then be approximated from them. The main challenge in producing this product lies with obtaining datasets which include this data from multiple countries and potentially multiple languages, since this data is usually produced as a result of comparatively small scale studies.
-
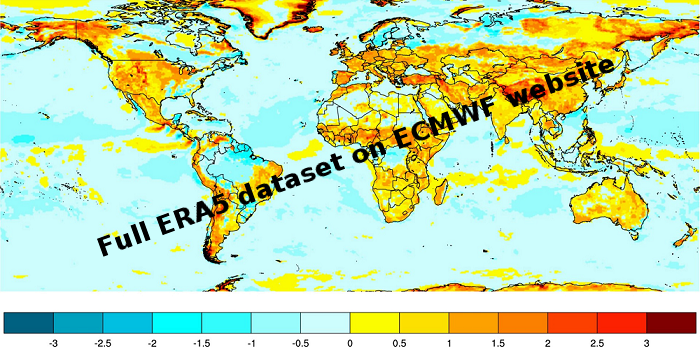
ERA5 is a climate reanalysis dataset, covering the period 1979 to present. ERA5 is being developed through the Copernicus Climate Change Service (C3S). Extracted data available here are one hourly at a regular grid lat,lon 0.25*0.25