 Catalogue PIGMA
2020
Type of resources
Available actions
Topics
Keywords
Contact for the resource
Provided by
Years
Formats
Representation types
Update frequencies
status
Service types
Scale
Resolution
-
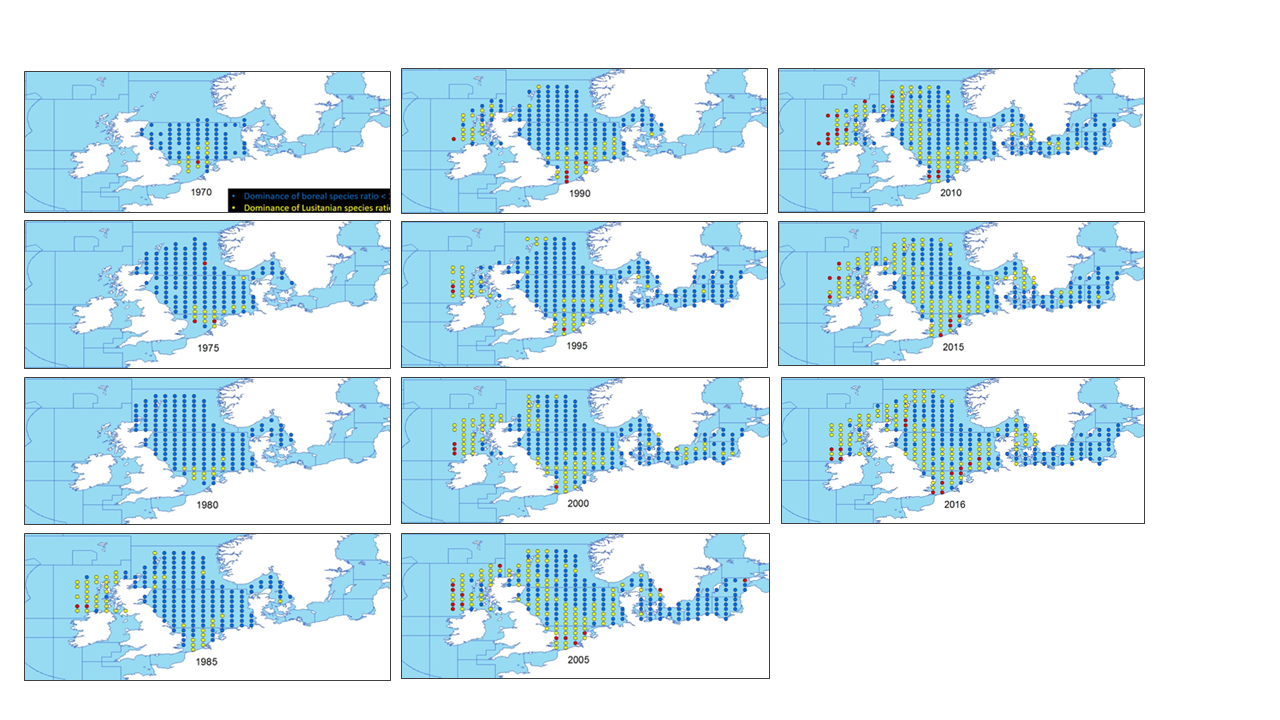
This metadata describes the ICES data on the temporal development of the Lusitanian/Boreal species ratio in the period from 19657 to 2016. Key message: The ratio between the number of Lusitanian (warm-favouring) and Boreal (cool-favouring) species are significantly increasing in several North-East Atlantic marine areas whereas there is no significant changes in all the southern areas. Changes in ratios are most apparent in the North Sea, Irish Sea and West of Scotland. Furthermore, it seems that Lusitanian species have not spread in all northward directions, but have followed two particular routes, through the English Channel and north around Scotland Blue dots indicates L/B ratios below 1 (dominance of Boreal species) Yellow dots indicates L/B ratios >=1 and <2 (dominance of Lusitanian species) Red dots indicates L/B ratios >=2 (high dominance of Lusitanian species) The dataset is derived from the ICES data portal 'DATRAS' (the Database of Trawl Surveys). DATRAS is an online database of trawl surveys with access to standard data products. DATRAS stores data collected primarily from bottom trawl fish surveys coordinated by ICES expert groups. The survey data are covering the Baltic Sea, Skagerrak, Kattegat, North Sea, English Channel, Celtic Sea, Irish Sea, Bay of Biscay and the eastern Atlantic from the Shetlands to Gibraltar. At present, there are more than 56 years of continuous time series data in DATRAS, and survey data are continuously updated by national institutions. The dataset has been used in the EEA Indicator "Changes in fish distribution in European seas" https://www.eea.europa.eu/data-and-maps/indicators/fish-distribution-shifts/assessment-1. The dataset has been used for this static map: https://www.eea.europa.eu/en/analysis/indicators/changes-in-fish-distribution-in/temporal-development-of-the-ratio
-
The GEBCO_2020 Grid was released in May 2020 and is the second global bathymetric product released by the General Bathymetric Chart of the Oceans (GEBCO) and has been developed through the Nippon Foundation-GEBCO Seabed 2030 Project. The GEBCO_2020 Grid provides global coverage of elevation data in meters on a 15 arc-second grid of 43200 rows x 86400 columns, giving 3,732,480,000 data points. Grid Development The GEBCO_2020 Grid is a continuous, global terrain model for ocean and land with a spatial resolution of 15 arc seconds. The grid uses as a ‘base’ Version 2 of the SRTM15+ data set (Tozer et al, 2019). This data set is a fusion of land topography with measured and estimated seafloor topography. It is augmented with the gridded bathymetric data sets developed by the four Seabed 2030 Regional Centers. The Regional Centers have compiled gridded bathymetric data sets, largely based on multibeam data, for their areas of responsibility. These regional grids were then provided to the Global Center. For areas outside of the polar regions (primarily south of 60°N and north of 50°S), these data sets are in the form of 'sparse grids', i.e. only grid cells that contain data were populated. For the polar regions, complete grids were provided due to the complexities of incorporating data held in polar coordinates. The compilation of the GEBCO_2020 Grid from these regional data grids was carried out at the Global Center, with the aim of producing a seamless global terrain model. In contrast to the development of the previous GEBCO grid, GEBCO_2019, the data sets provided as sparse grids by the Regional Centers were included on to the base grid without any blending, i.e. grid cells in the base grid were replaced with data from the sparse grids. This was with aim of avoiding creating edge effects, 'ridges and ripples', at the boundaries between the sparse grids and base grid during the blending process used previously. In addition, this allows a clear identification of the data source within the grid, with no cells being 'blended' values. Routines from Generic Mapping Tools (GMT) system were used to do the merging of the data sets. For the polar data sets, and the adjoining North Sea area, supplied in the form of complete grids these data sets were included using feather blending techniques from GlobalMapper software version 11.0, made available by Blue Marble Geographic. The GEBCO_2020 Grid includes data sets from a number of international and national data repositories and regional mapping initiatives. For information on the data sets included in the GEBCO_2020 Grid, please see the list of contributions included in this release of the grid (https://www.gebco.net/data_and_products/gridded_bathymetry_data/gebco_2020/#compilations).
-

The Ocean Colour Climate Change Initiative project aims to: Develop and validate algorithms to meet the Ocean Colour GCOS ECV requirements for consistent, stable, error-characterized global satellite data products from multi-sensor data archives. Produce and validate, within an R&D context, the most complete and consistent possible time series of multi-sensor global satellite data products for climate research and modelling. Optimize the impact of MERIS data on climate data records. Generate complete specifications for an operational production system. Strengthen inter-disciplinary cooperation between international Earth observation, climate research and modelling communities, in pursuit of scientific excellence. The ESA OC CCI project is following a data reprocessing paradigm of regular re-processings utilising on-going research and developments in atmospheric correction, in-water algorithms, data merging techniques and bias correction. This requires flexibility and rapid turn-around of processing of extensive ocean colour datasets from a number of ESA and NASA missions to both trial new algorithms and methods and undertake the complete data set production. Read more about the Ocean Colour project on ESA's project website. https://climate.esa.int/en/projects/ocean-colour/.
-
L'orthophotographie de précision planimétrique de classe A (arrêté du 16 septembre 2003) et produit en RVB (couleurs : Rouge, Vert, Bleu) constitue la composante image du géostandard PCRS. Un PCRS constitue le socle commun topographique minimal de base décrivant à très grande échelle les limites apparentes de la voirie. Il est limité aux objets les plus utiles et n'aborde aucune des logiques "métiers" par ailleurs traitées chez les gestionnaires de réseaux. Le PCRS est destiné à servir de support topographique à un grand nombre d'applications requérant la meilleure précision possible. Il répond essentiellement aux exigences de la réglementation dite "anti-endommagement" ou réforme DT-DICT portant sur les travaux à proximité des réseaux, notamment sous la forme d'un fond de plan utilisable dans le cadre des échanges entre gestionnaires et exploitants. Conçu pour facilité les échanges entre les plans de type DAO et les SIG des collectivité et exploitants, les objets du PCRS gèrent peu d'attributs autres que ceux liés à la généalogie de leur acquisition, majoritairement par levé topographique.
-
In integrated multi-trophic aquaculture (IMTA), multiple aquatic species from different trophic levels are farmed together. Thus, waste from one species can be used as input (fertiliser and food) for another species. The EU-funded ASTRAL project will develop IMTA production chains for the Atlantic markets. Focusing on a regional challenge-based perspective, it will bring together labs in Ireland and Scotland (open offshore labs), South Africa (flow-through inshore) and Brazil (recirculation inshore) as well as Argentina (prospective IMTA lab). The aim is to increase circularity by as much as 60 % compared to monoculture baseline aquaculture and to boost revenue diversification for aquaculture producers. ASTRAL will share, integrate, and co-generate knowledge, technology and best practices fostering a collaborative ecosystem along the Atlantic.
-
Pôles de la CAPB correspondant aux anciens EPCI
-
Assessments run at AFWG provide the scientific basis for the management of cod, haddock, saithe, redfish, Greenland halibut and capelin in subareas 1 and 2. Taking the catch values provided by the Norwegian fisheries ministry for Norwegian catches1 and raising the total landed value to the total catches gives an approximate nominal first-hand landed value for the combined AFWG stocks of ca. 20 billion NOK or ca. 2 billion EUR (2018 estimates).
-
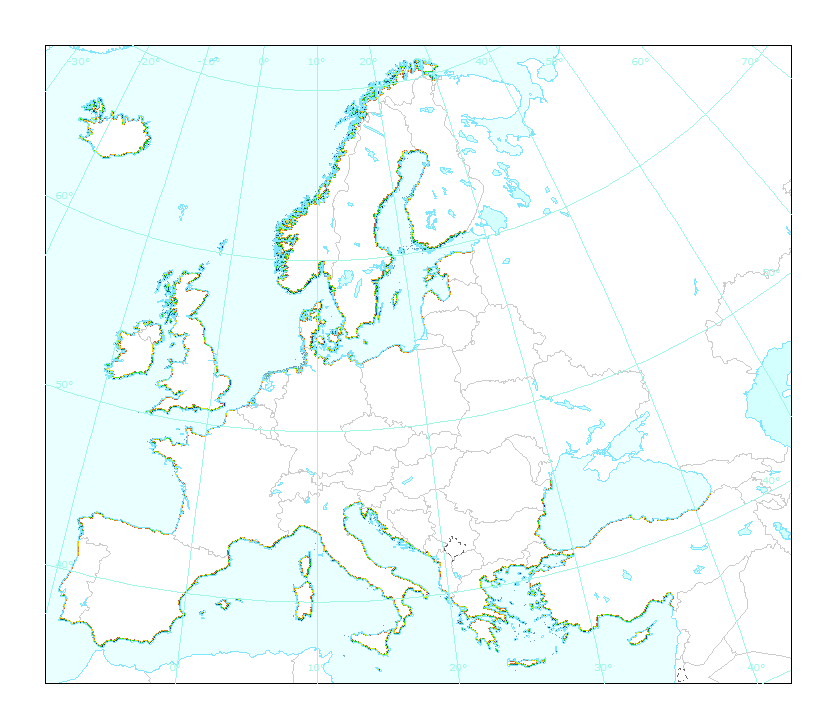
This dataset is the coastal zone land surface region from Europe, derived from the coastline towards inland, as a series of 10 consecutive buffers of 1km width each. The coastline is defined by the extent of the Corine Land Cover 2018 (raster 100m) version 20 accounting layer. In this version all Corine Land Cover pixels with a value of 523, corresponding to sea and oceans, were considered as non-land surface and thus were excluded from the buffer zone.
-
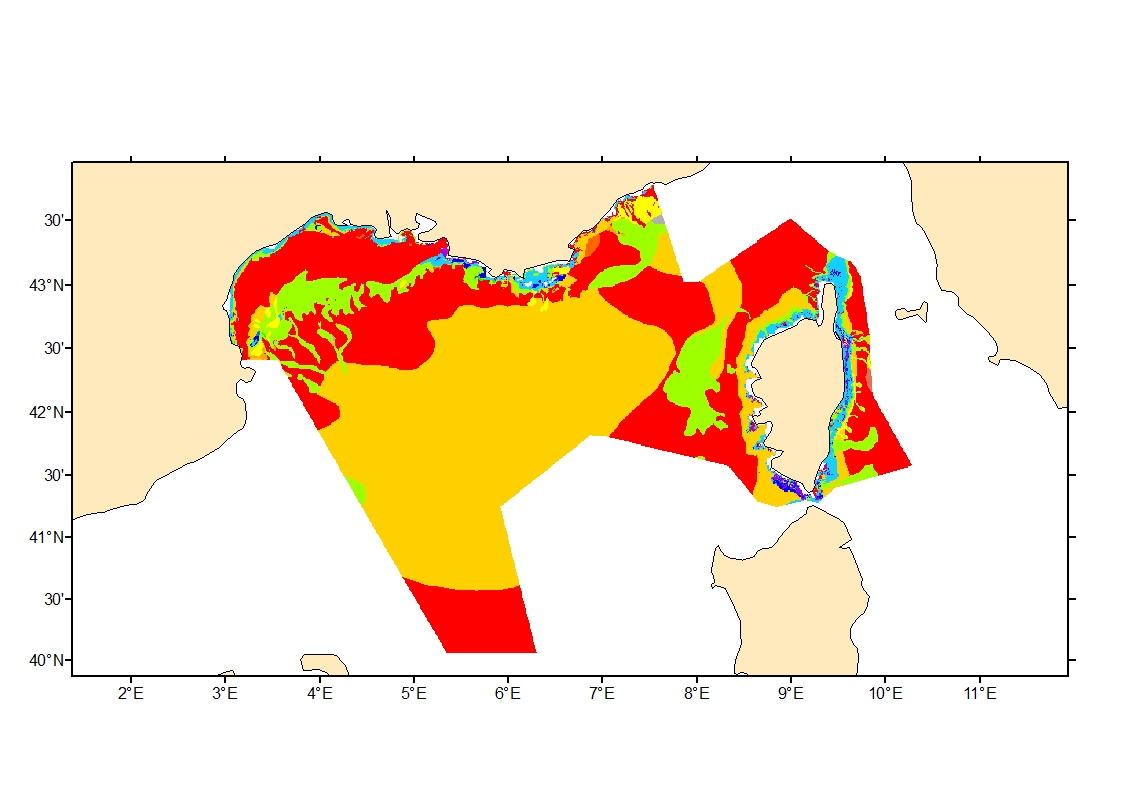
Sediment average grain size in French Mediterranean waters was generated from sediment categories. This rough granulometry estimate may be used for habitat models at meso- and large scale.
-

scRNA-seq reads from a Pacific oyster (Crassostrea gigas) hemocyte preparation. Hemocytes were isolated from a unique immunologically naive animal (Ifremer Standardized Animal, 18 months) and single-cell drop-seq technology was applied to 3,000 individual hemocytes.