 Catalogue PIGMA
2022
Type of resources
Available actions
Topics
Keywords
Contact for the resource
Provided by
Years
Formats
Representation types
Update frequencies
status
Service types
Scale
Resolution
-
This dataset gathers isotopic ratios (carbon and nitrogen) and concentrations of both priority (mercury species and polychlorinated biphenyls congeners) and emerging (musks and sunscreens) micropollutants measured in a host-parasite couple (hake Merluccius merluccius muscle and in its parasite Anisakis sp) from the south of Bay of Biscay in 2018. In addition, the hake infection degree measured as the number of Anisakis sp. larvae was added for each hake collected.
-
The ESA Sea State Climate Change Initiative (CCI) project has produced global multi-sensor time-series of along-track satellite synthetic aperture radar (SAR) integrated sea state parameters (ISSP) data from Sentinel-1 (referred to as SAR WV onboard Sentinel-1 Level 2P (L2P) ISSP data) with a particular focus for use in climate studies. This dataset contains the Sentinel-1 SAR Remote Sensing Integrated Sea State Parameter product (v1.0), which forms part of the ESA Sea State CCI version 3.0 release. This product provides along-track primary significant wave height measurements and secondary sea state parameters, calibrated with CMEMS model data and reference in situ measurements at 20km resolution every 100km, processed using the Pleskachevsky et. al., 2021 emprical model, separated per satellite and pass, including all measurements with flags and uncertainty estimates. These are expert products with rich content and no data loss. The SAR Wave Mode data used in the Sea State CCI SAR WV onboard Sentinel-1 Level 2P (L2P) ISSP v3 dataset come from the Sentinel-1 satellite missions spanning from 2014 to 2021 (Sentinel-1 A, Sentinel-1 B).
-

The SARWAVE project is developing a new sea state processor from SAR images to be applied over open ocean, sea ice, and coastal areas, and exploring potential synergy with other microwave and optical EO products.
-
The upper ocean pycnocline (UOP) monthly climatology is based on the ISAS20 ARGO dataset containing Argo and Deep-Argo temperature and salinity profiles on the period 2002-2020. Regardless of the season, the UOP is defined as the shallowest significant stratification peak captured by the method described in Sérazin et al. (2022), whose detection threshold is proportional to the standard deviation of the stratification profile. The three main characteristics of the UOP are provided -- intensity, depth and thickness -- along with hydrographic variables at the upper and lower edges of the pycnocline, the Turner angle and density ratio at the depth of the UOP. A stratification index (SI) that evaluates the amount of buoyancy required to destratify the upper ocean down to a certain depth, is also included. When evaluated at the bottom of the UOP, this gives the upper ocean stratification index (UOSI) as discussed in Sérazin et al. (2022). Three mixed layer depth variables are also included in this dataset, including the one using the classic density threshold of 0.03 kg.m-3, along with the minimum of these MLD variables. Several statistics of the UOP characteristics and the associated quantities are available in 2°×2° bins for each month of the year, whose results were smoothed using a diffusive gaussian filter with a 500 km scale. UOP characteristics are also available for each profile, with all the profiles sorted in one file per month.
-
The SARWAVE project is developing a new sea state processor from SAR images to be applied over open ocean, sea ice, and coastal areas, and exploring potential synergy with other microwave and optical EO products.
-

WGS for Iatlantic projet ( ) for assessing past and present connectivity
-
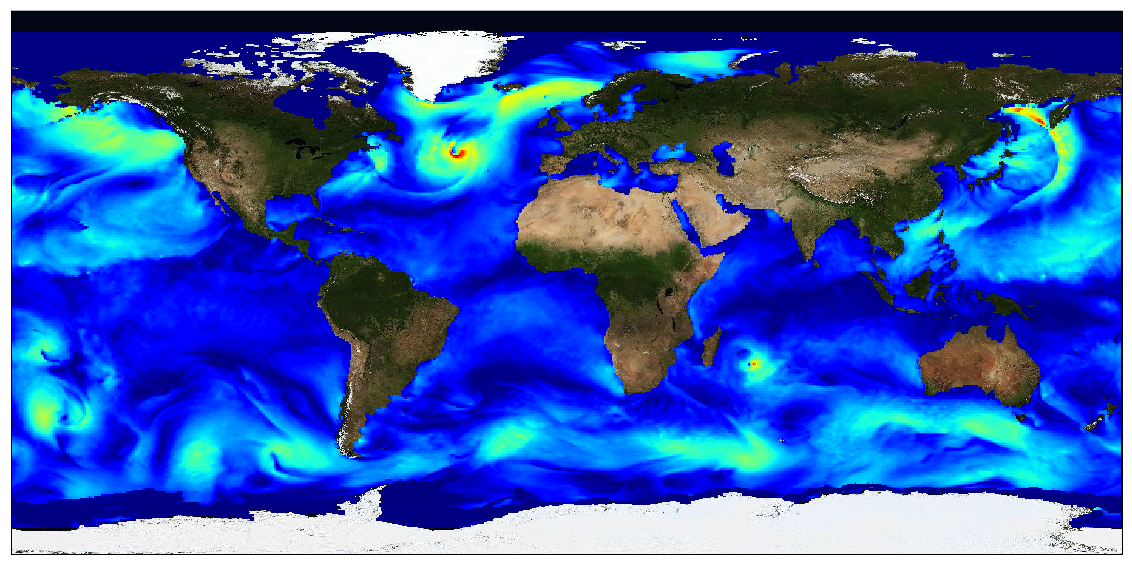
This dataset provides surface Stokes drift as retrieved from the wave energy spectrum computed by the spectral wave model WAVEWATCH-III (r), under NOAA license, discretized in wave numbers and directions and the water depth at each location. It is estimated at the sea surface and expressed in m.s-1. WAVEWATCH-III (r) model solves the random phase spectral action density balance equation for wavenumber-direction spectra. Please refer to the WAVEWATCH-III User Manual for fully detailed description of the wave model equations and numerical approaches. The data are available through HTTP and FTP; access to the data is free and open. In order to be informed about changes and to help us keep track of data usage, we encourage users to register at: https://forms.ifremer.fr/lops-siam/access-to-esa-world-ocean-circulation-project-data/ This dataset was generated by Ifremer / LOPS and is distributed by Ifremer / CERSAT in the frame of the World Ocean Circulation (WOC) project funded by the European Space Agency (ESA).
-
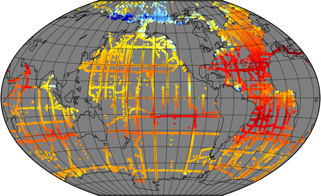
In recent years, large datasets of in situ marine carbonate system parameters (partial pressure of CO2 (pCO2), total alkalinity, dissolved inorganic carbon and pH) have been collated. These carbonate system datasets have highly variable data density in both space and time, especially in the case of pCO2, which is routinely measured at high frequency using underway measuring systems. This variation in data density can create biases when the data are used, for example for algorithm assessment, favouring datasets or regions with high data density. A common way to overcome data density issues is to bin the data into cells of equal latitude and longitude extent. This leads to bins with spatial areas that are latitude and projection dependent (eg become smaller and more elongated as the poles are approached). Additionally, as bin boundaries are defined without reference to the spatial distribution of the data or to geographical features, data clusters may be divided sub-optimally (eg a bin covering a region with a strong gradient). To overcome these problems and to provide a tool for matching in situ data with satellite, model and climatological data, which often have very different spatiotemporal scales both from the in situ data and from each other, a methodology has been created to group in situ data into ‘regions of interest’, spatiotemporal cylinders consisting of circles on the Earth’s surface extending over a period of time. These regions of interest are optimally adjusted to contain as many in situ measurements as possible. All in situ measurements of the same parameter contained in a region of interest are collated, including estimated uncertainties and regional summary statistics. The same grouping is done for each of the other datasets, producing a dataset of matchups. About 35 million in situ datapoints were then matched with data from five satellite sources and five model and re-analysis datasets to produce a global matchup dataset of carbonate system data, consisting of 287,000 regions of interest spanning 54 years from 1957 to 2020. Each region of interest is 100 km in diameter and 10 days in duration. An example application, the reparameterisation of a global total alkalinity algorithm, is shown. This matchup dataset can be updated as and when in situ and other datasets are updated, and similar datasets at finer spatiotemporal scale can be constructed, for example to enable regional studies. This dataset was funded by ESA Satellite Oceanographic Datasets for Acidification (OceanSODA) project which aims at developing the use of satellite Earth Observation for studying and monitoring marine carbonate chemistry.
-
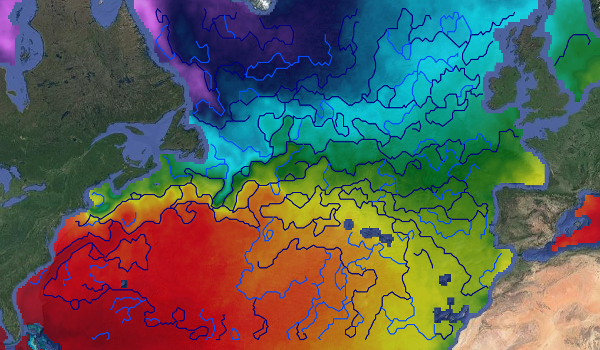
This dataset provides detections of fronts derived from low resolution optimally interpolated remote sensing microwave SST L4 from REMSS over North Atlantic region. The data are available through HTTP and FTP; access to the data is free and open. In order to be informed about changes and to help us keep track of data usage, we encourage users to register at: https://forms.ifremer.fr/lops-siam/access-to-esa-world-ocean-circulation-project-data/ This dataset was generated by OceanDataLab and is distributed by Ifremer / CERSAT in the frame of the World Ocean Circulation (WOC) project funded by the European Space Agency (ESA).
-
This data set is related to the article "Improving the robustness of dissipation rate estimates from microstructure shear data processing in ocean turbulence" (submitted to JTech, AMS). It provides the raw data files (with extension .p) from a vertical microstructure profiler VMP-6000 used for the published study. Raw data files are provided since the study precisely report on the data processing of raw microstructure horizontal velocity shear data to get dissipation rates of turbulent kinetic energy using the manufacturer software. The software (ODAS) can be downloaded from the manufacturer website at: https://rocklandscientific.com. The profiles were collected in the Mediterranean Sea in 2013 (French VAD cruise) and 2014 (Italian MEDOCC cruise), and in the North Atlantic Ocean in 2021 (MoMAR cruise). More details on the profiles are given in the related publication.