 Catalogue PIGMA
2024
Type of resources
Available actions
Topics
Keywords
Contact for the resource
Provided by
Years
Formats
Representation types
Update frequencies
status
Service types
Scale
Resolution
-
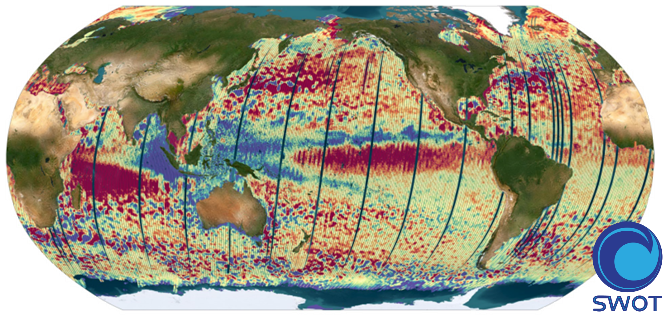
The SWOT L3_LR_SSH product provides ocean topography measurements obtained from the SWOT KaRIn and nadir altimeter instruments, merged into a single variable. The dataset includes measurements from KaRIn swaths on both sides of the image, while the measurements from the nadir altimeter are located in the central columns. In the areas between the nadir track and the two KaRIn swaths, as well as on the outer edges of each swath (restricted to cross-track distances ranging from 10 to 60 km), default values are expected. SWOT L3_LR_SSH is a cross-calibrated product from multiple missions that contains only the ocean topography content necessary for thematic research (e.g., oceanography, geodesy) and related applications. This product is designed to be simple and ready-to-use, and can be combined with other altimetry missions. The SWOT L3_LR_SSH product is a research-orientated extension of the L2_LR_SSH product, distributed by the SWOT project (NASA/JPL and CNES). SWOT L3_LR_SSH is managed by the SWOT Science Team project DESMOS. The ['Unsmoothed'] version of SWOT L3_LR_SSH (the "Basic" and "Expert" versions are the subject of separate metadata sheets) includes each algorithm, correction, or external model incorporated into the SWOT L3_LR_SSH product as a separate layer. This ['Unsmoothed'] version which includes the MSS, MDT and geostrophic currents (absolute and anomalies) in addition to the SSHA and MDT on the 250 m KaRIn native grid. Like the Expert subproduct, it also integrates a quality flag, corrections and external models as separate layers. References Dibarboure, G., Anadon, C., Briol, F., Cadier, E., Chevrier, R., Delepoulle, A., Faugère, Y., Laloue, A., Morrow, R., Picot, N., Prandi, P., Pujol, M.-I., Raynal, M., Tréboutte, A., and Ubelmann, C.: Blending 2D topography images from the Surface Water and Ocean Topography (SWOT) mission into the altimeter constellation with the Level-3 multi-mission Data Unification and Altimeter Combination System (DUACS), Ocean Sci., 21, 283–323, https://doi.org/10.5194/os-21-283-2025.
-
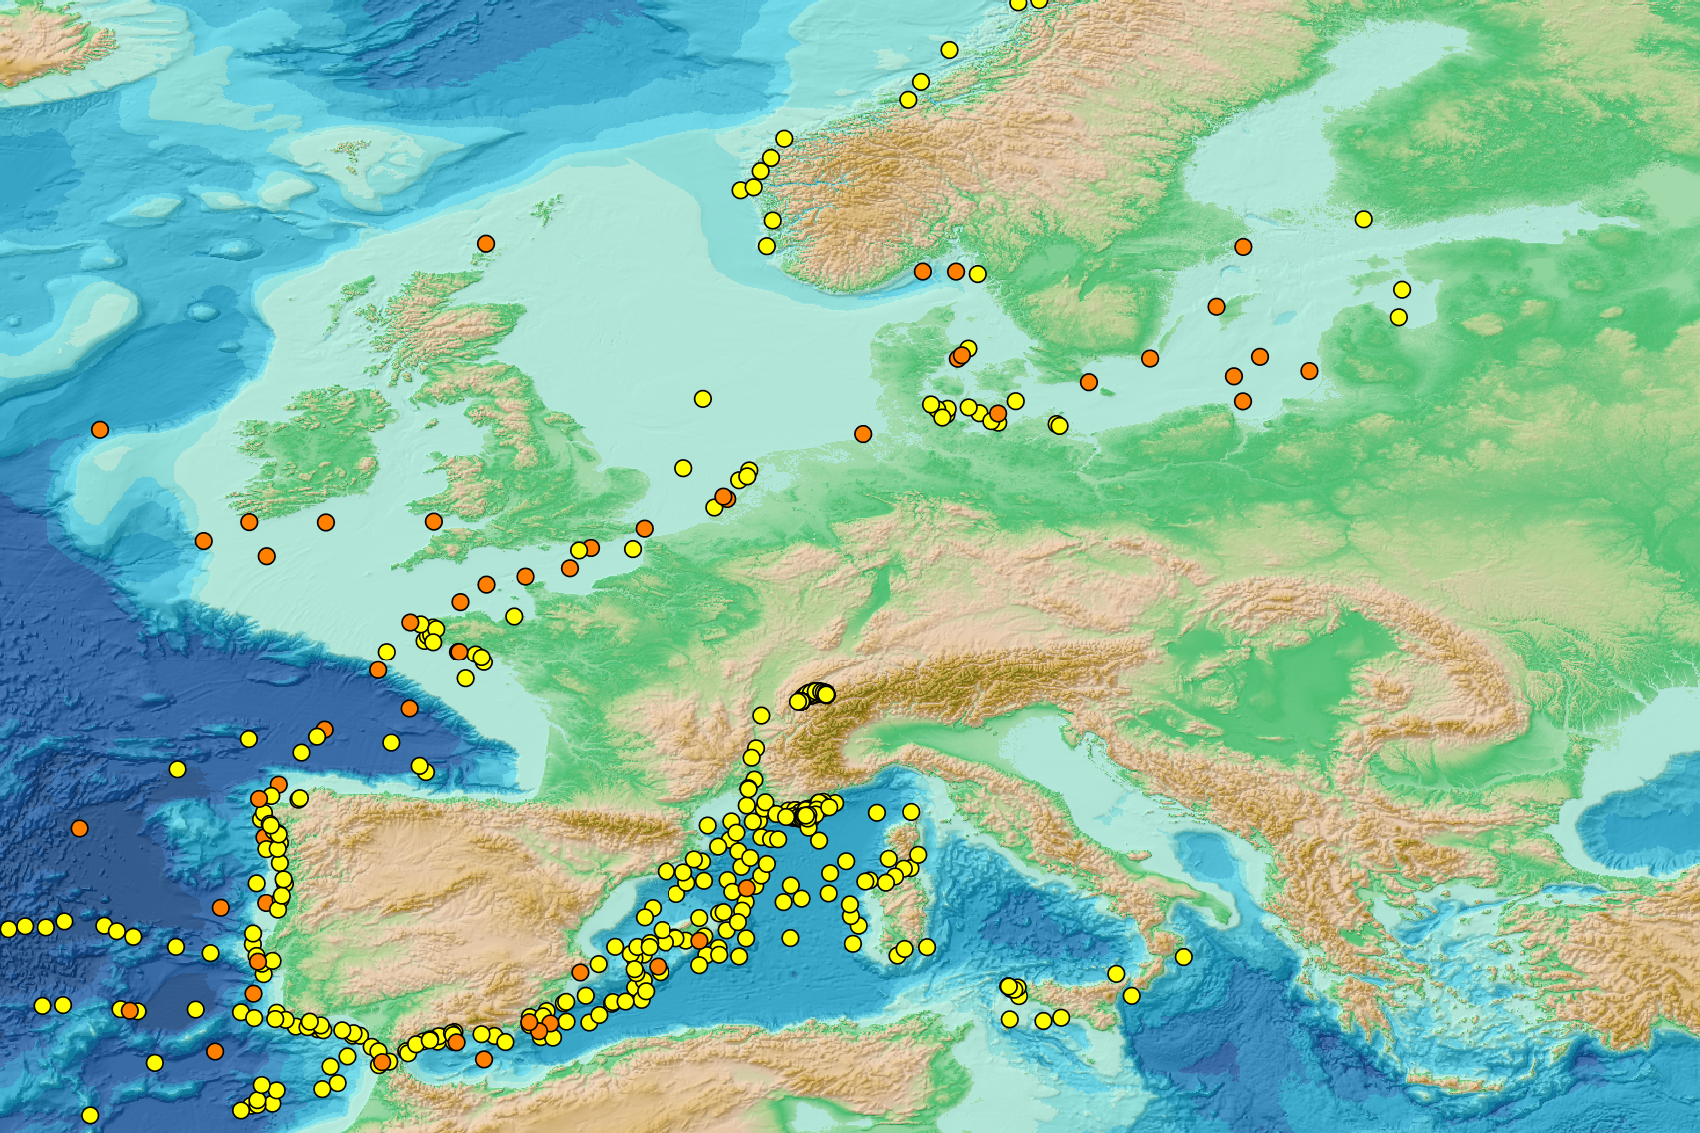
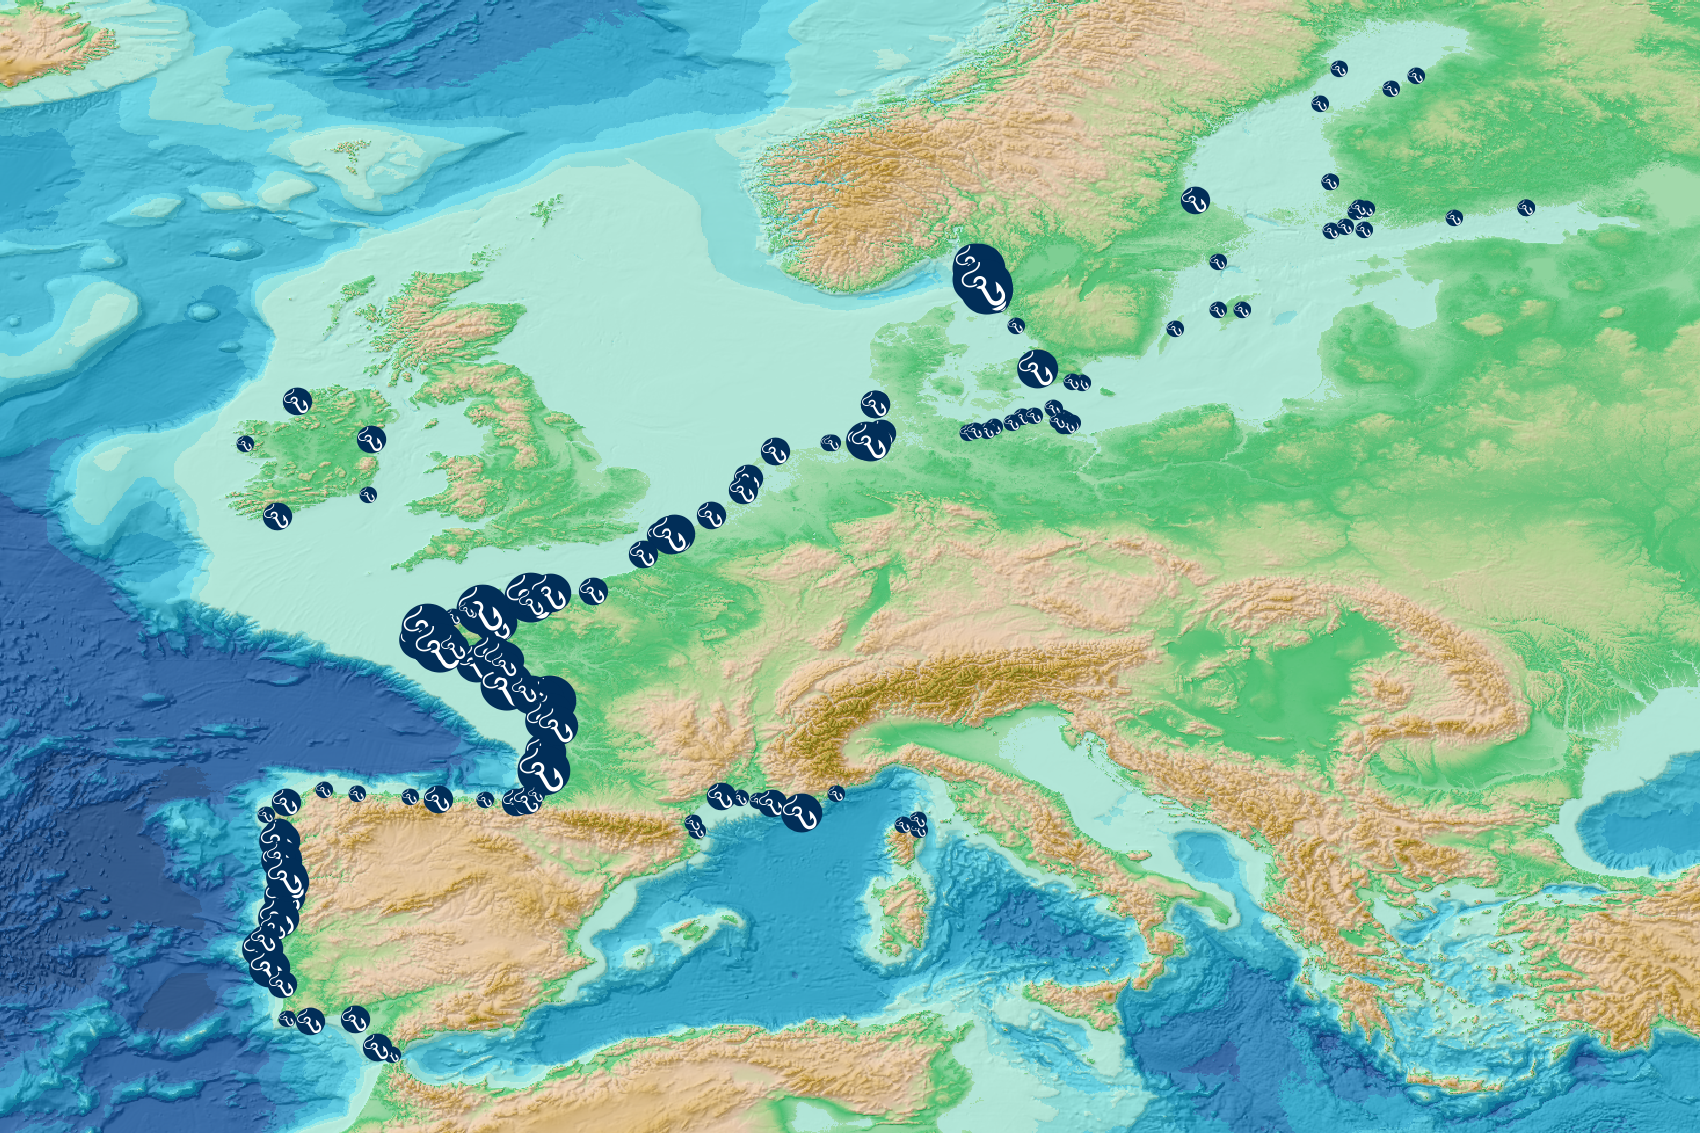
This product displays for Fluoranthene, positions with values counts that have been measured per matrix and are present in EMODnet regional contaminants aggregated datasets, v2022. The product displays positions for all available years.
-

'''Short description:''' For the Mediterranean Sea - The product contains daily Level-3 sea surface wind with a 1km horizontal pixel spacing using Synthetic Aperture Radar (SAR) observations and their collocated European Centre for Medium-Range Weather Forecasts (ECMWF) model outputs. Products are processed homogeneously starting from the L2OCN products. '''DOI (product) :''' https://doi.org/10.48670/mds-00342
-
This visualization product displays nets locations (start positions) where specific protocols have been applied to collate data on microlitter. Mesh size used with these protocols have been indicated with different colors in the map. EMODnet Chemistry included the collection of marine litter in its 3rd phase. Before 2021, there was no coordinated effort at the regional or European scale for micro-litter. Given this situation, EMODnet Chemistry proposed to adopt the data gathering and data management approach as generally applied for marine data, i.e., populating metadata and data in the CDI Data Discovery and Access service using dedicated SeaDataNet data transport formats. EMODnet Chemistry is currently the official EU collector of micro-litter data from Marine Strategy Framework Directive (MSFD) National Monitoring activities (descriptor 10). A series of specific standard vocabularies or standard terms related to micro-litter have been added to SeaDataNet NVS (NERC Vocabulary Server) Common Vocabularies to describe the micro-litter. European micro-litter data are collected by the National Oceanographic Data Centres (NODCs). Micro-litter map products are generated from NODCs data after a test of the aggregated collection including data and data format checks and data harmonization. A filter is applied to represent only micro-litter sampled according to a very specific protocol such as the Volvo Ocean Race (VOR) or Oceaneye. Warning: the absence of data on the map does not necessarily mean that they do not exist, but that no information has been entered in the National Oceanographic Data Centre (NODC) for this area.
-
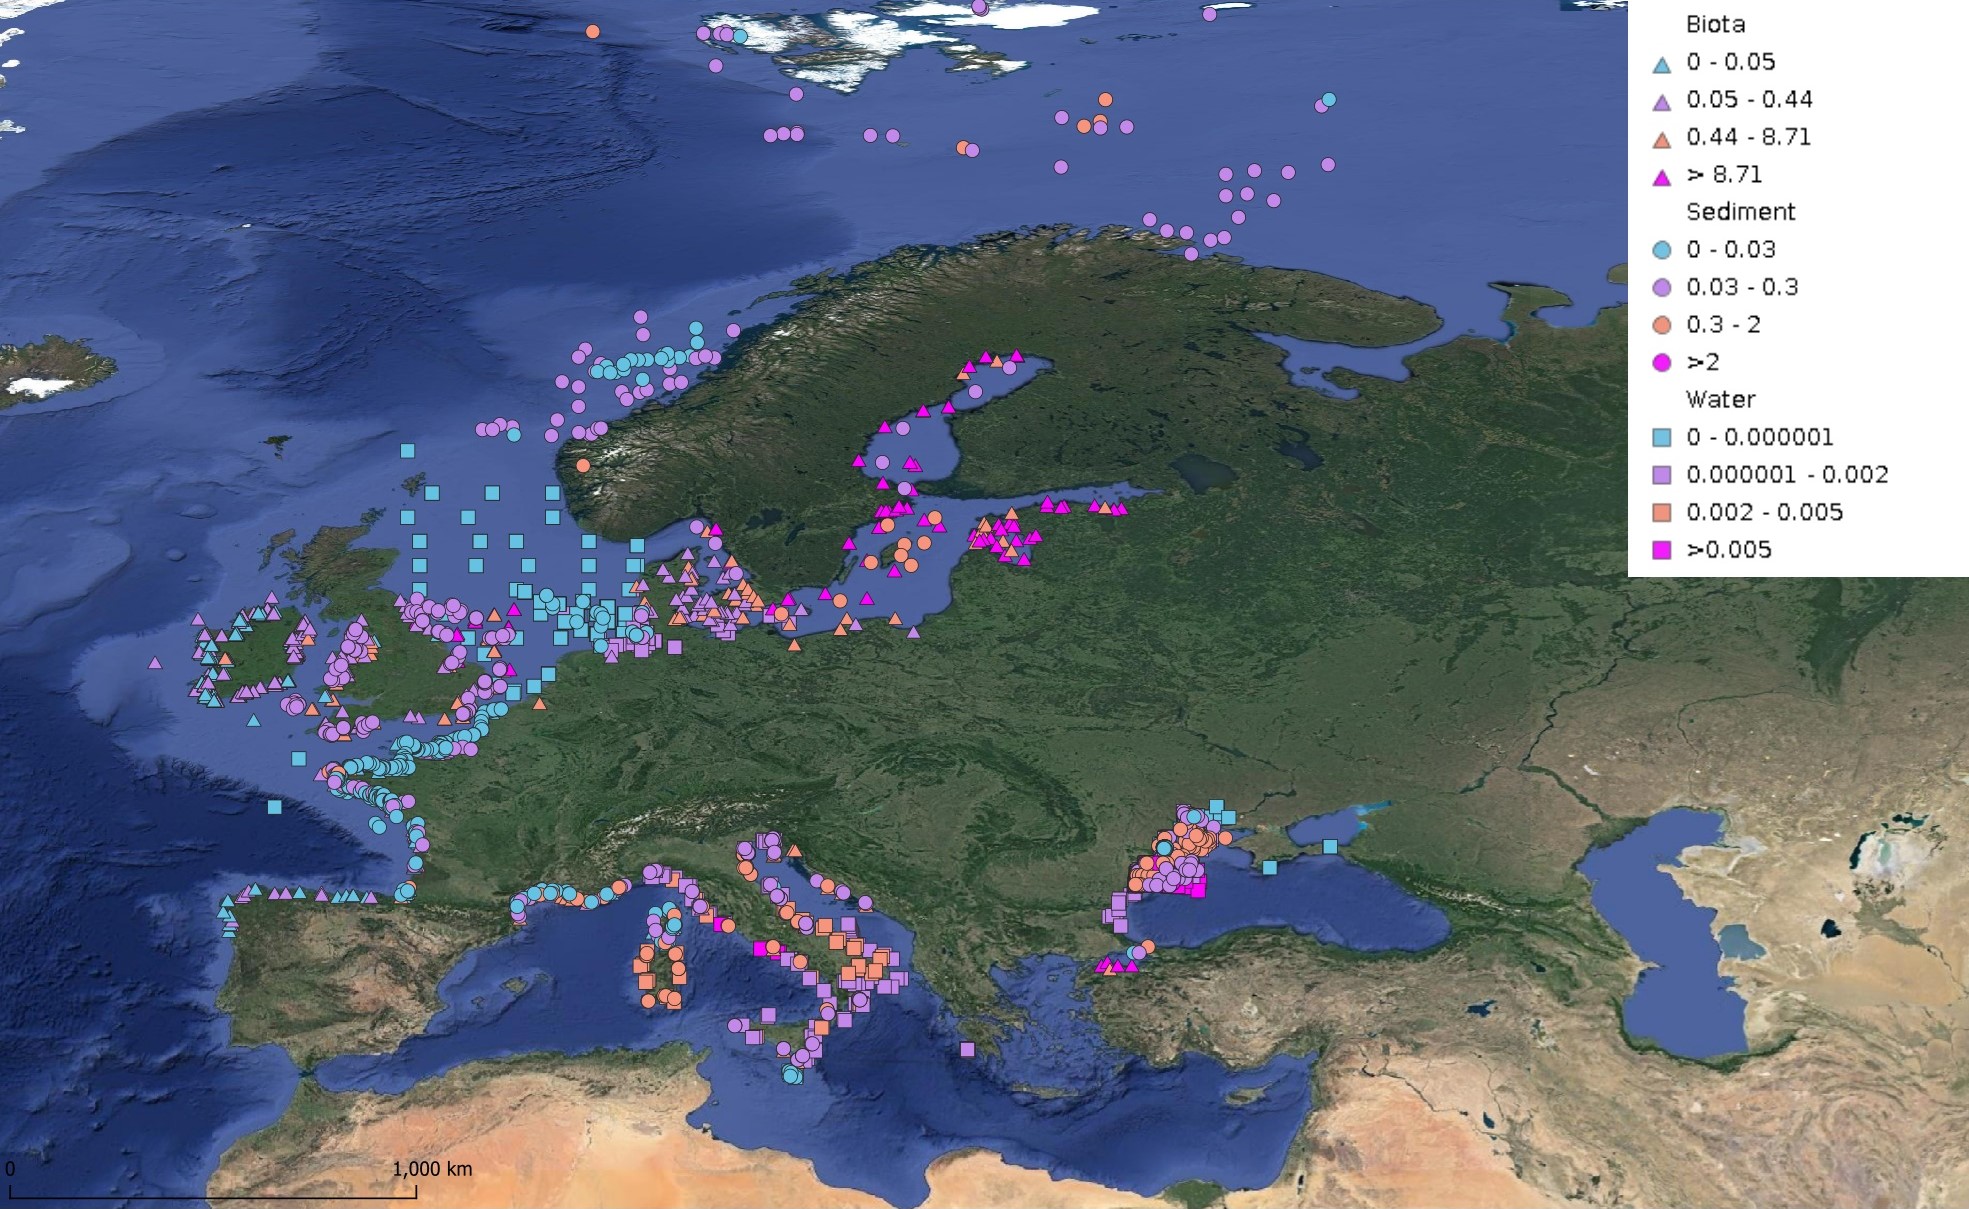
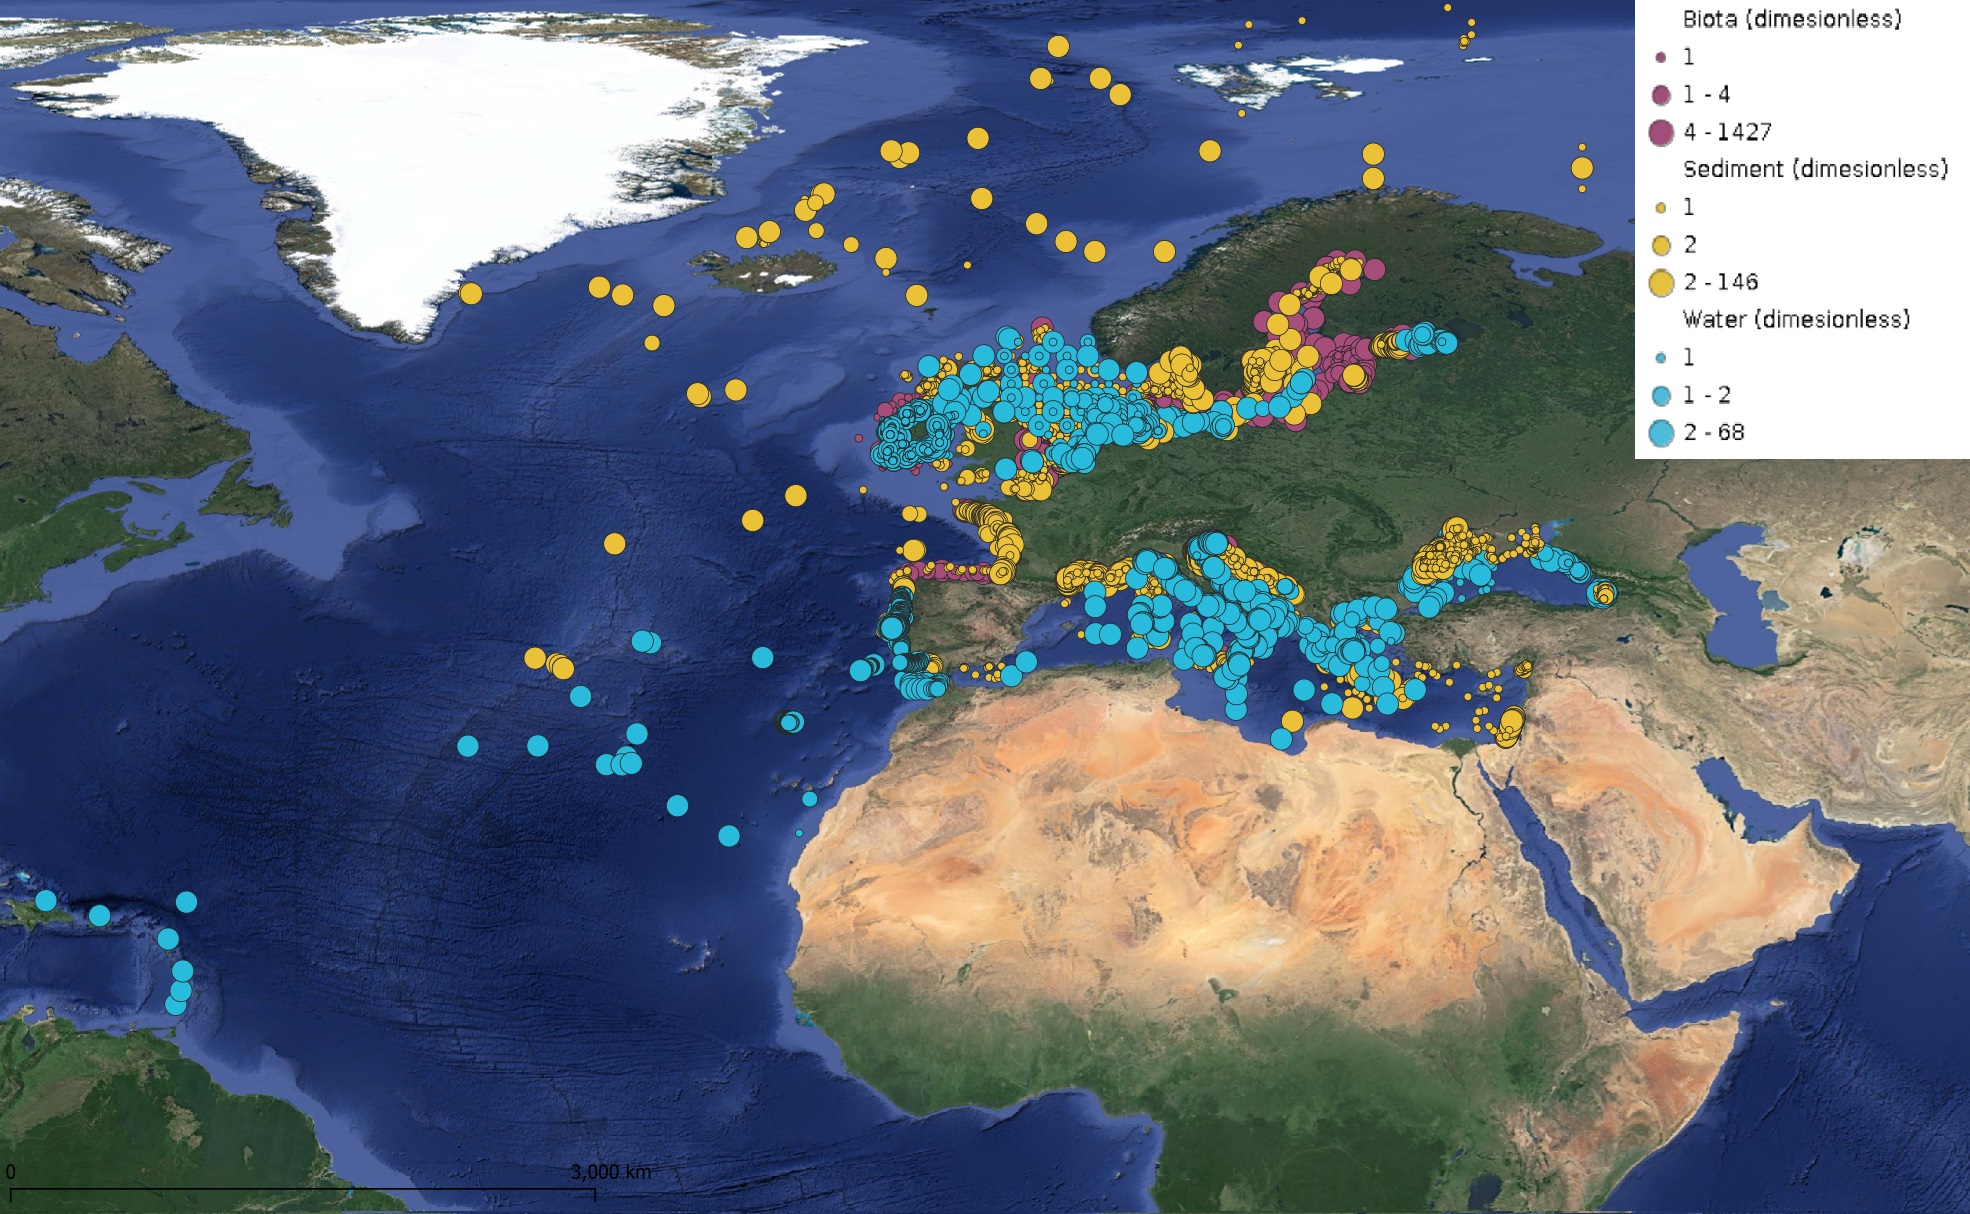
This product displays for DDT, DDE, and DDD, median values since 2012 that have been measured per matrix and are present in EMODnet regional contaminants aggregated datasets, v2024. The median values ranges are derived from the following percentiles: 0-25%, 25-75%, 75-90%, >90%. Only "good data" are used, namely data with Quality Flag=1, 2, 6, Q (SeaDataNet Quality Flag schema). For water, only surface values are used (0-15 m), for sediment and biota data at all depths are used.
-

This visualization product displays the cigarette related items abundance of marine macro-litter (> 2.5cm) per beach per year from Marine Strategy Framework Directive (MSFD) monitoring surveys without UNEP-MARLIN data. EMODnet Chemistry included the collection of marine litter in its 3rd phase. Since the beginning of 2018, data of beach litter have been gathered and processed in the EMODnet Chemistry Marine Litter Database (MLDB). The harmonization of all the data has been the most challenging task considering the heterogeneity of the data sources, sampling protocols and reference lists used on a European scale. Preliminary processings were necessary to harmonize all the data: - Exclusion of OSPAR 1000 protocol: in order to follow the approach of OSPAR that it is not including these data anymore in the monitoring; - Selection of MSFD surveys only (exclusion of other monitoring, cleaning and research operations); - Exclusion of beaches without coordinates; - Selection of cigarette related items only. The list of selected items is attached to this metadata. This list was created using EU Marine Beach Litter Baselines, the European Threshold Value for Macro Litter on Coastlines and the Joint list of litter categories for marine macro-litter monitoring from JRC (these three documents are attached to this metadata); - Selection of surveys referring to the UNEP-MARLIN list: the UNEP-MARLIN protocol differs from the other types of monitoring in that cigarette butts are surveyed in a 10m square. To avoid comparing abundances from very different protocols, the choice has been made to distinguish in two maps the cigarette related items results associated with the UNEP-MARLIN list from the others; - Normalization of survey lengths to 100m & 1 survey / year: in some case, the survey length was not exactly 100m, so in order to be able to compare the abundance of litter from different beaches a normalization is applied using this formula: Number of cigarette related items of the survey (normalized by 100 m) = Number of cigarette related items of the survey x (100 / survey length) Then, this normalized number of cigarette related items is summed to obtain the total normalized number of cigarette related items for each survey. Finally, the median abundance of cigarette related items for each beach and year is calculated from these normalized abundances of cigarette related items per survey. Sometimes the survey length was null or equal to 0. Assuming that the MSFD protocol has been applied, the length has been set at 100m in these cases. Percentiles 50, 75, 95 & 99 have been calculated taking into account cigarette related items from MSFD monitoring data (excluding UNEP-MARLIN protocol) for all years. More information is available in the attached documents. Warning: the absence of data on the map does not necessarily mean that they do not exist, but that no information has been entered in the Marine Litter Database for this area.
-
This visualization product displays the fishing & aquaculture related plastic items abundance of marine macro-litter (> 2.5cm) per beach per year from Marine Strategy Framework Directive (MSFD) monitoring surveys. EMODnet Chemistry included the collection of marine litter in its 3rd phase. Since the beginning of 2018, data of beach litter have been gathered and processed in the EMODnet Chemistry Marine Litter Database (MLDB). The harmonization of all the data has been the most challenging task considering the heterogeneity of the data sources, sampling protocols and reference lists used on a European scale. Preliminary processings were necessary to harmonize all the data: - Exclusion of OSPAR 1000 protocol: in order to follow the approach of OSPAR that it is not including these data anymore in the monitoring; - Selection of MSFD surveys only (exclusion of other monitoring, cleaning and research operations); - Exclusion of beaches without coordinates; - Selection of fishing and aquaculture related plastic items only. The list of selected items is attached to this metadata. This list was created using EU Marine Beach Litter Baselines, the European Threshold Value for Macro Litter on Coastlines and the Joint list of litter categories for marine macro-litter monitoring from JRC (these three documents are attached to this metadata). The selection was adapted to the Joint list of litter categories fishing gears identification and therefore contains some differences with the selection made for previously published versions of this product; - Normalization of survey lengths to 100m & 1 survey / year: in some case, the survey length was not exactly 100m, so in order to be able to compare the abundance of litter from different beaches a normalization is applied using this formula: Number of fishing & aquaculture related plastic items of the survey (normalized by 100 m) = Number of fishing & aquaculture related items of the survey x (100 / survey length) Then, this normalized number of fishing & aquaculture related plastic items is summed to obtain the total normalized number of fishing & aquaculture related plastic items for each survey. Finally, the median abundance of fishing & aquaculture related plastic items for each beach and year is calculated from these normalized abundances of fishing & aquaculture related items per survey. Sometimes the survey length was null or equal to 0. Assuming that the MSFD protocol has been applied, the length has been set at 100m in these cases. Percentiles 50, 75, 95 & 99 have been calculated taking into account fishing & aquaculture related plastic items from MSFD data for all years. More information is available in the attached documents. Warning: the absence of data on the map does not necessarily mean that they do not exist, but that no information has been entered in the Marine Litter Database for this area.
-
This product displays for Lead, positions with values counts that have been measured per matrix and are present in EMODnet regional contaminants aggregated datasets, v2024. The product displays positions for all available years.
-
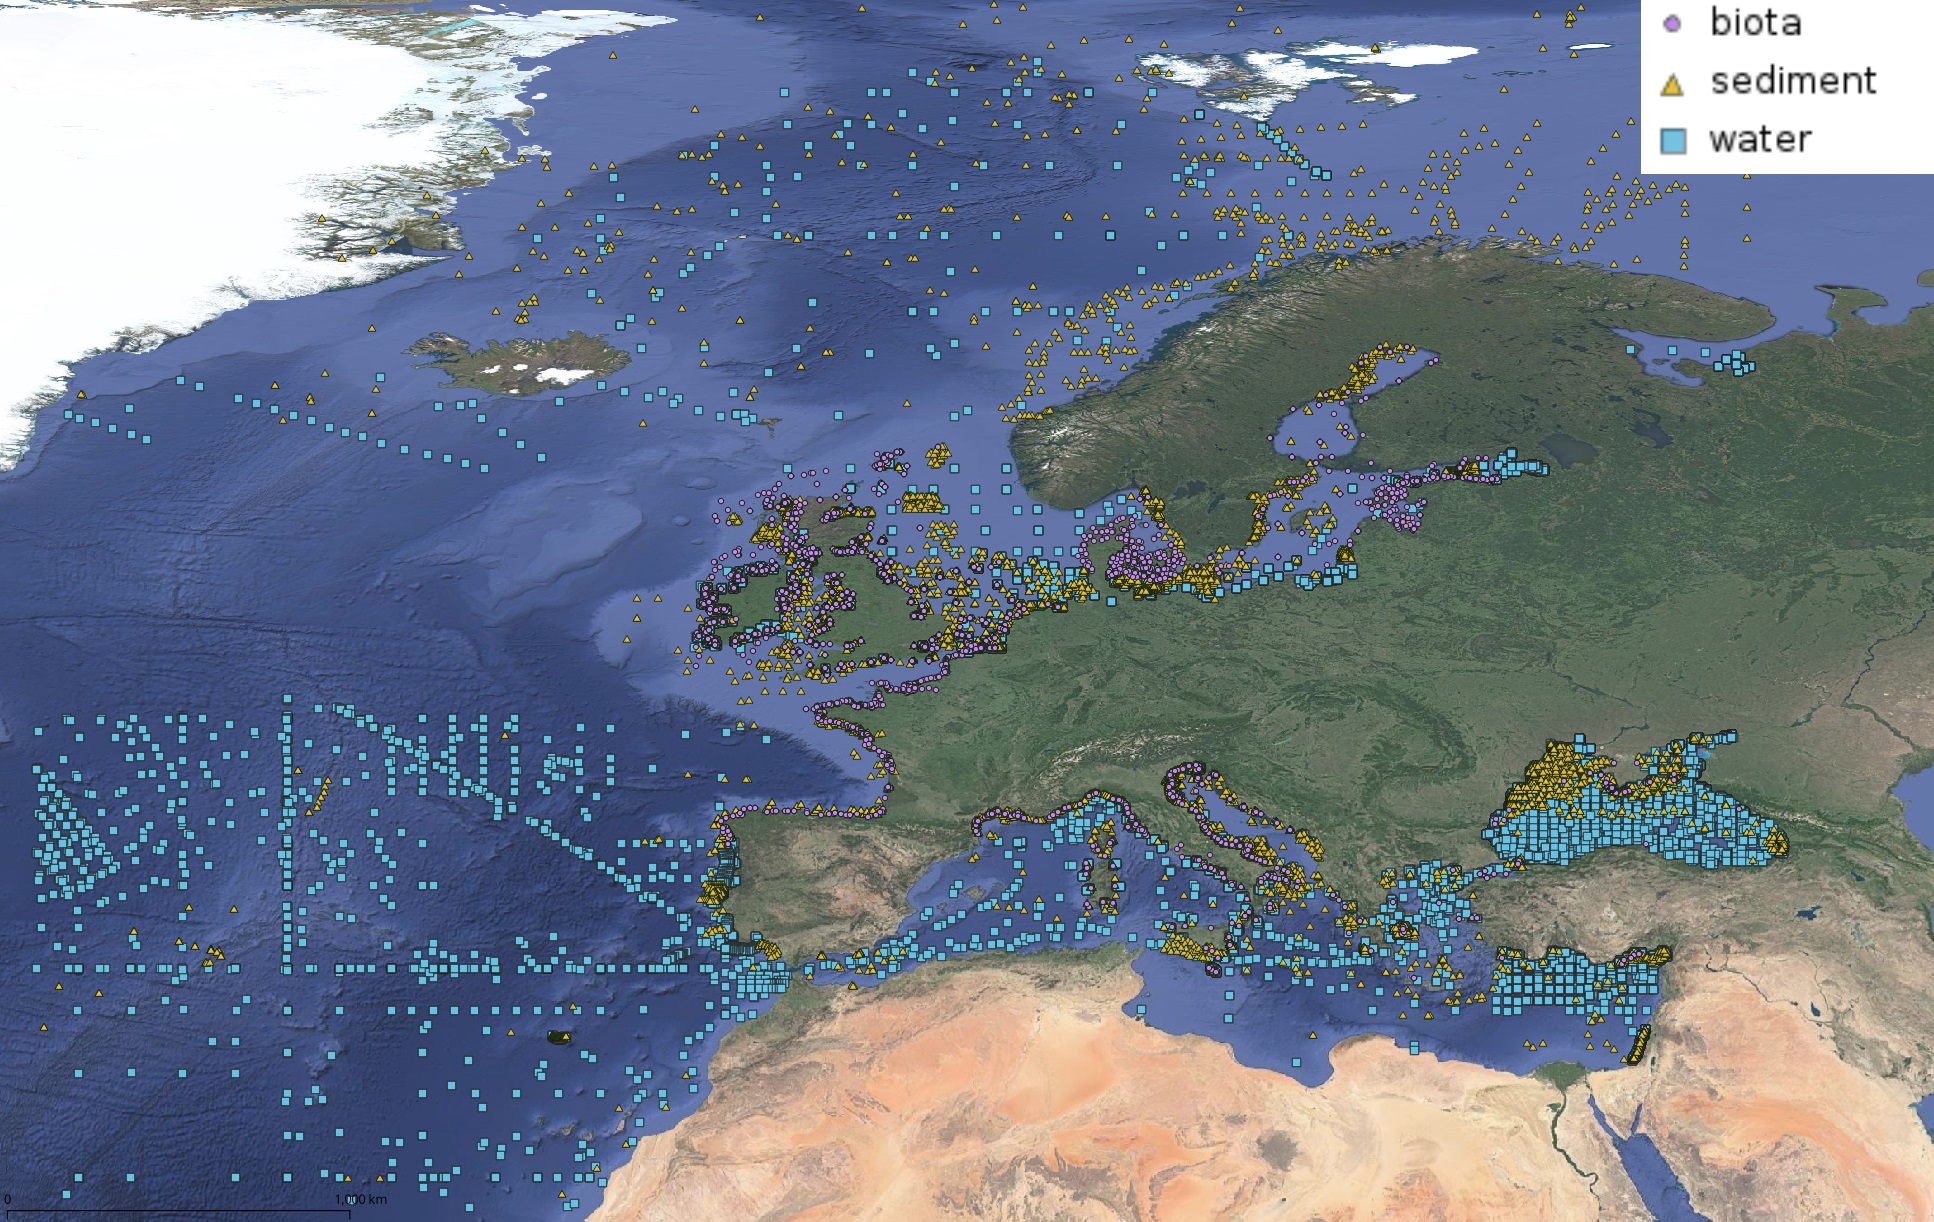
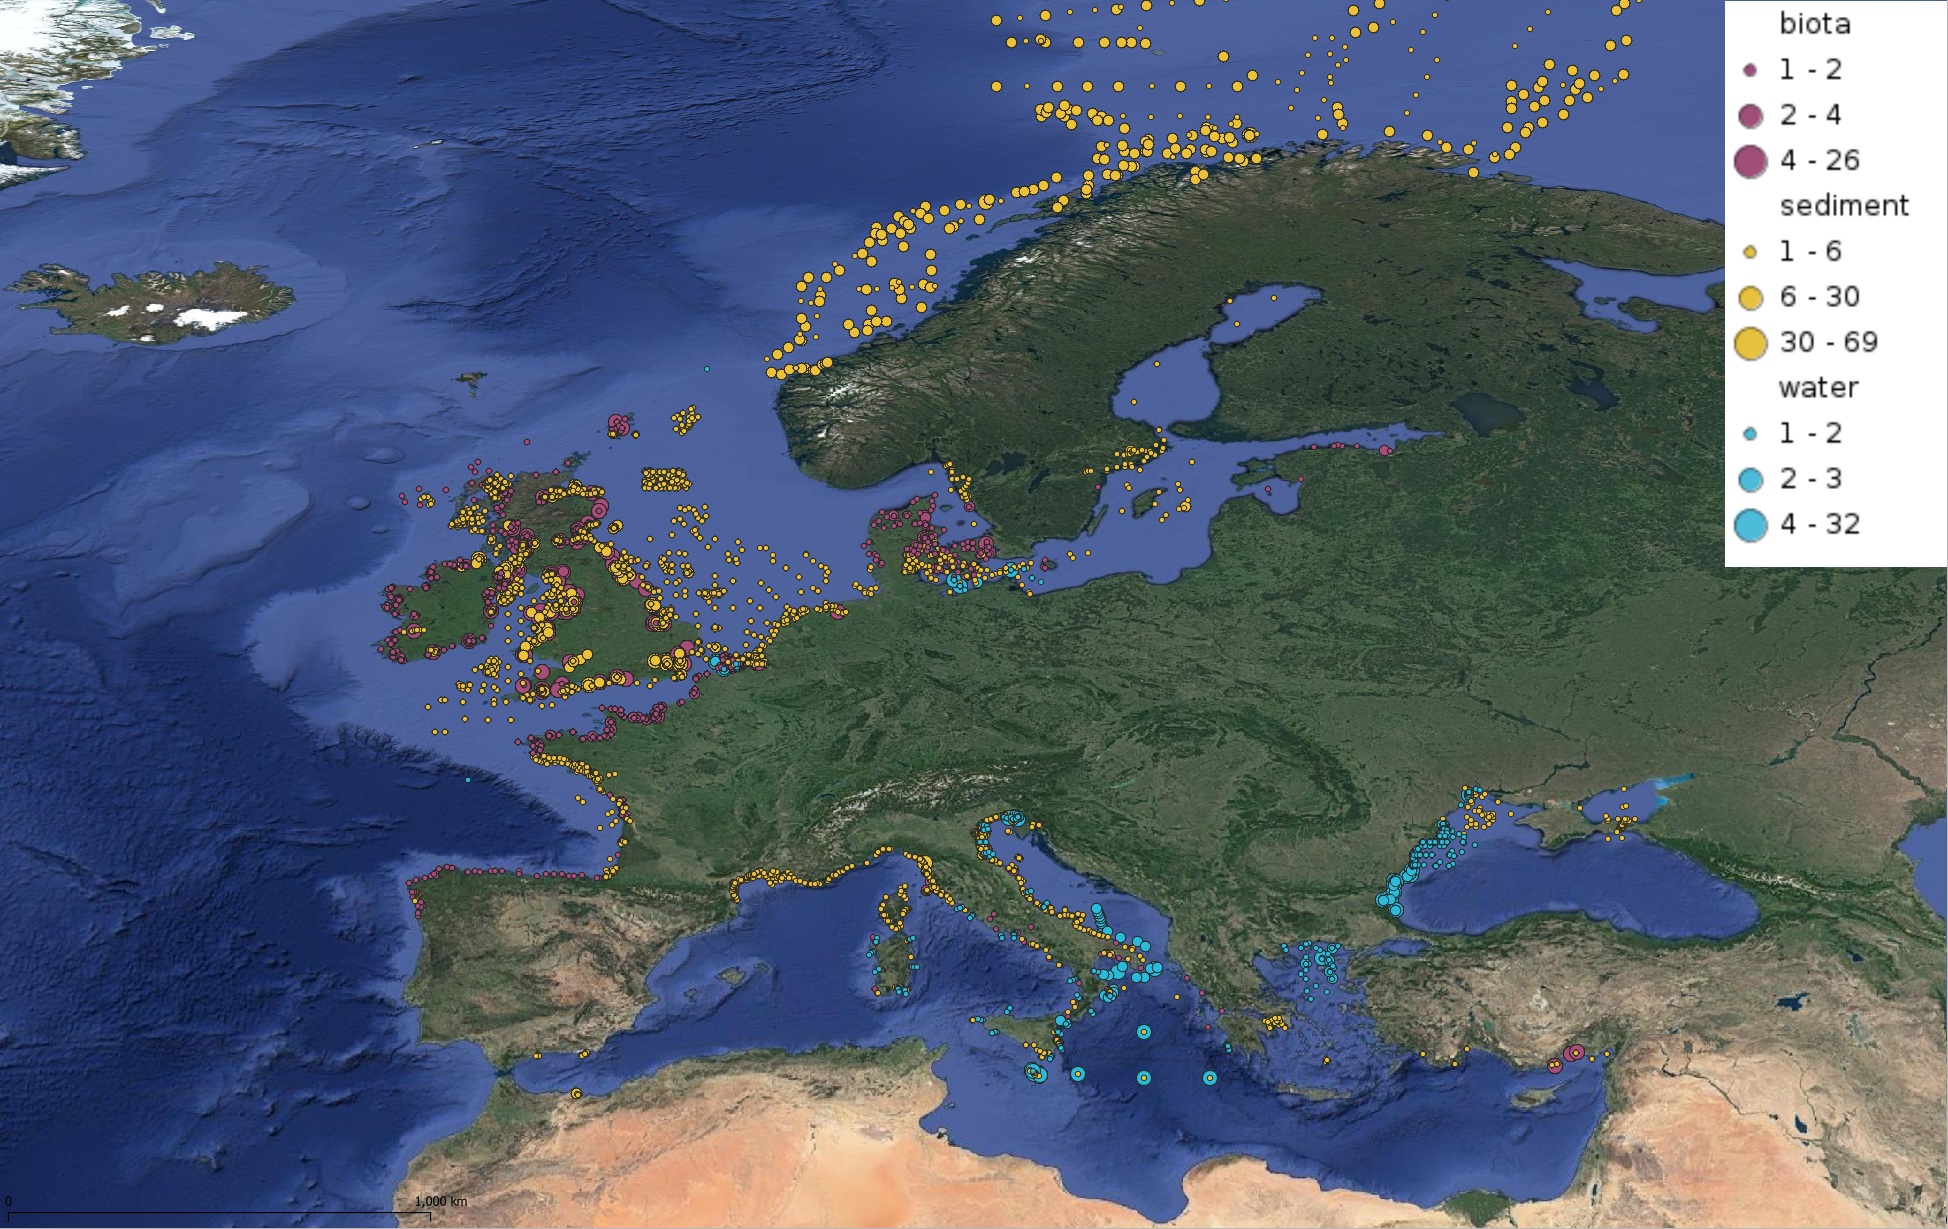
This product displays positions symbolized per matrix, for all available contaminants measurements present in EMODnet regional contaminants aggregated datasets, v2022. The product displays positions for all available years.
-
Micro litter - Density per net normalized per m³ - Research and monitoring protocols 2016/2023 v2025

This visualization product displays the density of floating micro-litter per net normalized per m³ per year from research and monitoring protocols. EMODnet Chemistry included the collection of marine litter in its 3rd phase. Before 2021, there was no coordinated effort at the regional or European scale for micro-litter. Given this situation, EMODnet Chemistry proposed to adopt the data gathering and data management approach as generally applied for marine data, i.e., populating metadata and data in the CDI Data Discovery and Access service using dedicated SeaDataNet data transport formats. EMODnet Chemistry is currently the official EU collector of micro-litter data from Marine Strategy Framework Directive (MSFD) National Monitoring activities (descriptor 10). A series of specific standard vocabularies or standard terms related to micro-litter have been added to SeaDataNet NVS (NERC Vocabulary Server) Common Vocabularies to describe the micro-litter. European micro-litter data are collected by the National Oceanographic Data Centres (NODCs). Micro-litter map products are generated from NODCs data after a test of the aggregated collection including data and data format checks and data harmonization. A filter is applied to represent only micro-litter sampled according to research and monitoring protocols as MSFD monitoring. Densities were calculated for each net using the following calculation: Density (number of particles per m³) = Micro-litter count / Sampling effort (m³) When the number of micro-litters was not filled, it was not possible to calculate the density. Percentiles 50, 75, 95 & 99 have been calculated taking into account data for all years. Warning: the absence of data on the map does not necessarily mean that they do not exist, but that no information has been entered in the National Oceanographic Data Centre (NODC) for this area.