 Catalogue PIGMA
GeoTIFF
Type of resources
Available actions
Topics
Keywords
Contact for the resource
Provided by
Years
Formats
Representation types
Update frequencies
status
Scale
Resolution
-
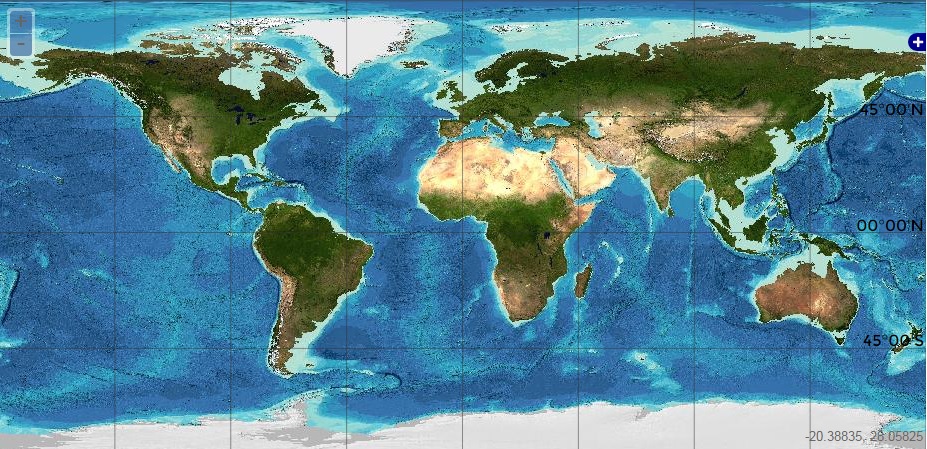
The GEBCO_2020 Grid was released in May 2020 and is the second global bathymetric product released by the General Bathymetric Chart of the Oceans (GEBCO) and has been developed through the Nippon Foundation-GEBCO Seabed 2030 Project. The GEBCO_2020 Grid provides global coverage of elevation data in meters on a 15 arc-second grid of 43200 rows x 86400 columns, giving 3,732,480,000 data points. Grid Development The GEBCO_2020 Grid is a continuous, global terrain model for ocean and land with a spatial resolution of 15 arc seconds. The grid uses as a ‘base’ Version 2 of the SRTM15+ data set (Tozer et al, 2019). This data set is a fusion of land topography with measured and estimated seafloor topography. It is augmented with the gridded bathymetric data sets developed by the four Seabed 2030 Regional Centers. The Regional Centers have compiled gridded bathymetric data sets, largely based on multibeam data, for their areas of responsibility. These regional grids were then provided to the Global Center. For areas outside of the polar regions (primarily south of 60°N and north of 50°S), these data sets are in the form of 'sparse grids', i.e. only grid cells that contain data were populated. For the polar regions, complete grids were provided due to the complexities of incorporating data held in polar coordinates. The compilation of the GEBCO_2020 Grid from these regional data grids was carried out at the Global Center, with the aim of producing a seamless global terrain model. In contrast to the development of the previous GEBCO grid, GEBCO_2019, the data sets provided as sparse grids by the Regional Centers were included on to the base grid without any blending, i.e. grid cells in the base grid were replaced with data from the sparse grids. This was with aim of avoiding creating edge effects, 'ridges and ripples', at the boundaries between the sparse grids and base grid during the blending process used previously. In addition, this allows a clear identification of the data source within the grid, with no cells being 'blended' values. Routines from Generic Mapping Tools (GMT) system were used to do the merging of the data sets. For the polar data sets, and the adjoining North Sea area, supplied in the form of complete grids these data sets were included using feather blending techniques from GlobalMapper software version 11.0, made available by Blue Marble Geographic. The GEBCO_2020 Grid includes data sets from a number of international and national data repositories and regional mapping initiatives. For information on the data sets included in the GEBCO_2020 Grid, please see the list of contributions included in this release of the grid (https://www.gebco.net/data_and_products/gridded_bathymetry_data/gebco_2020/#compilations).
-
-
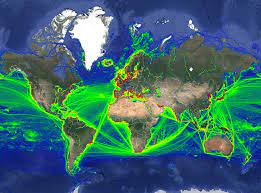
This data was obtained through a partnership with IMF, as part of IMF's World Seaborne Trade Monitoring System (Cerdeiro, Komaromi, Liu and Saeed, 2020). The data analysis was supported by the World Bank’s ESMAP and PROBLUE programs. The dataset contains 6 density layers, with vessel types aggregated to suit the needs of the WBG Offshore Wind Development Program: 1) Commercial ships 2) Fishing ships 3) Oil & Gas [note: this is just platforms, rigs, and FPSOs] 4) Passenger ships 5) Leisure vessels 6) GLOBAL ship density layers of all ship categories combined
-
-

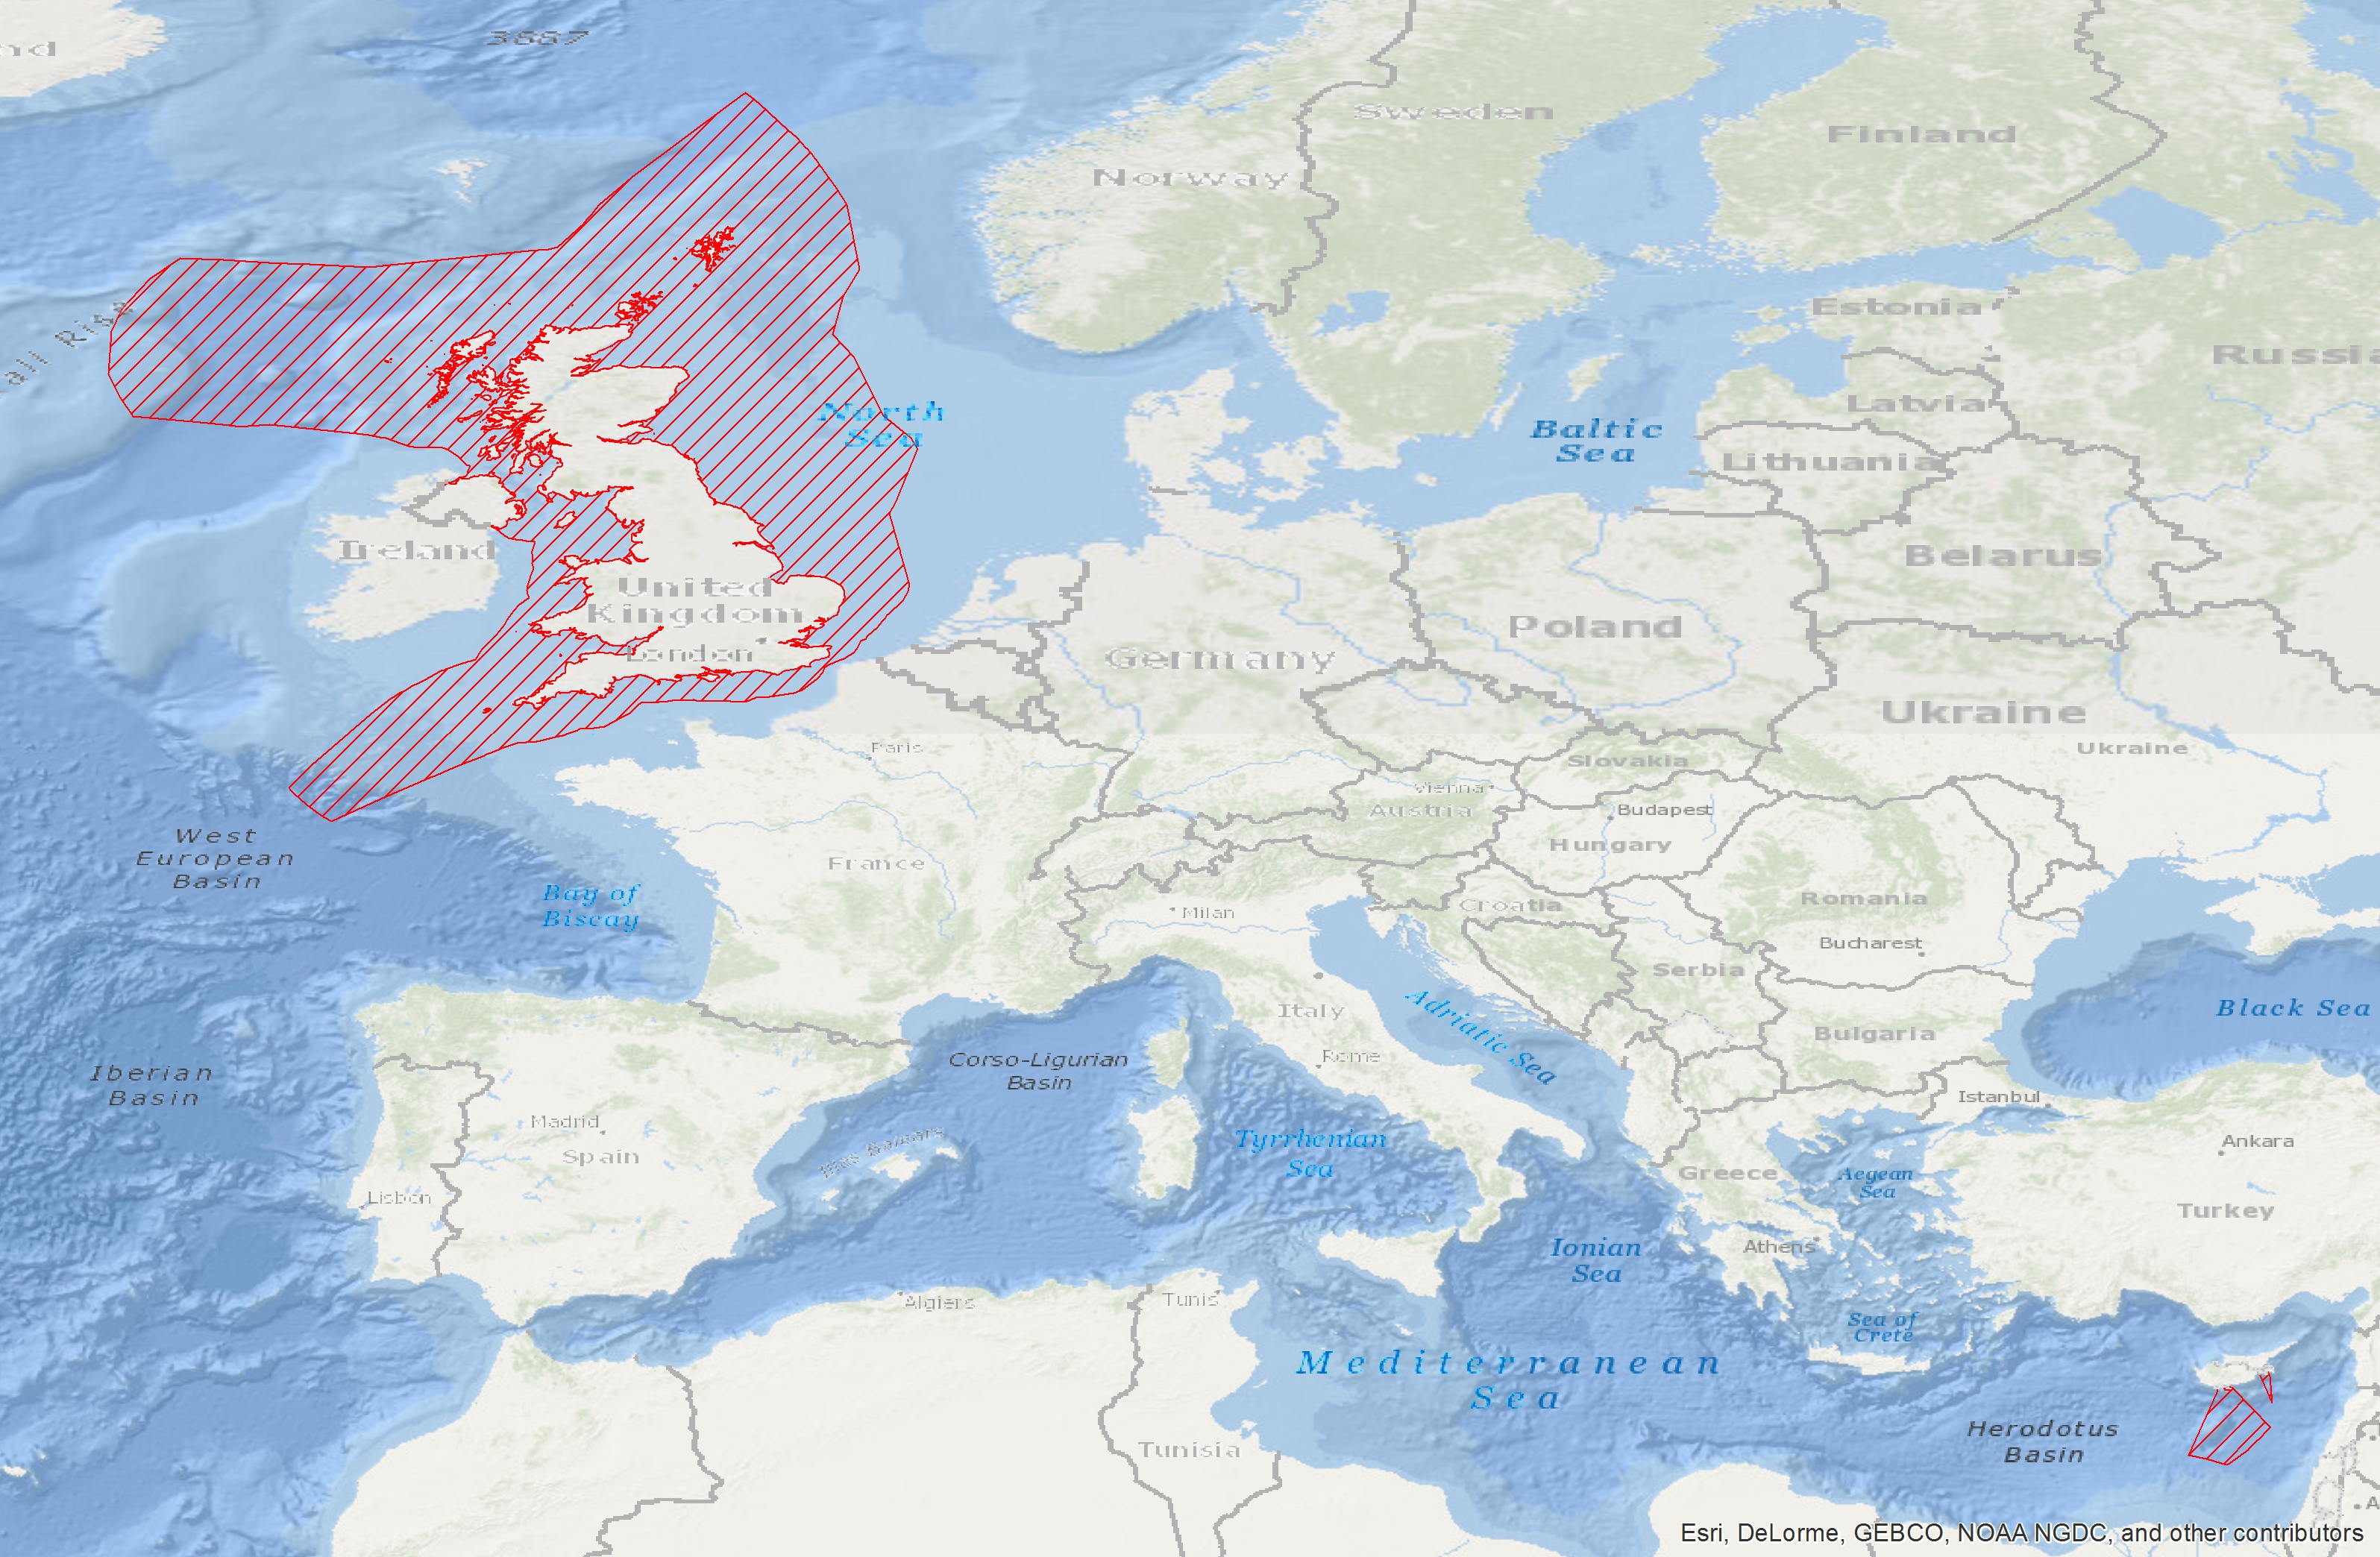
Classification of the seabed in the Atlantic Ocean into broad-scale benthic habitats employing a non-hierarchical top-down clustering approach aimed at informing Marine Spatial Planning. This work was performed at the University of Plymouth in 2021 with data provided by a wide group of partners representing the nations surrounding the Atlantic Ocean. It classifies continuous environmental data into discrete classes that can be compared to observed biogeographical patterns at various scales. It has 3 levels of classification. The numbers in the raster layer correspond to individual classes. Description of these classes is given in McQuaid, K.A. et al. (2023).
-
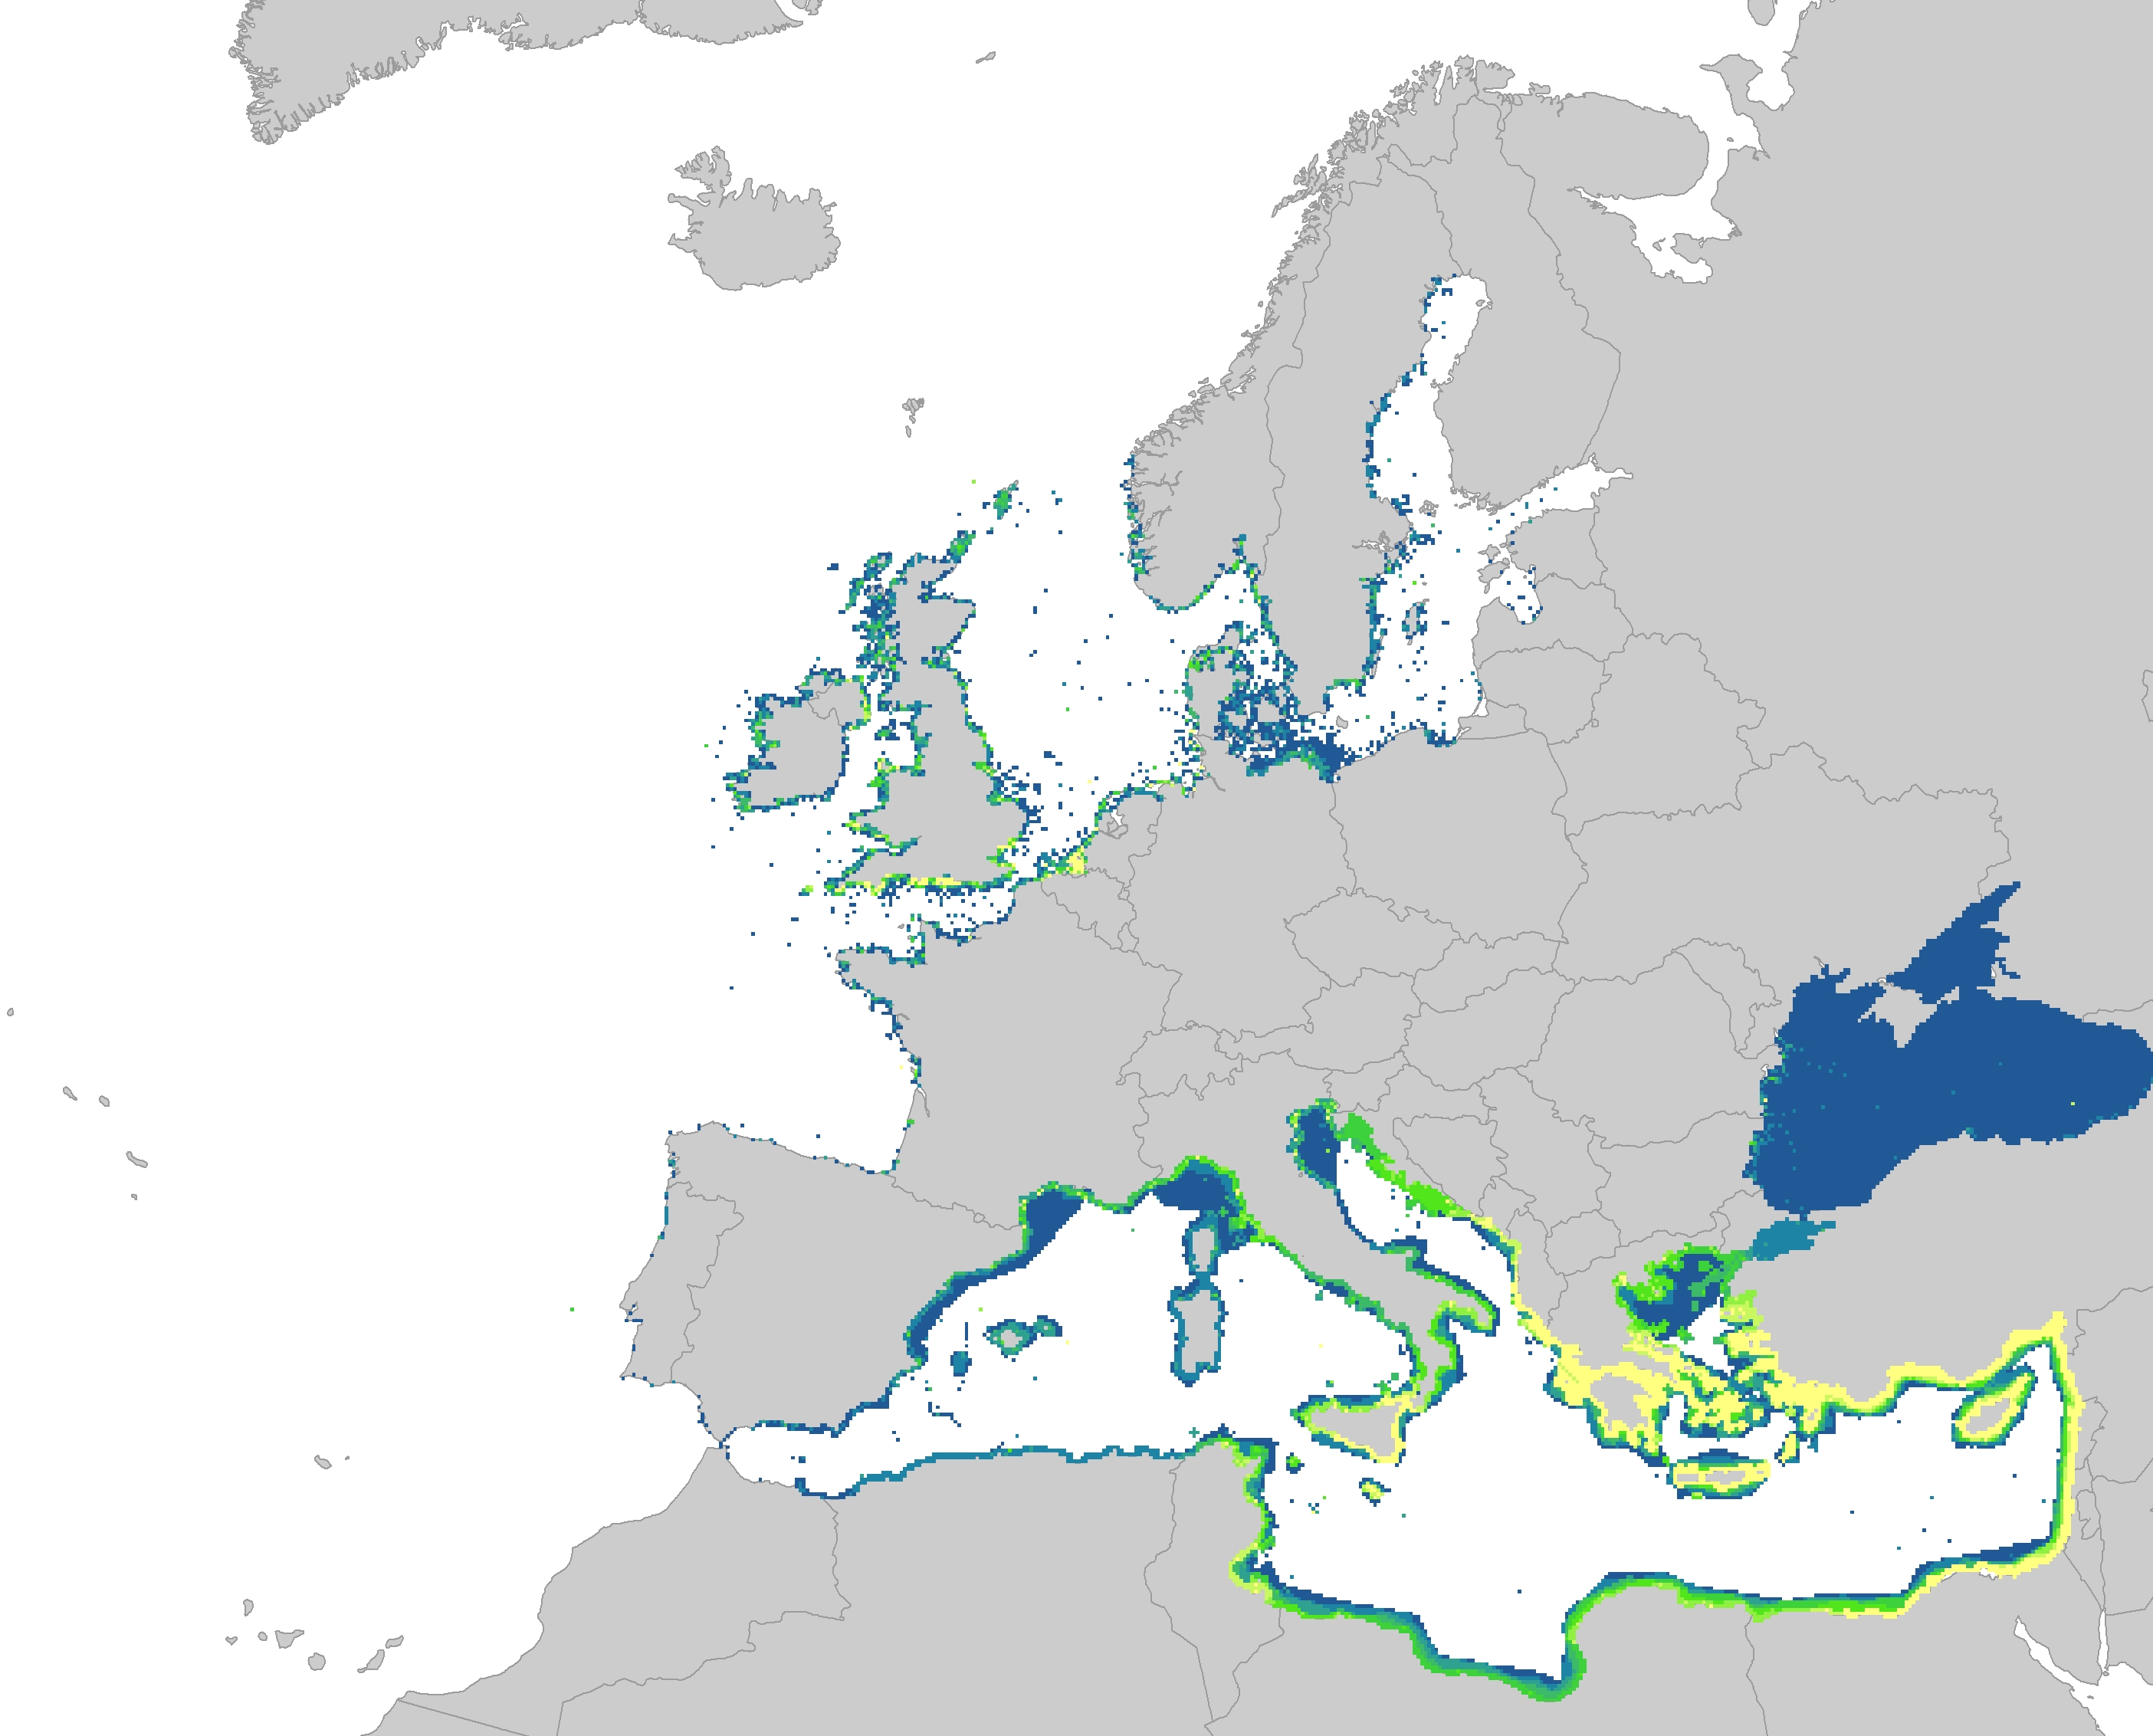
The dataset represents the introduction of non-indigenous species in European seas. Non-indigenous species are species that have been spread as a result of human activities to areas where they do not belong naturally. The main concern are the invasive species, which are defined as causing a significant negative impact on biodiversity as well as serious economic and social consequences. The dataset has been prepared first by individually mapping each aquatic invasive species that had a distinctive distribution area, which had been provided by several non-indigenous species online databases. The distribution of the species were then resampled into the EEA 10 km grid and summed together, showing the number of non-indigenous species per grid cell. The temporal reference of the dataset covers the last 30 years (1989 - 2018). This dataset has been prepared for the calculation of the combined effect index, produced for the ETC/ICM Report 4/2019 "Multiple pressures and their combined effects in Europe's seas" available on: https://www.eionet.europa.eu/etcs/etc-icm/etc-icm-report-4-2019-multiple-pressures-and-their-combined-effects-in-europes-seas-1.
-
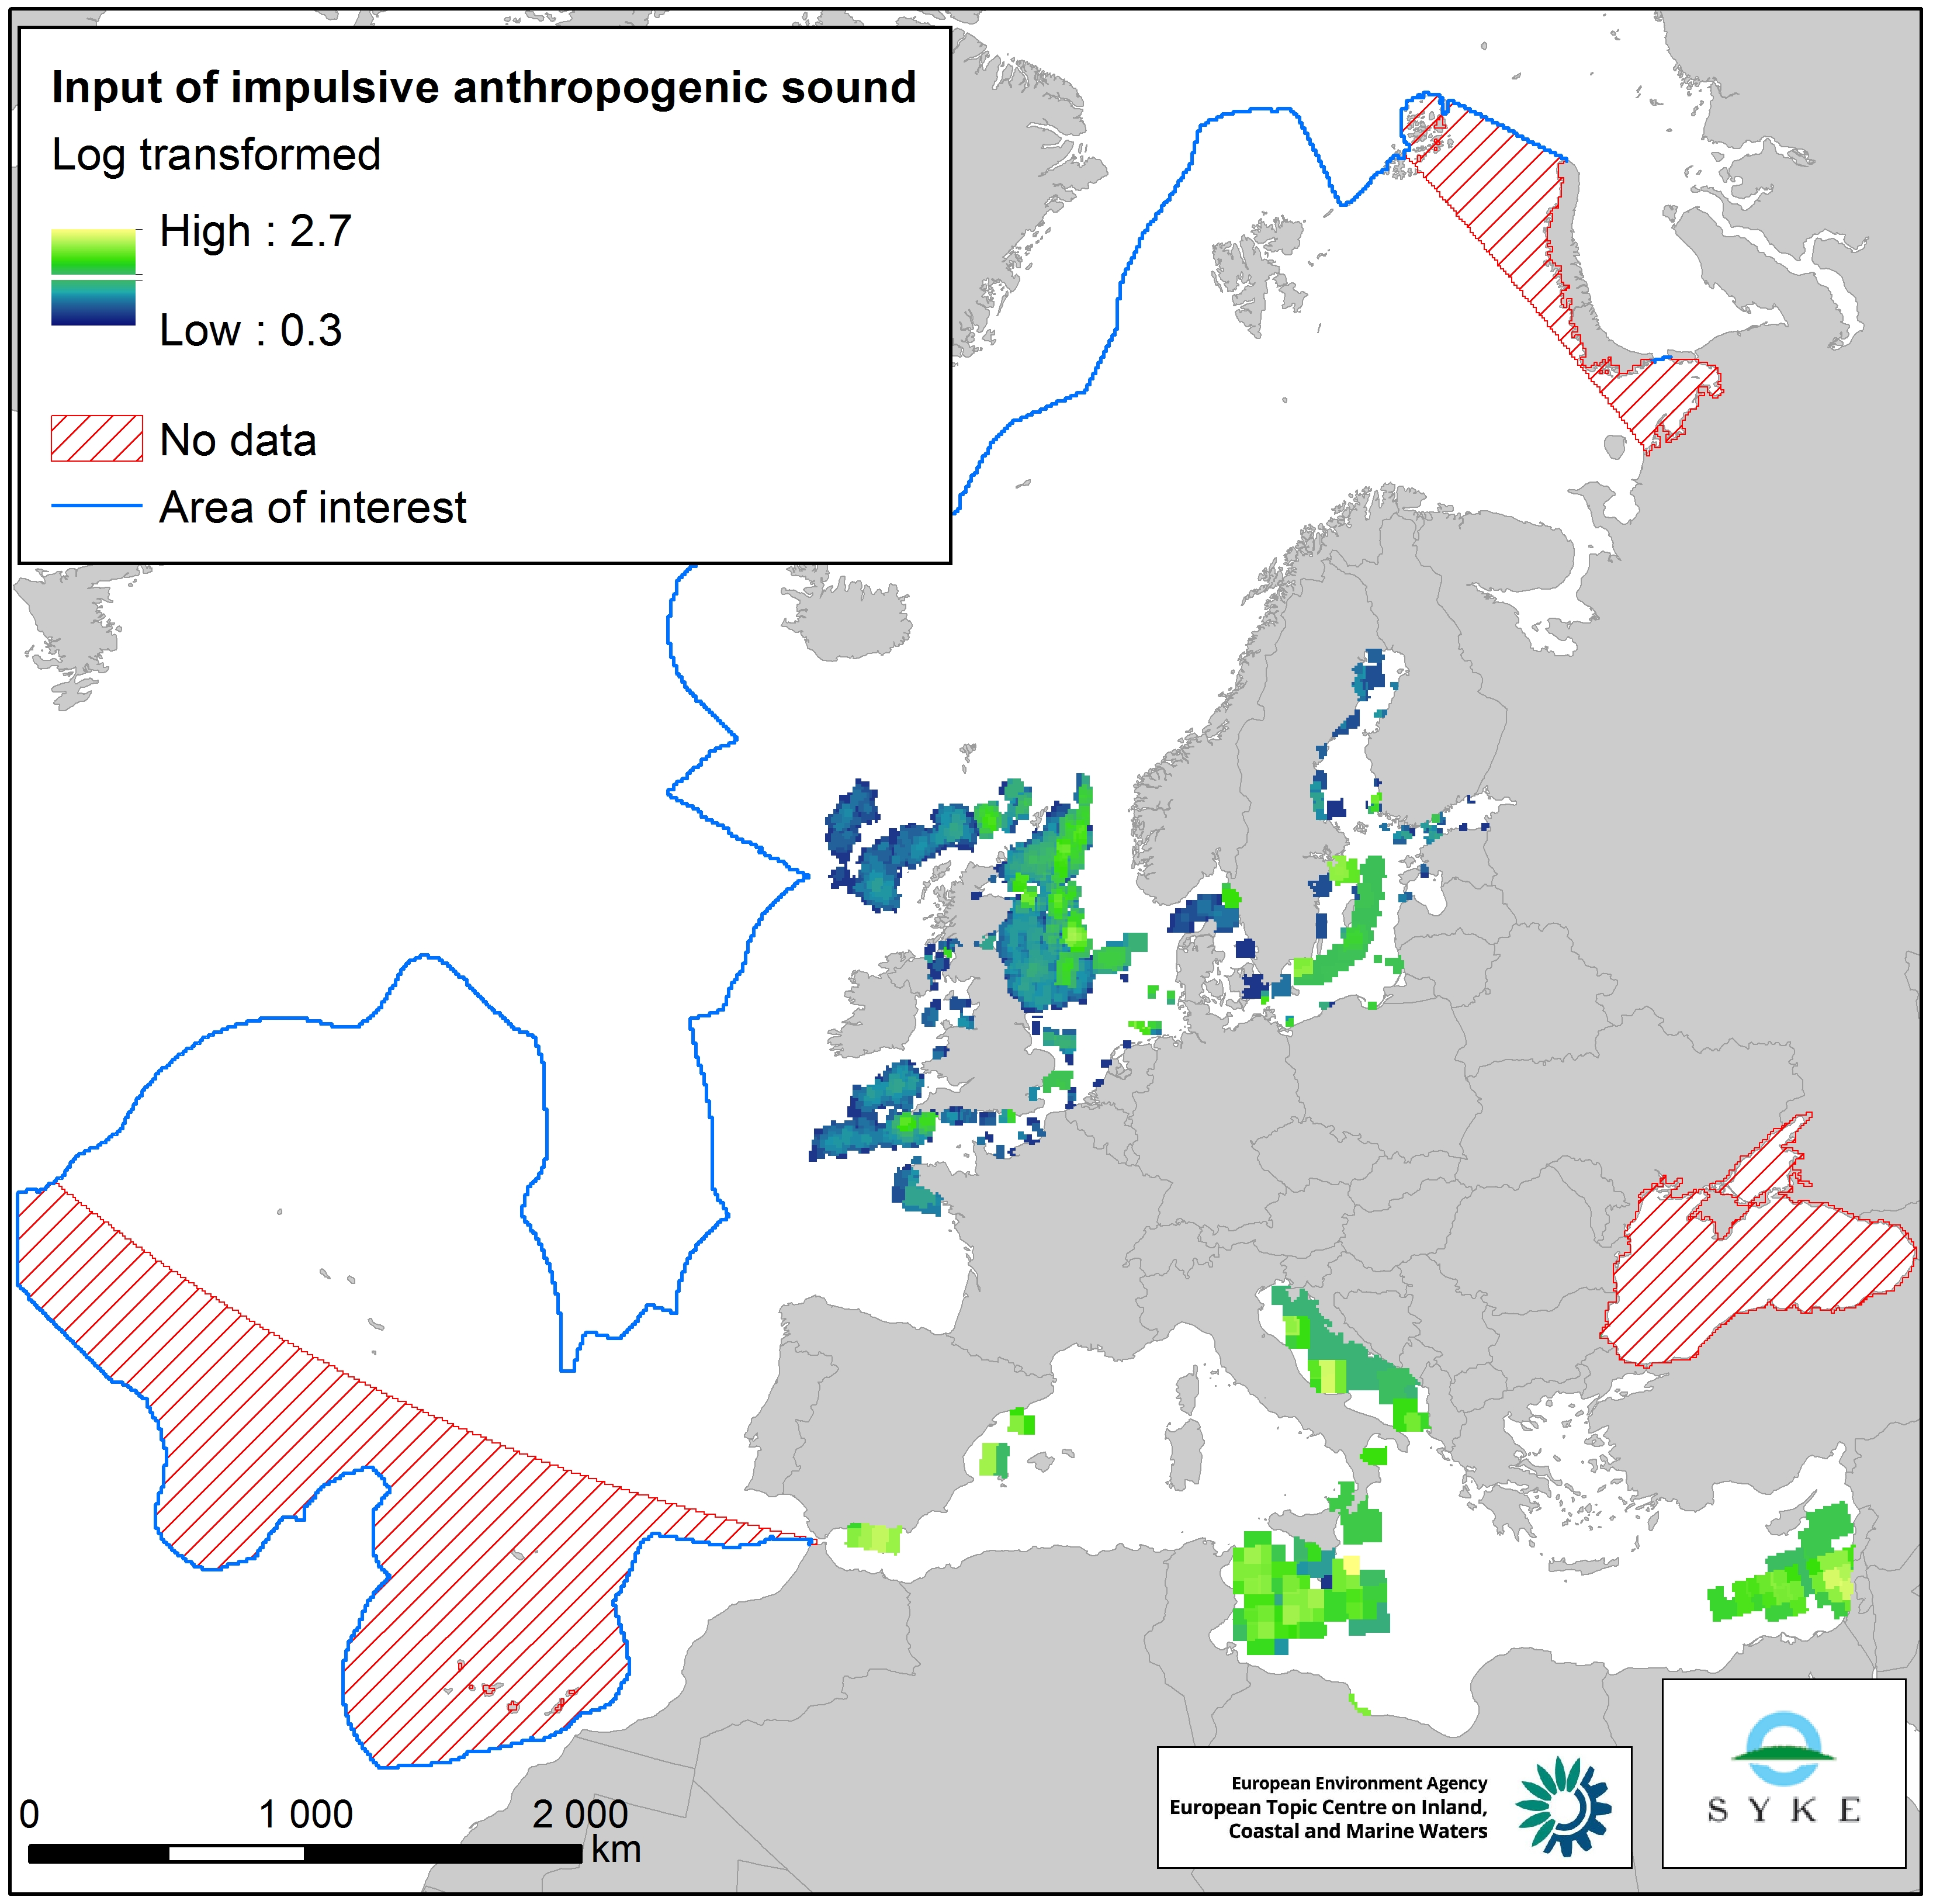
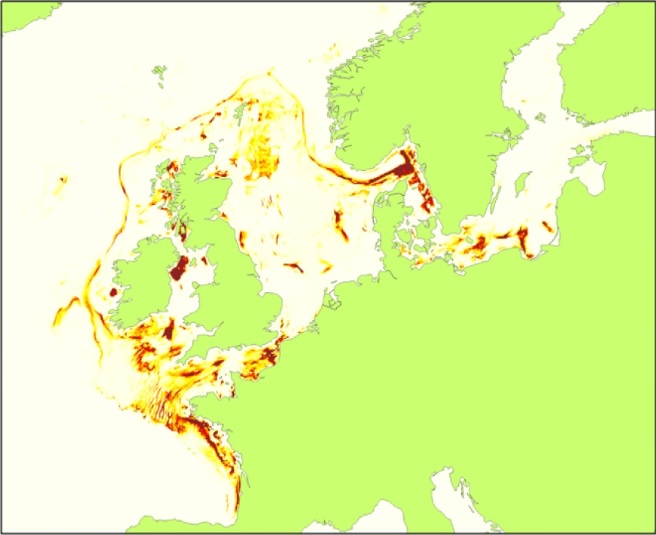
This raster dataset represents input of impulsive anthropogenic sound in Europe Seas. Impulsive sounds are typically brief with a rapid rise time, i.e. a great change in amplitude over a short period of time. The main anthropogenic sources of impulsive underwater noise are typically impact pile driving for inshore and offshore construction, seismic exploration with airguns, explosions and sonar systems. The dataset was created by combining pulse-block-days (PBD) data from the ICES Registry (for HELCOM and OSPAR areas) and ACCOMBAS (for the Mediterranean Sea), resampled using the EEA 10 km grid. The dataset does not include the Black Sea. The temporal reference of this dataset is the period 2014-2016. The cell values have been transformed into a logarithmic scale (log10). This dataset has been prepared for the calculation of the combined effect index, produced for the ETC/ICM Report 4/2019 "Multiple pressures and their combined effects in Europe's seas" available on: https://www.eionet.europa.eu/etcs/etc-icm/etc-icm-report-4-2019-multiple-pressures-and-their-combined-effects-in-europes-seas-1.
-
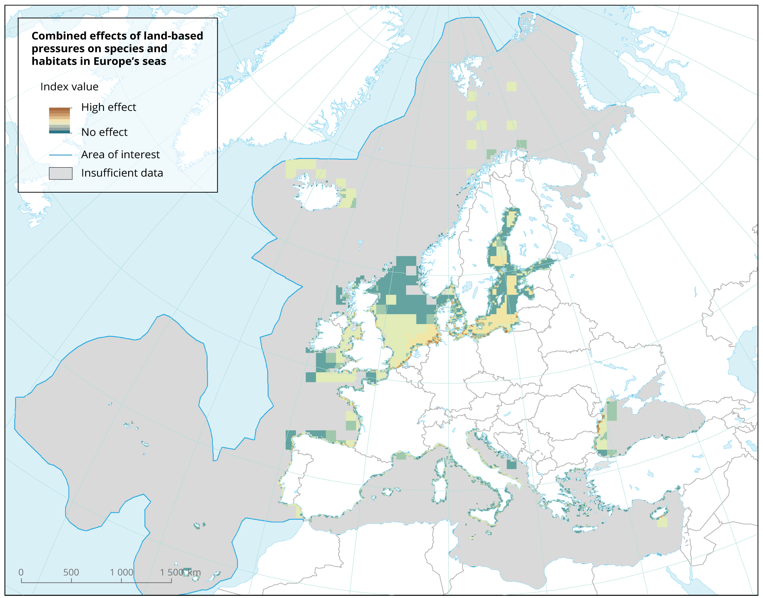
The dataset presents the potential combined effects of land-based pressures on marine species and habitats estimated using the method for assessment of cumulative effects, for the entire suite of pressures and a selected set of marine species groups and habitats by an index (Halpern et al. 2008). The spatial assessment of combined effects of multiple pressures informs of the risks of human activities on the marine ecosystem health. The methodology builds on the spatial layers of pressures and ecosystem components and on an estimate of ecosystem sensitivity through an expert questionnaire. The raster dataset consists of a division of the Europe's seas in 10km and 100 km grid cells, which values represents the combined effects index values for pressures caused by land-based human activities. The relative values indicate areas where the pressures potentially affect the marine ecosystem. This dataset underpins the findings and cartographic representations published in the report "Marine Messages" (EEA, 2020).
-
-
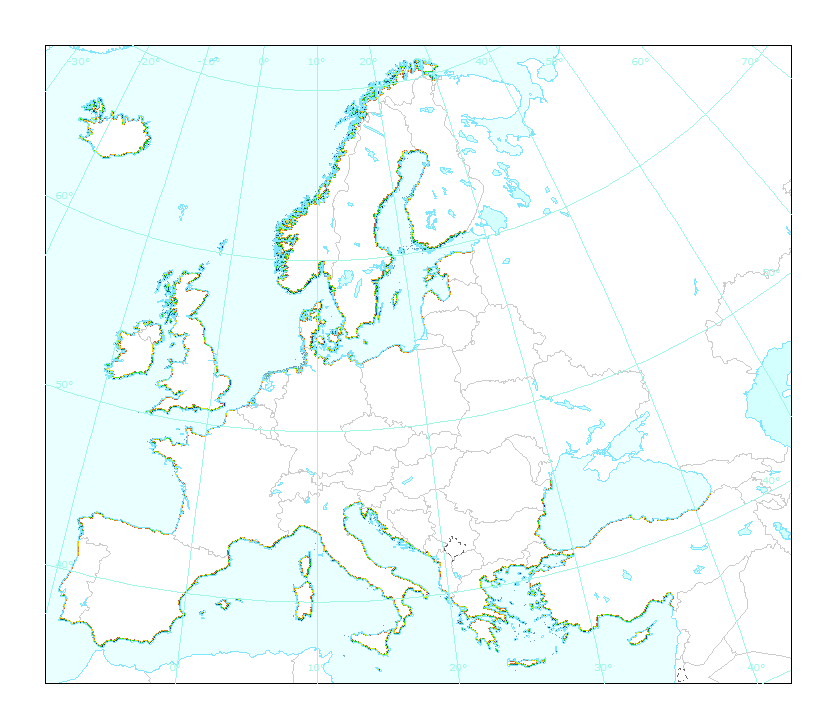
This dataset is the coastal zone land surface region from Europe, derived from the coastline towards inland, as a series of 10 consecutive buffers of 1km width each. The coastline is defined by the extent of the Corine Land Cover 2018 (raster 100m) version 20 accounting layer. In this version all Corine Land Cover pixels with a value of 523, corresponding to sea and oceans, were considered as non-land surface and thus were excluded from the buffer zone.