 Catalogue PIGMA
/Observational data
Type of resources
Available actions
Topics
Keywords
Contact for the resource
Provided by
Years
Representation types
Update frequencies
status
Scale
Resolution
-
Ocean-surface optical parameters: reflectances
-
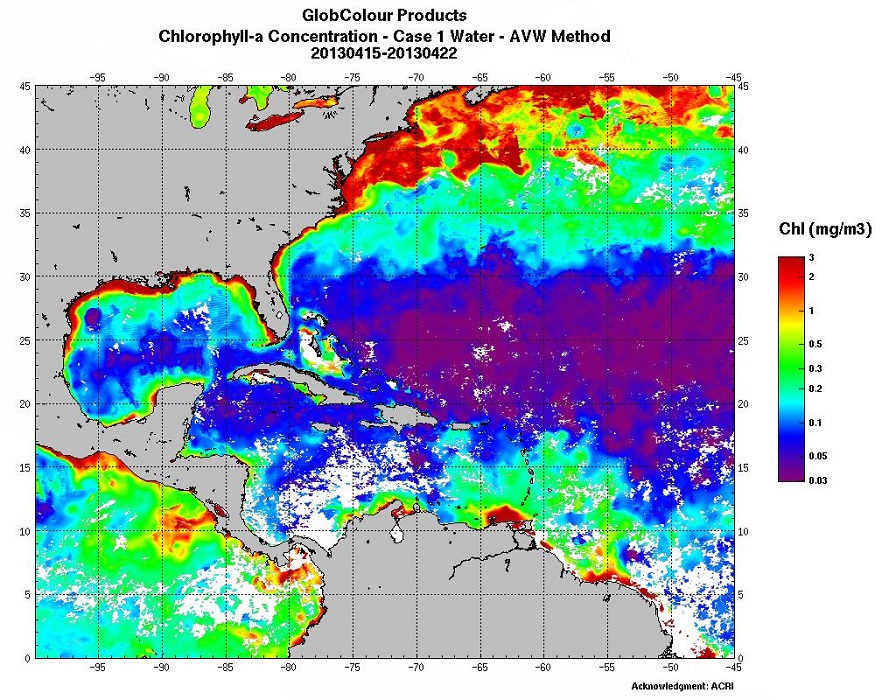
Biological parameters: Chlorophyll (several algorithms), Particulate Organic/Inorganic Carbon, Fluorescence…
-
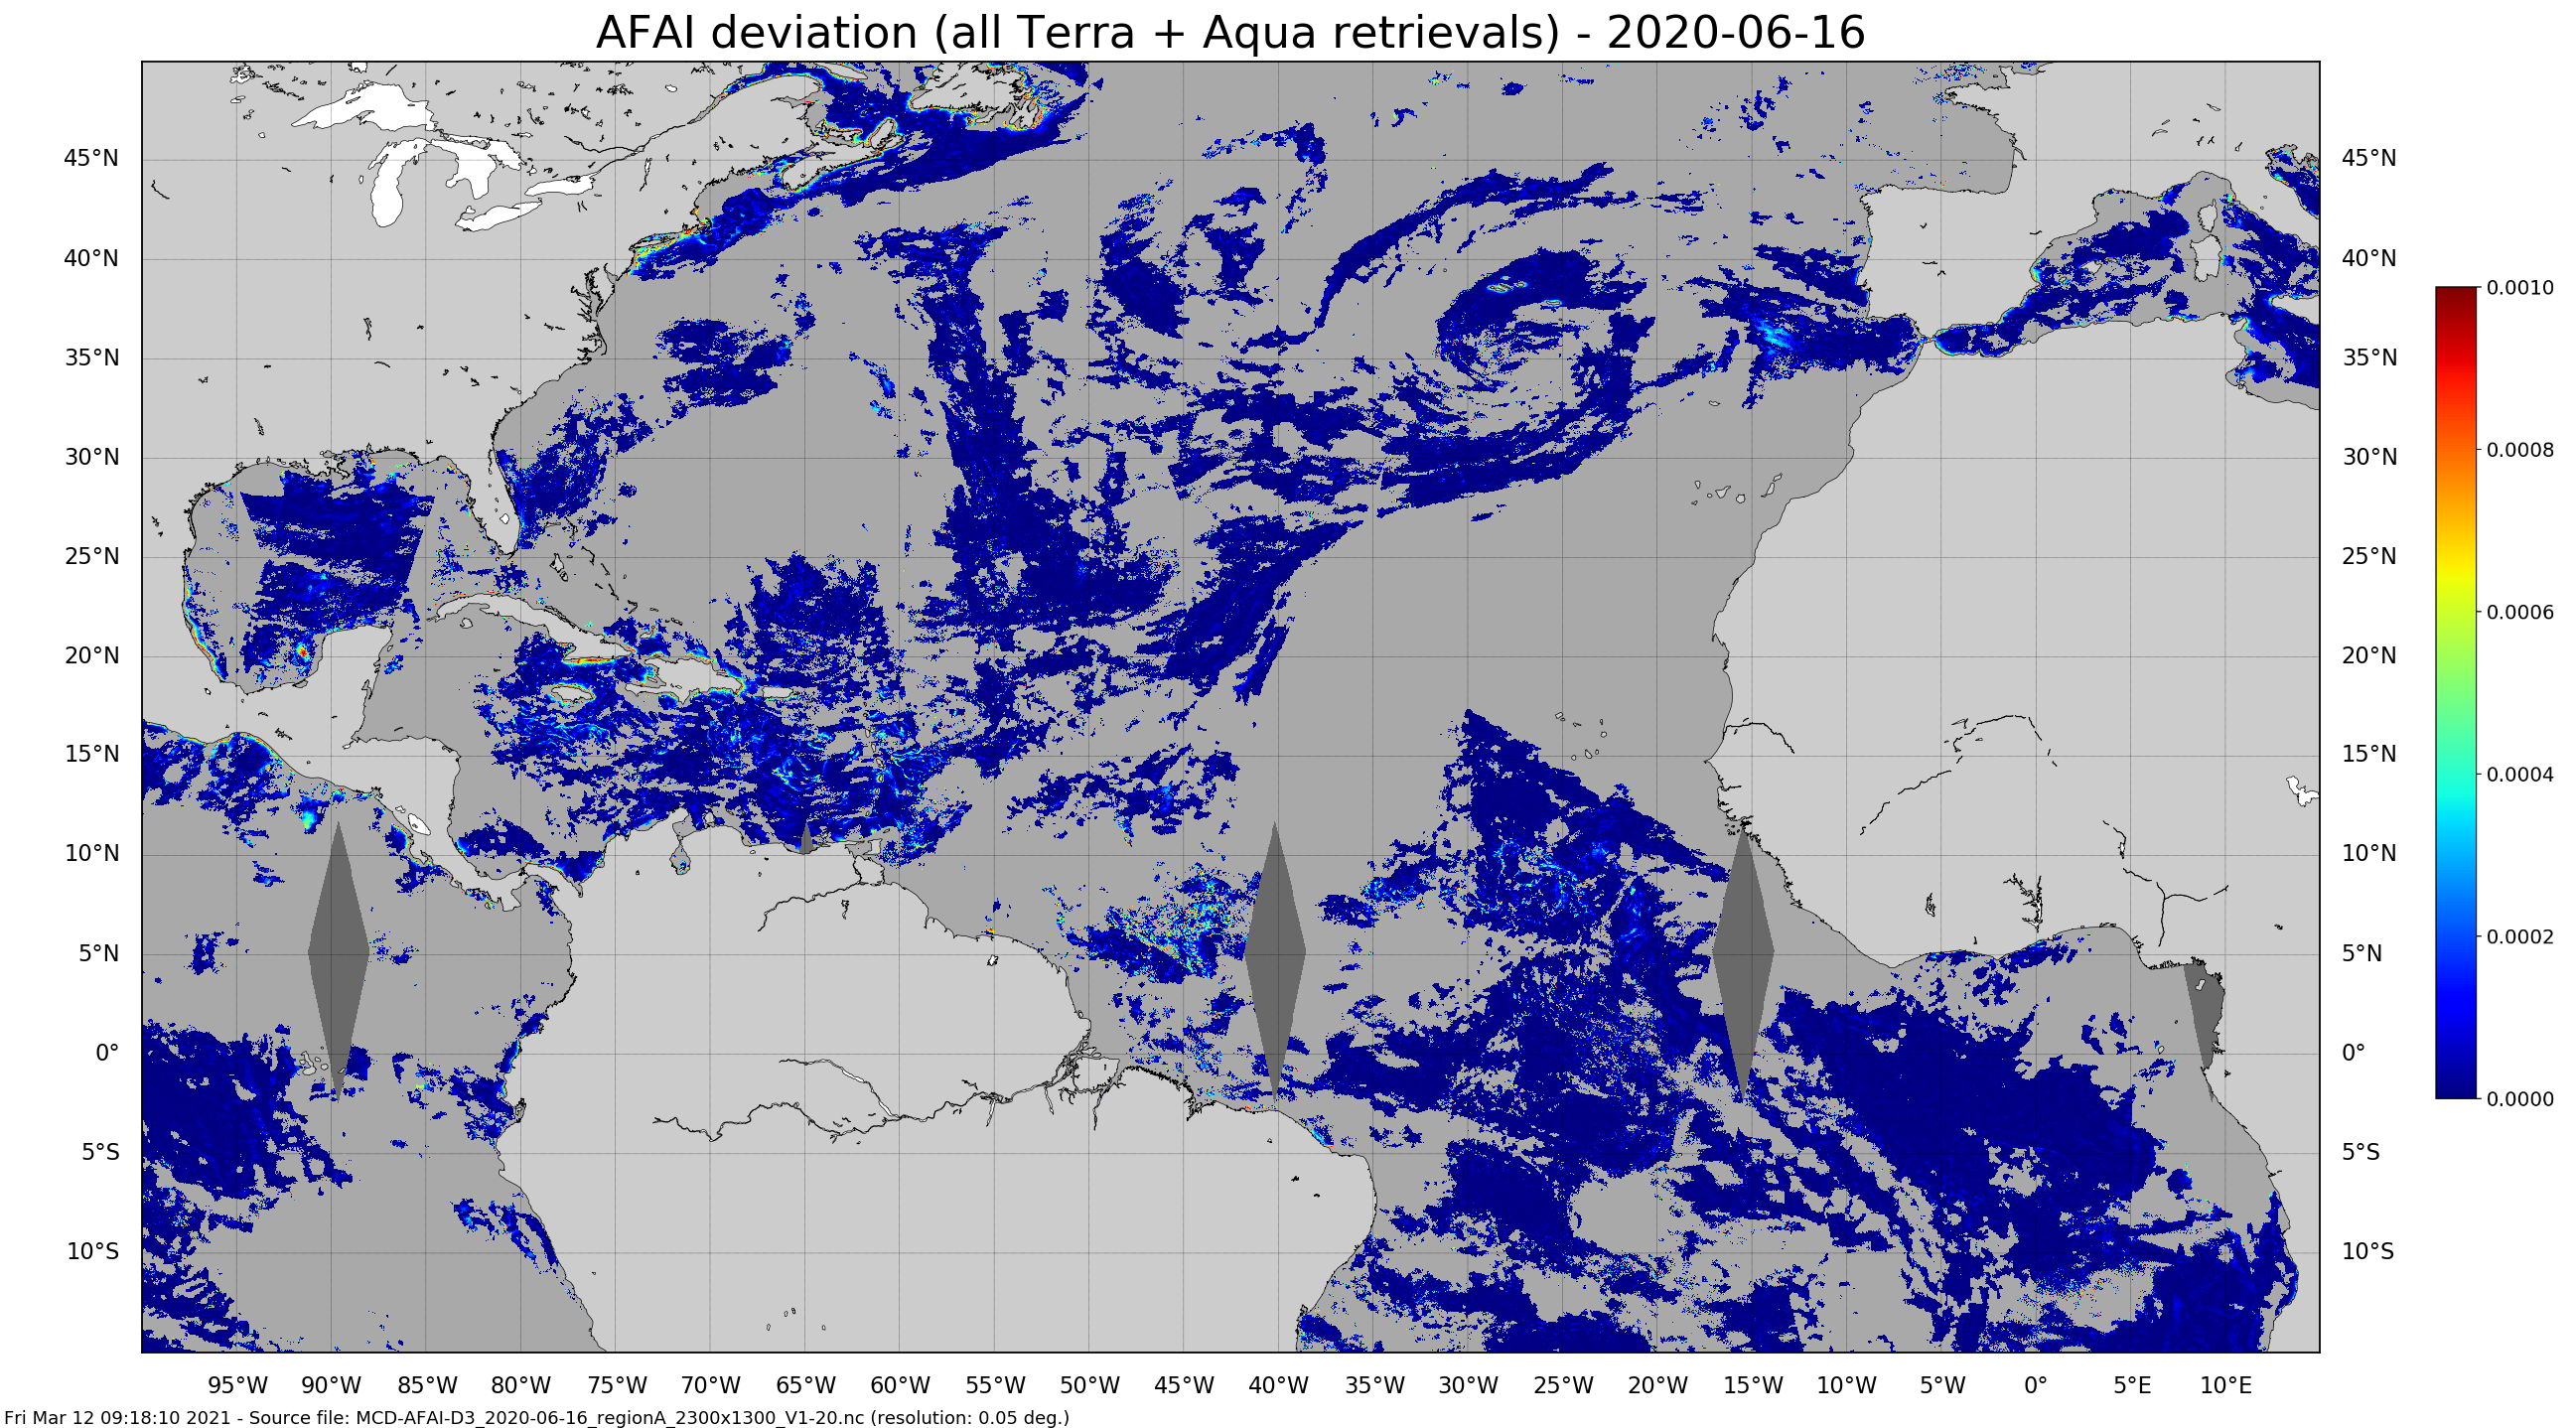
Daily gridded Sargassum area coverage derived from MODIS Terra and Aqua observations over the Atlantic, produced with the AFAI (Alternative Floating Algae Index)-based SAREDA (SArgassum Evolving Distribution in the Atlantic) algorithm.
-
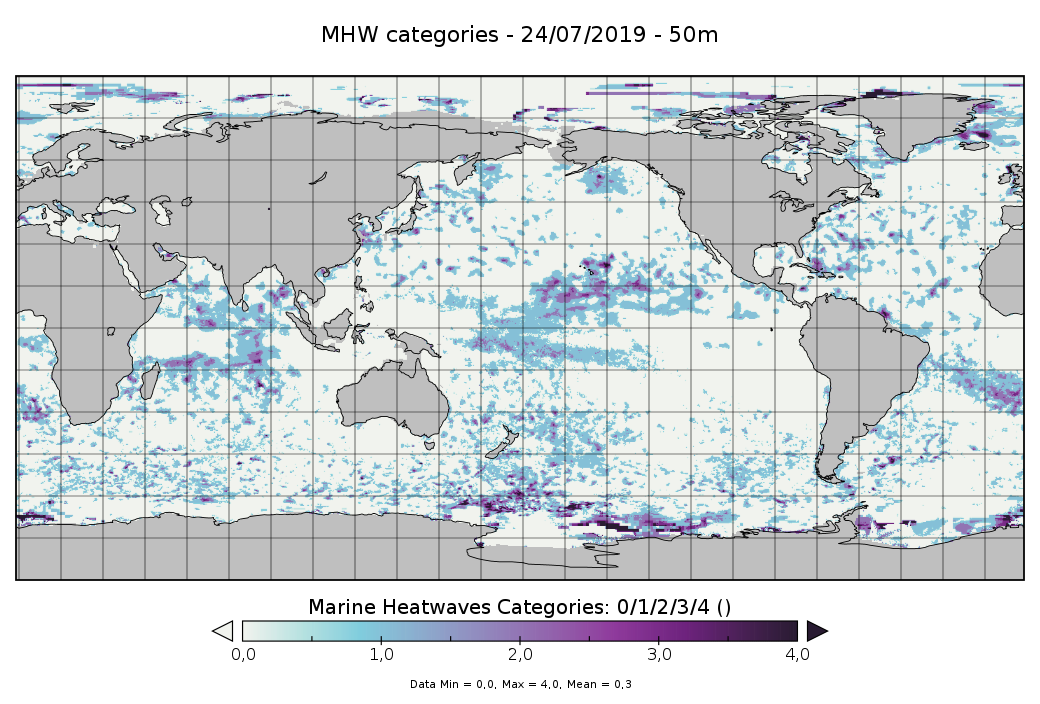
These datasets contain 4D (x, y, z, t) weekly temperature and marine heatwaves (MHW) categories estimated from the surface up to 300-m depth, at a 0.25°x0.25° horizontal grid resolution and for 4 areas of interest that are: • Area 1 (around the Madeira Islands): 30°N-35°N, 15°W-20°W • Area 2 (Tropical Pacific Ocean): 30°S-30°N, 120°E-130°W • Area 3 (Mediterranean Sea): 40°N-45°N, 15°W-20°W • Area 4 (Global): 82.875°S-89.875°N, 0.125°E-359.875°E The weekly MHW are centered on the date of the file (±3days). For the temperature reconstruction, 2 approaches have been used: - for the regional areas, the temperature has been computed with a 2 steps method: a first estimate of the vertical temperature profiles by using a machine learning approach (Multi-Layer Perceptron (MLP)) and then, a combination of this field with in situ temperature profiles observations through an optimal interpolation algorithm. The Copernicus Marine Service ARMOR3D dataset was used as the targeted temperature field for the MLP. The input data used are: • First step: ◦ SST data are from daily OSTIA analyses [from Copernicus Marine Service: SST_GLO_SST_L4_REP_OBSERVATIONS_010_011 product] interpolated over the 0.25°x0.25° targeted grid resolution; ◦ SLA data are from the Copernicus Marine Service product SEALEVEL_GLO_PHY_L4_REP_OBSERVATIONS_008_047/dataset-duacs-rep-global-merged-allsat-phy-l4 • Second step: ◦ The in situ data are from the Copernicus Marine Service In Situ TAC and contains several observations type: CTD, Argo floats, drifting buoys, moorings, marine mammals). - For the global area, the temperature comes from the Copernicus Marine Service product ARMOR3D (MULTIOBS_GLO_PHY_TSUV_3D_MYNRT_015_012 (https://doi.org/10.48670/moi-00052). The MHW categories are derived from the Hobday’s method [Hobday et al.,2018] for the 4 areas. Each MHW event is classified among four categories (moderate to extreme), identified in terms of multiples of the local difference between the 90th percentile and climatological values, and defined as moderate (1-2×, Category I), strong (2-3×, Category II), severe (3-4×, Category III), and extreme (>4×, Category IV). When the category is zero, this means that there is no MHW. The period 1993-2021 is used as a baseline for defining the climatology to be as close as possible to the 30-year period suggested by Hobday. This choice is motivated by the need of altimetry data to constrain the vertical temperature reconstruction, which is required for most ocean reanalyses as well, therefore the baseline period slightly differs from the one used for the 2D atlas.
-
'''Short description:''' For the Global Ocean- In-situ observation yearly delivery in delayed mode. The In Situ delayed mode product designed for reanalysis purposes integrates the best available version of in situ data for temperature and salinity measurements. These data are collected from main global networks (Argo, GOSUD, OceanSITES, World Ocean Database) completed by European data provided by EUROGOOS regional systems and national system by the regional INS TAC components. It is updated on a yearly basis. The time coverage has been extended in the past by integration of EN4 data for the period 1950-1990. Acces through CMEMS Catalogue after registration: http://marine.copernicus.eu/ '''Detailed description: ''' Ocean circulation models need information on the interior of the ocean to be able to generate accurate forecast. This information is only available from in-situ measurement. However this information is acquired all around the world and not easily available to the operational users. Therefore, INS TAC , by connecting to a lot of international networks, collects, controls and disseminates the relevant in-situ data to operational users . For reanalysis purposes, operational centres needs to access to the best available datasets with the best possible coverage and where additional quality control procedures have been performed. This dataset suits research community needs Each year, a new release of this product is issued containing all the observations gathered by the INS TAC global component operated by Coriolis. '''Processing information:''' From the near real time INS TAC product validated on a daily and weekly basis for forecasting purposes, a scientifically validated product is created . It s a ""reference product"" updated on a yearly basis. This product has been controlled using an objective analysis (statistical tests) method and a visual quality control (QC). This QC procedure has been developed with the main objective to improve the quality of the dataset to the level required by the climate application and the physical ocean re-analysis activities. It provides T and S weekly gridded fields and individual profiles both on their original level and interpolated level. The measured parameters, depending on the data source, are : temperature, salinity. The reference level of measurements is immersion (in meters) or pressure (in decibars). The EN4 data were converted to the CORA NetCDF format without any additional validation. '''Quality/accuracy/calibration information:''' The process is done in two steps using two different time windows, corresponding to two runs of objective analysis, with an additional visual QC inserted between. The first run was done on a window of three weeks, to capture the most doubtful profiles which were then checked visually by an operator to decide whether or not it was bad data or real oceanic phenomena. The second run was done on a weekly basis to fit the modelling needs. '''Suitability, Expected type of users / uses: ''' The product is designed for assimilation into operational models operated by ocean forecasting centres for reanalysis purposes or for research community. These users need data aggregated and quality controlled in a reliable and documented manner.
-
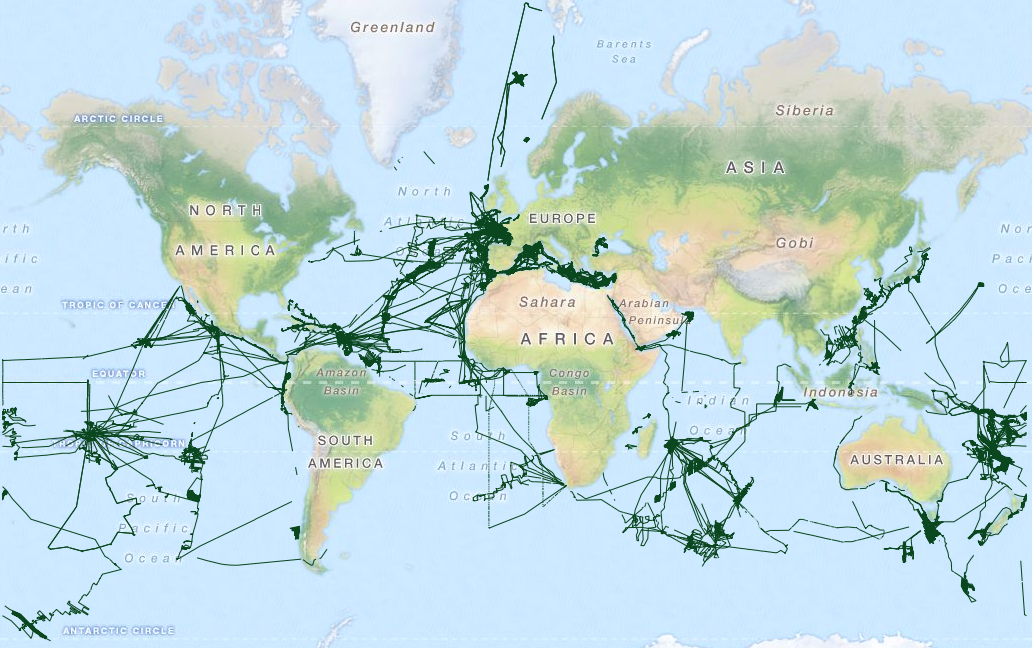
Raw single-beam echosounder data archived at SISMER, acquired: - by oceanographic vessels and national equipment managed by the French Oceanographic Fleet (FOF) - by foreign oceanographic vessels in collaboration with Ifremer - by Ifremer's historic vessels (Jean Charcot, Nadir, Suroit) operated before the FOF was set up
-

Atmosphere optical parameters: aerosol thickness, cloud fraction, water vapour column…
-

In order to manage coastal monitoring data, Ifremer has developed the Quadrige information system which connects a database to a wide array of tools for interpreting and designing information products. Quadrige is just one element of the Water Information System (SIE) www.eaufrance.fr and, as such, contributes toward the work of the French National Adminitrative Service for Water-Related Data (SANDRE) www.sandre.eaufrance.fr. The main aim of the Quadrige thematic databank is to manage and enhance data from coastal observation and monitoring networks. On a national level, Quadrige is today designated by the French Environment Ministry as the definitive information system for coastal waters, and the tool is therefore common to all of those working in the marine environment sector. The Quadrige databank is composed of data from the Quadrige database and products described or made available on the Envlit website. The Quadrige database contains results about most physical, chemical and biological environmental description parameters. The first data for example dates back to 1974 for the parameters relating to general water quality and contaminants, 1987 for phytoplankton and phycotoxins, 1989 for microbiology, from the early 2000s for the benthic zone. The data is permanently being updated. In Quadrige, an observation location is a geographical location where observations, measurements and/or samples will be taken. These locations can be located in a unique way thanks to their appearance on a map (polygon, line or point). A measurement location can be used by multiple programmes.