 Catalogue PIGMA
Keyword
Channel-North Sea
Type of resources
Topics
Keywords
Contact for the resource
Provided by
Representation types
Update frequencies
status
From
1
-
1
/
1
-
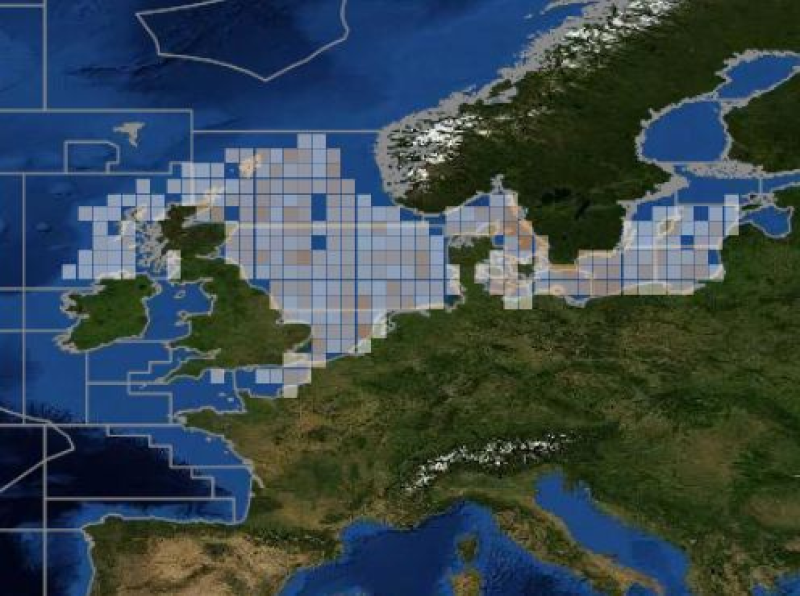
ICES database of trawl surveys