 Catalogue PIGMA
Courants
Type of resources
Available actions
Topics
Keywords
Contact for the resource
Provided by
Years
Formats
Representation types
Update frequencies
status
Scale
Resolution
-

These gridded products are produced from the along-track (or Level-3) SEA LEVEL products (DOI: doi.org/10.48670/moi-00147) delivered by the Copernicus Marine Service (CMEMS, marine.copernicus.eu) for satellites SARAL/AltiKa, Cryosat-2, HaiYang-2B, Jason-3, Copernicus Sentinel-3A&B, Sentinel 6A, SWOT nadir, and SWOT Level-3 KaRIn sea level products (DOI: https://doi.org/10.24400/527896/A01-2023.018). Three mapping algorithms are proposed: MIOST, 4DvarNET, 4DvarQG: - the MIOST approach which give the global SSH solutions: the MIOST method is able of accounting for various modes of variability of the ocean surface topography (e.g., geostrophic, barotrope, equatorial waves dynamic …) by constructing several independent components within an assumed covariance model. - the 4DvarNET approach for the regional SSH solutions: the 4DvarNET mapping algorithm is a data-driven approach combining a data assimilation scheme associated with a deep learning framework. - the 4DvarQG approach for the regional SSH solutions: the 4DvarQG mapping technique integrates a 4-Dimensional variational (4DVAR) scheme with a Quasi-Geostrophic (QG) model. References: - Ballarotta, M., Ubelmann, C., Bellemin-Laponnaz, V., Le Guillou, F., Meda, G., Anadon, C., Laloue, A., Delepoulle, A., Faugère, Y., Pujol, M.-I., Fablet, R., and Dibarboure, G., 2024: Integrating wide swath altimetry data into Level-4 multi-mission maps, EGUsphere [preprint], https://doi.org/10.5194/egusphere-2024-2345 - Beauchamp, M., Febvre, Q., Georgenthum, H., and Fablet, R., 2023: 4DVarNet-SSH: end-to-end learning of variational interpolation schemes for nadir and wide-swath satellite altimetry, Geosci. Model Dev., 16, 2119–2147, https://doi.org/10.5194/gmd-16-2119-2023 - Fablet, R., Beauchamp, M., Drumetz, L., and Rousseau, F., 2021: Joint Interpolation and Representation Learning for Irregularly Sampled Satellite-Derived Geophysical Fields, Front. Appl. Math. Stat., 7, 655224, https://doi.org/10.3389/fams.2021.655224 - Le Guillou, F., Metref, S., Cosme, E., Ubelmann, C., Ballarotta, M. Le Sommer, J. Verron, J., 2021: Mapping Altimetry in the Forthcoming SWOT Era by Back-and-Forth Nudging a One-Layer Quasigeostrophic Model, J. Atmos. Oceanic Technol., 38, 697–710, https://doi.org/10.1175/JTECH-D-20-0104.1 - Ubelmann, C., Dibarboure, G., Gaultier, L., Ponte, A., Ardhuin, F., Ballarotta, M., & Faugère, Y., 2021: Reconstructing ocean surface current combining altimetry and future spaceborne Doppler data. Journal of Geophysical Research: Oceans, 126, e2020JC016560. https://doi.org/10.1029/2020JC016560
-
This dataset contains the version 3 of combined surface current velocities, i.e. absolute geostrophic velocities products from multi-satellite observations over Global Ocean added to Hs depth Ekman velocities computed from ECMWF wind stress with an Ekman model fitted onto drifting buoys[Rio et al. 2014], on a geographical grid with 0.25 degree resolution, from 1993 to 2017.
-

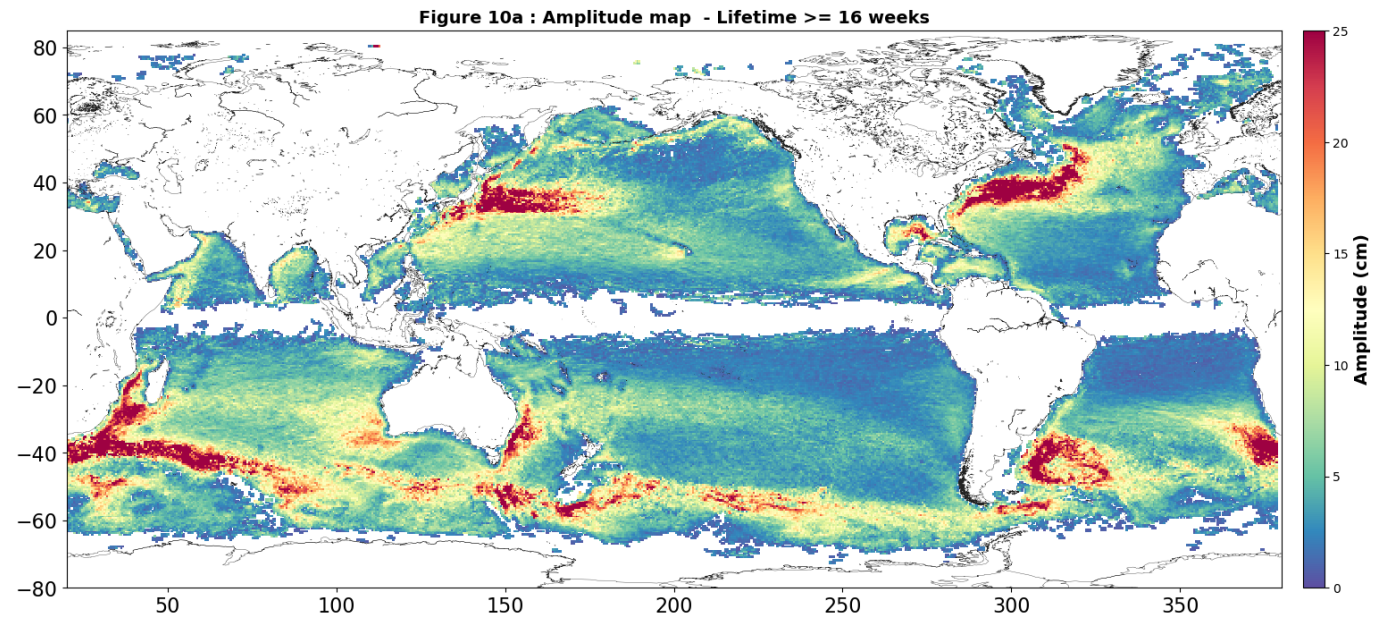
Tourbillons détectés en temps différé (Delayed-Time - DT) pour toute la période [1993 - aujourd'hui]. Les variables fournies incluent pour chaque fichier journalier, et pour un type de rotation (Cyclonique/Anticyclonique) : - Position du centre (Longitude et latitude du centre du cercle le mieux ajusté avec le contour de la vitesse géostrophique moyenne circonférentielle maximale) ; - Amplitude (|SSH(local_extremum) - SSH(outermost_contour)|) ; - Rayon de vitesse (Rayon du cercle de meilleur ajustement avec le contour de la vitesse géostrophique moyenne circonférentielle maximale) ; - Vitesse moyenne (Vitesse géostrophique moyenne du contour définissant le rayon de vitesse) ; - Profil de vitesse (profil des valeurs moyennes de vitesse du contour effectif vers l'intérieur jusqu'au plus petit contour intérieur) ; - Contour effectif (Plus grand contour du tourbillon détecté) ; - Contour de vitesse (Contour de la vitesse géostrophique moyenne circonférentielle maximale pour le tourbillon détecté). Les cartes "tous satellites" (Allsat) sont construites avec tous les satellites disponibles à un moment donné, améliorant la représentation des petites échelles dans les cartes en raison de la diversité de la localisation des traces et des différentes périodes de répétition des missions altimétriques. Les données utilisées sont les données quotidiennes en temps différé "Allsat" DUACS2021 version https://doi.org/10.48670/moi-00148, avec la variable " Gridded Global Absolute Dynamic Topographies (ADT)" du Copernicus Marine Service (CMEMS) http://marine.copernicus.eu/. Plusieurs autres versions existent : Temps différé "Twosat" et une version en temps réel, décrites sur d'autres fiches de métadonnées. Gamme de produit : produit altimétrique dérivé des produits Ssalto/Duacs, grillé multimissions Contenu : trajectoires des tourbillons détectés dans les données altimétriques Format : NetCDF-4 Classic with CF standards. Statistical analysis document (Figures following Chelton et al. 2011): https://www.aviso.altimetry.fr/fileadmin/documents/data/products/value-added/META3.2_allsat_report.pdf Reading software: examples in Python programming language. Details on Aviso+ Users Newsletter #14, page 4: Tools for the Mesoscale Eddy Trajectory Atlas, https://www.aviso.altimetry.fr/fileadmin/documents/newsstand/Newsletter/aviso_newsletter_14.pdf#page=4 Code delivery: the open source code is available at https://github.com/AntSimi/py-eddy-tracker from version META3.0 onwards. When using the code, please cite "The code used to compute the Mesoscale Eddy Trajectories Atlas from version 3.0 onwards, was developed in collaboration between IMEDEA (E. Mason) and CLS, is freely available under GNU General Public License https://github.com/AntSimi/py-eddy-tracker ". Image of the month, June 2017: Eddies everywhere, https://www.aviso.altimetry.fr/en/news/image-of-the-month/2017/jun-2017-eddies-everywhere.html Références bibliographiques - Pegliasco et al., OSTST 2022: A New Global Mesoscale Eddy Trajectories Atlas Derived from Altimetry : Presentation and Future Evolutions - Pegliasco, C., Delepoulle, A., Mason, E., Morrow, R., Faugère, Y., Dibarboure, G., 2022. META3.1exp: a new global mesoscale eddy trajectory atlas derived from altimetry. Earth Syst. Sci. Data 14, 1087–1107. https://doi.org/10.5194/essd-14-1087-2022 - Mason, E., A. Pascual, and J.C. McWilliams, 2014: A New Sea Surface Height–Based Code for Oceanic Mesoscale Eddy Tracking. J. Atmos. Oceanic Technol., 31, 1181–1188, https://doi.org/10.1175/JTECH-D-14-00019.1
-
Tourbillons détectés en temps différé (Delayed-Time - DT) pour toute la période [1993 - aujourd'hui]. Les variables fournies incluent pour chaque fichier journalier, et pour un type de rotation (Cyclonique/Anticyclonique) : - Position du centre (Longitude et latitude du centre du cercle le mieux ajusté avec le contour de la vitesse géostrophique moyenne circonférentielle maximale) ; - Amplitude (|SSH(local_extremum) - SSH(outermost_contour)|) ; - Rayon de vitesse (Rayon du cercle de meilleur ajustement avec le contour de la vitesse géostrophique moyenne circonférentielle maximale) ; - Vitesse moyenne (Vitesse géostrophique moyenne du contour définissant le rayon de vitesse) ; - Profil de vitesse (profil des valeurs moyennes de vitesse du contour effectif vers l'intérieur jusqu'au plus petit contour intérieur) ; - Contour effectif (Plus grand contour du tourbillon détecté) ; - Contour de vitesse (Contour de la vitesse géostrophique moyenne circonférentielle maximale pour le tourbillon détecté). Notez que les versions "temps différé" diffèrent selon le produit d'entrée utilisé. Les cartes "2-satellites" sont construites en utilisant au maximum deux missions altimétriques, avec les satellites Topex-Poseidon et Jason sur les mêmes traces au sol à long terme, et une seconde mission satellitaire, principalement sur les traces au sol ERS-Envisat-Saral-Sentinel-3A. L'échantillonnage et les échelles représentées étant stables dans le temps, ce jeu de données est considéré comme homogène dans le temps en termes de signaux climatiques et de contenu mésoéchelle. Les données utilisées sont des données quotidiennes "deux satellites" en temps différé version DUACS2021, avec la variable Gridded Global Absolute Dynamic Topographies (ADT), provenant du Copernicus Climate Change Service (C3S) http://climate.copernicus.eu/. Plusieurs autres versions existent : Temps différé "Allsat" et une version en temps réel, décrites sur d'autres fiches de métadonnées. Gamme de produit : produit altimétrique dérivé des produits Ssalto/Duacs, grillé multimissions Contenu : trajectoires des tourbillons détectés dans les données altimétriques Format : NetCDF-4 Classic with CF standards. Statistical analysis document (Figures following Chelton et al. 2011): https://www.aviso.altimetry.fr/fileadmin/documents/data/products/value-added/META3.2_twosat_report.pdf Reading software: examples in Python programming language. Details on Aviso+ Users Newsletter #14, page 4: Tools for the Mesoscale Eddy Trajectory Atlas, https://www.aviso.altimetry.fr/fileadmin/documents/newsstand/Newsletter/aviso_newsletter_14.pdf#page=4 Code delivery: the open source code is available at https://github.com/AntSimi/py-eddy-tracker from version META3.0 onwards. When using the code, please cite "The code used to compute the Mesoscale Eddy Trajectories Atlas from version 3.0 onwards, was developed in collaboration between IMEDEA (E. Mason) and CLS, is freely available under GNU General Public License https://github.com/AntSimi/py-eddy-tracker ". Image of the month, June 2017: Eddies everywhere, https://www.aviso.altimetry.fr/en/news/image-of-the-month/2017/jun-2017-eddies-everywhere.html Références bibliographiques - Pegliasco et al., OSTST 2022: A New Global Mesoscale Eddy Trajectories Atlas Derived from Altimetry : Presentation and Future Evolutions https://ostst.aviso.altimetry.fr/fileadmin/user_upload/OSTST2022/Presentations/SC32022-A_New_Global_Mesoscale_Eddy_Trajectory_Atlas_Derived_from_Altimetry___Presentation_and_Future_Evolutions.pdf - Pegliasco, C., Delepoulle, A., Mason, E., Morrow, R., Faugère, Y., Dibarboure, G., 2022. META3.1exp: a new global mesoscale eddy trajectory atlas derived from altimetry. Earth Syst. Sci. Data 14, 1087–1107. https://doi.org/10.5194/essd-14-1087-2022 - Mason, E., A. Pascual, and J.C. McWilliams, 2014: A New Sea Surface Height–Based Code for Oceanic Mesoscale Eddy Tracking. J. Atmos. Oceanic Technol., 31, 1181–1188, https://doi.org/10.1175/JTECH-D-14-00019.1
-

Multimission altimeter satellite gridded sea surface heights and derived variables computed with respect to a twenty-year mean. Previously distributed by Aviso+, no change in the scientific content. All the missions are homogenized with respect to a reference mission. The acquisition of various altimeter data is a few days at most. The sla is computed with a non-centered computation time window (6 weeks before the date).
-
Eddies detected in Delayed-Time (DT) for the entire period [1993 - present]. Variables provided include day-by-day, and for one rotation type (Cyclonic/Anticyclonic) : - Center position (Longitude and latitude of the center of the best fit circle with the contour of maximum circum-average geostrophic speed); - Amplitude (|SSH(local_extremum) – SSH(outermost_contour)|); - Speed radius (Radius of the best fit circle with the contour of maximum circum-average geostrophic speed); - Speed average (Average geostrophic speed of the contour defining the speed radius); - Speed profile (Profile speed average values from effective contour inwards to smallest inner contour); - Effective contour (Largest contour of the detected eddy); - Speed contour (Contour of maximum circum-average geostrophic speed for the detected eddy).
-
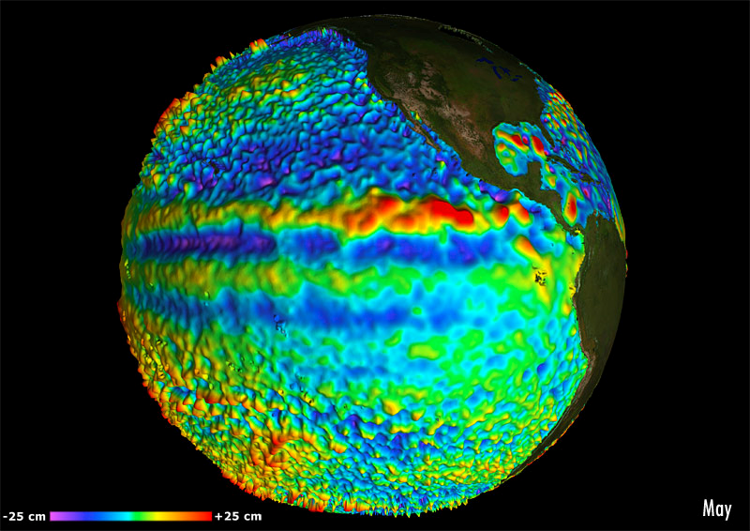
For the Global Ocean - Multimission altimeter satellite gridded sea surface heights and derived variables computed with respect to a twenty-year mean. Previously distributed by Aviso+, no change in the scientific content. All the missions are homogenized with respect to a reference mission which is currently Jason-3. The acquisition of various altimeter data is a few days at most. The sla is computed with a non-centered computation time window (6 weeks before the date).
-
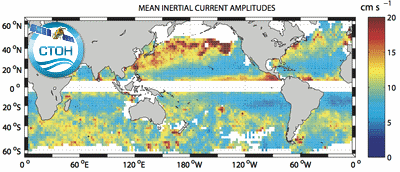
Global climatology of near-inertial current characteristics from satellite-tracked drifters. Data analyzed: 8500 near-surface satellite-tracked drifter trajectories with drogues attached at 15 m depth. Gridded map with annual and seasonnal spans.