 Catalogue PIGMA
Data
Type of resources
Available actions
Topics
Keywords
Contact for the resource
Provided by
Years
Formats
Representation types
Update frequencies
status
Scale
Resolution
-
This is a compilation of OSPAR habitat point data for the northeast Atlantic submitted by OSPAR contracting parties. The compilation is coordinated by the UK's Joint Nature Conservation Committee, working with a representative from each of the OSPAR coastal contracting parties. This public dataset does not contain records relating to sensitive species (e.g. Ostrea edulis) in specific areas, or where data are restricted from public release by the owner's use limitations. This version (v2020) was published in July 2021.
-
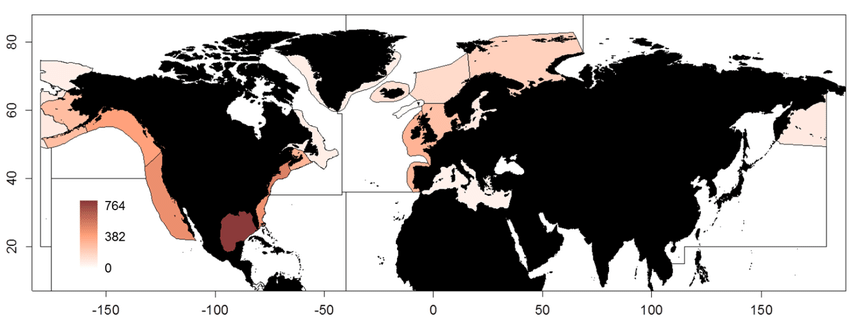
This dataset containing traits of marine fish is based on fish taxa observed during international scientific bottom-trawl surveys regularly conducted in the Northeast Atlantic, Northwest Atlantic and the Northeast Pacific. These scientific surveys target primarily demersal (bottom-dwelling) fish species, but pelagic species are also regularly recorded. The overarching aim of this dataset was to collect information on ecological traits for as many fish taxa as possible and to find area-specific trait values to account for intraspecific variation in traits, especially for widely distributed species. We collected traits for species, genera and families. The majority of trait values were sourced from FishBase (Froese and Pauly, 2019), and have been supplemented with values from the primary literature.
-
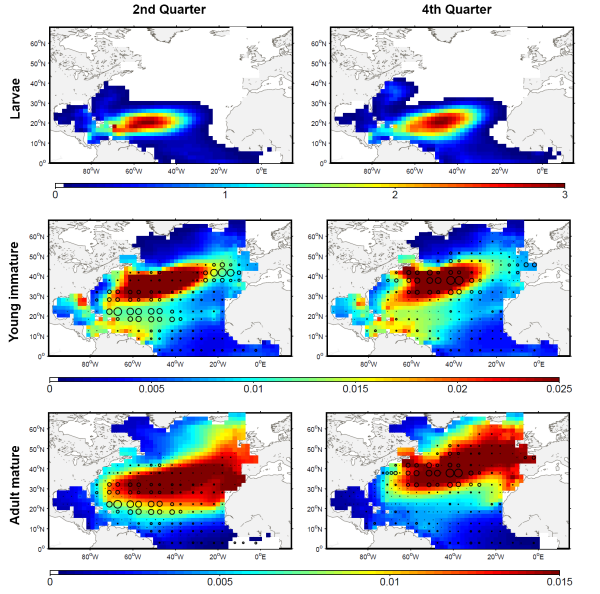
The development of the ecosystem approach and models for the management of ocean marine resources requires easy access to standard validated datasets of historical catch data for the main exploited species. They are used to measure the impact of biomass removal by fisheries and to evaluate the models skills, while the use of standard dataset facilitates models inter-comparison. North Atlantic albacore tuna is exploited all year round by longline and in summer and autumn by surface fisheries and fishery statistics compiled by the International Commission for the Conservation of Atlantic Tunas (ICCAT). Catch and effort with geographical coordinates at monthly spatial resolution of 1° or 5° squares were extracted for this species with a careful definition of fisheries and data screening. In total, thirteen fisheries were defined for the period 1956-2010, with fishing gears longline, troll, mid-water trawl and bait fishing. However, the spatialized catch effort data available in ICCAT database represent a fraction of the entire total catch. Length frequencies of catch were also extracted according to the definition of fisheries above for the period 1956-2010 with a quarterly temporal resolution and spatial resolutions varying from 1°x 1° to 10°x 20°. The resolution used to measure the fish also varies with size-bins of 1, 2 or 5 cm (Fork Length). The screening of data allowed detecting inconsistencies with a relatively large number of samples larger than 150 cm while all studies on the growth of albacore suggest that fish rarely grow up over 130 cm. Therefore, a threshold value of 130 cm has been arbitrarily fixed and all length frequency data above this value removed from the original data set.
-
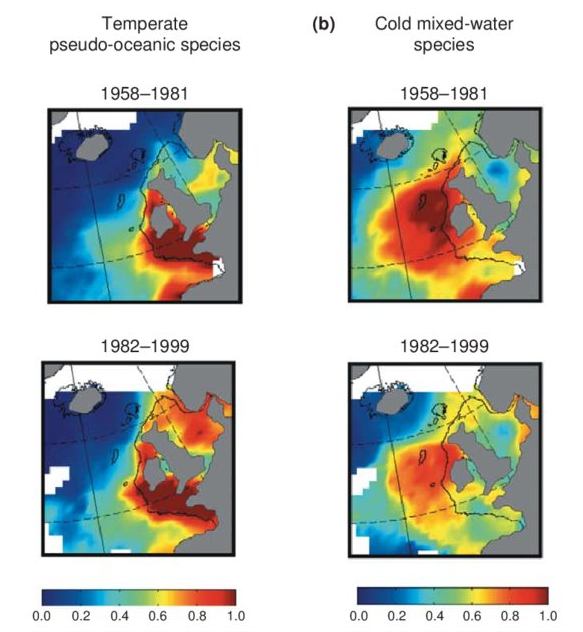
Excel file containing CPR data from Standard Areas B4,C3,C4,D3,D4,D5,E4,F4 for the plankton Calanus finmarchicus and helgolandicus, total traverse (small) copepods, total large copepods, Phytoplankton Colour Index and Cnidaria (presence denoted by a 1, absence by a zero). All taxa are from 1980, except Cnidaria which are from 2011. Dataset is in the format of sample level data, with each row being a discrete sample, with a sample being 3m3 filtered seawater, and 10nm of tow. For each row, a sample has the following information, starting at column a: Standard area of sample, sample id, latitude (decimal degrees) of sample mid point, longitude (decimal degrees) of sample midpoint, sample midpoint date and local time, year of sample, month of sample, then plankton abundance values (or PCI index or cnidaria presence/absence). All taxa have been looked for during the period this dataset spans, so zero values represent true absence.
-

NOAA High-resolution Blended Analysis of Daily SST and Ice. Data is from Sep 1981 and is on a 1/4 deg global grid.
-
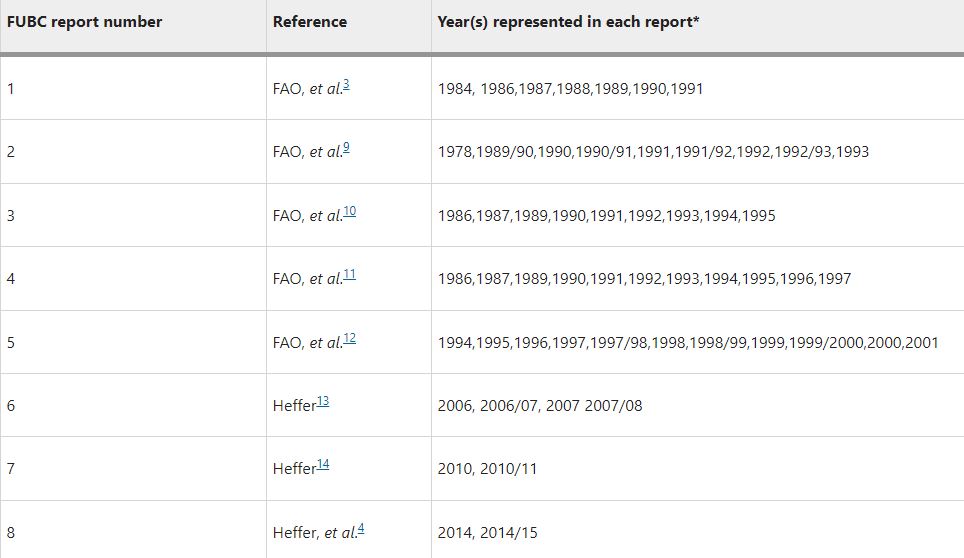
Understanding how much inorganic fertilizer (referred to as fertilizer) is applied to different crops at national, regional and global levels is an essential component of fertilizer consumption analysis and demand projection. Good information on fertilizer use by crop (FUBC) is rarely available because it is difficult to collect and time-consuming to process and validate. To fill this gap, a first global FUBC report was published in 1992 for the 1990/1991 period, based on an expert survey conducted jointly by the Food and Agriculture Organization (FAO) of the UN, the International Fertilizer Development Center (IFDC) and the International Fertilizer Association (IFA). Since then, similar expert surveys have been carried out and published every two to four years in the main fertilizer-consuming countries. Since 2008 IFA has led these efforts and, to our knowledge, remains the only globally available data set on FUBC. This dataset includes data (in CSV format) from a survey carried out by IFA to represent the 2017–18 period as well as a collation of all historic FUBC data.
-

The abundance of ichthyoplankton in samples from dedicated plankton surveys by Cefas with positional and sample data. Surveys took place off the Western Coast of the UK and Ireland between 1986 and 2004. Series of cruises undertaken to contribute to the estimation of the spawning stock biomass of the western mackerel and horse mackerel stocks by plankton survey. The triennial mackerel egg surveys were begun in 1977 to estimate the SSB of the western mackerel stock. Since 1986 the surveys have also been used to estimate the SSB of horse mackerel. Plankton sampling is undertaken to estimate the egg production and trawling is carried out to estimate the mean fecundity of the mature female fish. Various designs of Gulf VII type samplers have been used with various apertures of nosecones and 270 micron nets. Samplers are now standardised to the 53cm version, fitted with 20cm aperture nosecones. Analysis at Cefas involved separating all fish eggs and larvae from samples. Where possible all eggs were identified. Eggs lacking identifiable features were measured. Where >100 eggs were found, sub-sampling was undertaken. Eggs that were unmeasured were apportioned across the size distribution of measured eggs. All mackerel and horse mackerel eggs were staged.
-

MISSION ATLANTIC assesses the whole Atlantic, and ecosystem components at risk from natural hazards and the consequences of human activities, including individual regional Case Studies, and their interconnectivity. To do this, Mission Atlantic develops IEAs for seven regional Case Studies, in sub-Arctic and Tropical regions of the Atlantic Ocean, ranging from shelf seas to the mid-Atlantic Ridge: 1) Norwegian Sea 2) Celtic Sea 3) Canary Current 4) North Mid Atlantic Ridge 5) South Mid Atlantic Ridge 6) Benguela Current 7) South Brazilian Shelf
-
The Surface Ocean CO₂ Atlas (SOCAT) is a synthesis activity for quality-controlled, surface ocean fCO₂ (fugacity of carbon dioxide) observations by the international marine carbon research community (>100 contributors). SOCAT data is publicly available, discoverable and citable. SOCAT enables quantification of the ocean carbon sink and ocean acidification and evaluation of ocean biogeochemical models. SOCAT, which celebrated its 10th anniversary in 2017, represents a milestone in biogeochemical and climate research and in informing policy. SOCAT data are released in versions. Each succeeding version contains new data sets as well as updates of older ones. The first version of SOCAT was released in 2011, the second and third version followed biennially. Automation allowed annual public releases since version 4. The latest SOCAT version (version 2022) has 35.6 million observations from 1957 to 2022 for the global oceans and coastal seas. 7.2 million calibrated sensor observations are also available. SOCAT version 2023 was released on the 20th of June 2023, containing data submitted on or before 15th of January 2023. New data submissions are welcome at any time, and will be included in the next SOCAT release. The submission deadline for v2024 is 15 January 2024. SOCAT is a core Global Ocean Observing System data product for biogeochemistry endorsed by the Global Ocean Observing System GOOS.
-
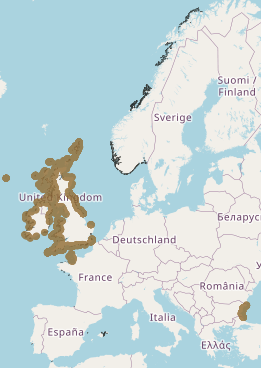
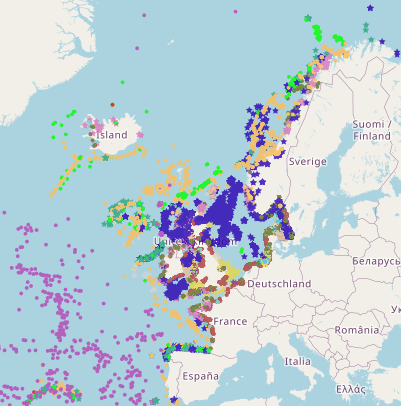
This layer shows the current known extent and distribution of macroalgal canopy in European waters, collated by EMODnet Seabed Habitats. The polygons portion was last updated in 2019. The points were added in Sept 2021. The purpose was to produce a data product that would provide the best compilation of evidence for the essential ocean variable (EOV) known as Macroalgal canopy cover and composition (sub-variable: Areal extent), as defined by the Global Ocean Observing System (GOOS). Kelp and fucoid brown algae are the dominant species that comprise macroalgal forests. This data product should be considered a work in progress and is not an official product.