 Catalogue PIGMA
Iceland
Type of resources
Available actions
Topics
Keywords
Contact for the resource
Provided by
Years
Formats
Representation types
Update frequencies
status
Scale
Resolution
-
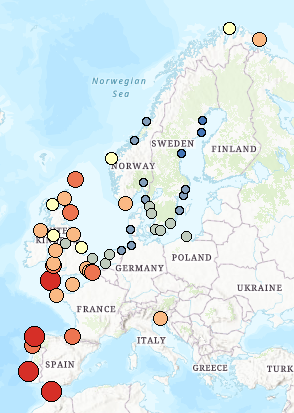
This dataset presents the estimated multiplication factor by which the frequency of flooding events of a given height in European tide gauges will change between 2010 and 2100, due to projected regional sea relative level rise under the Representative Concentration Pathways (RCP) 4.5 scenario. Values larger than 1 indicate an increase in flooding frequency. This dataset is derived from the Figure 13.25(b) of the Working Group I contribution to the IPCC Fifth Assessment Report (http://www.climatechange2013.org/images/report/WG1AR5_ALL_FINAL.pdf). This dataset also contributes to an earlier version of the EEA Indicator "Global and European sea-level": https://www.eea.europa.eu/data-and-maps/indicators/sea-level-rise-5/assessment.
-
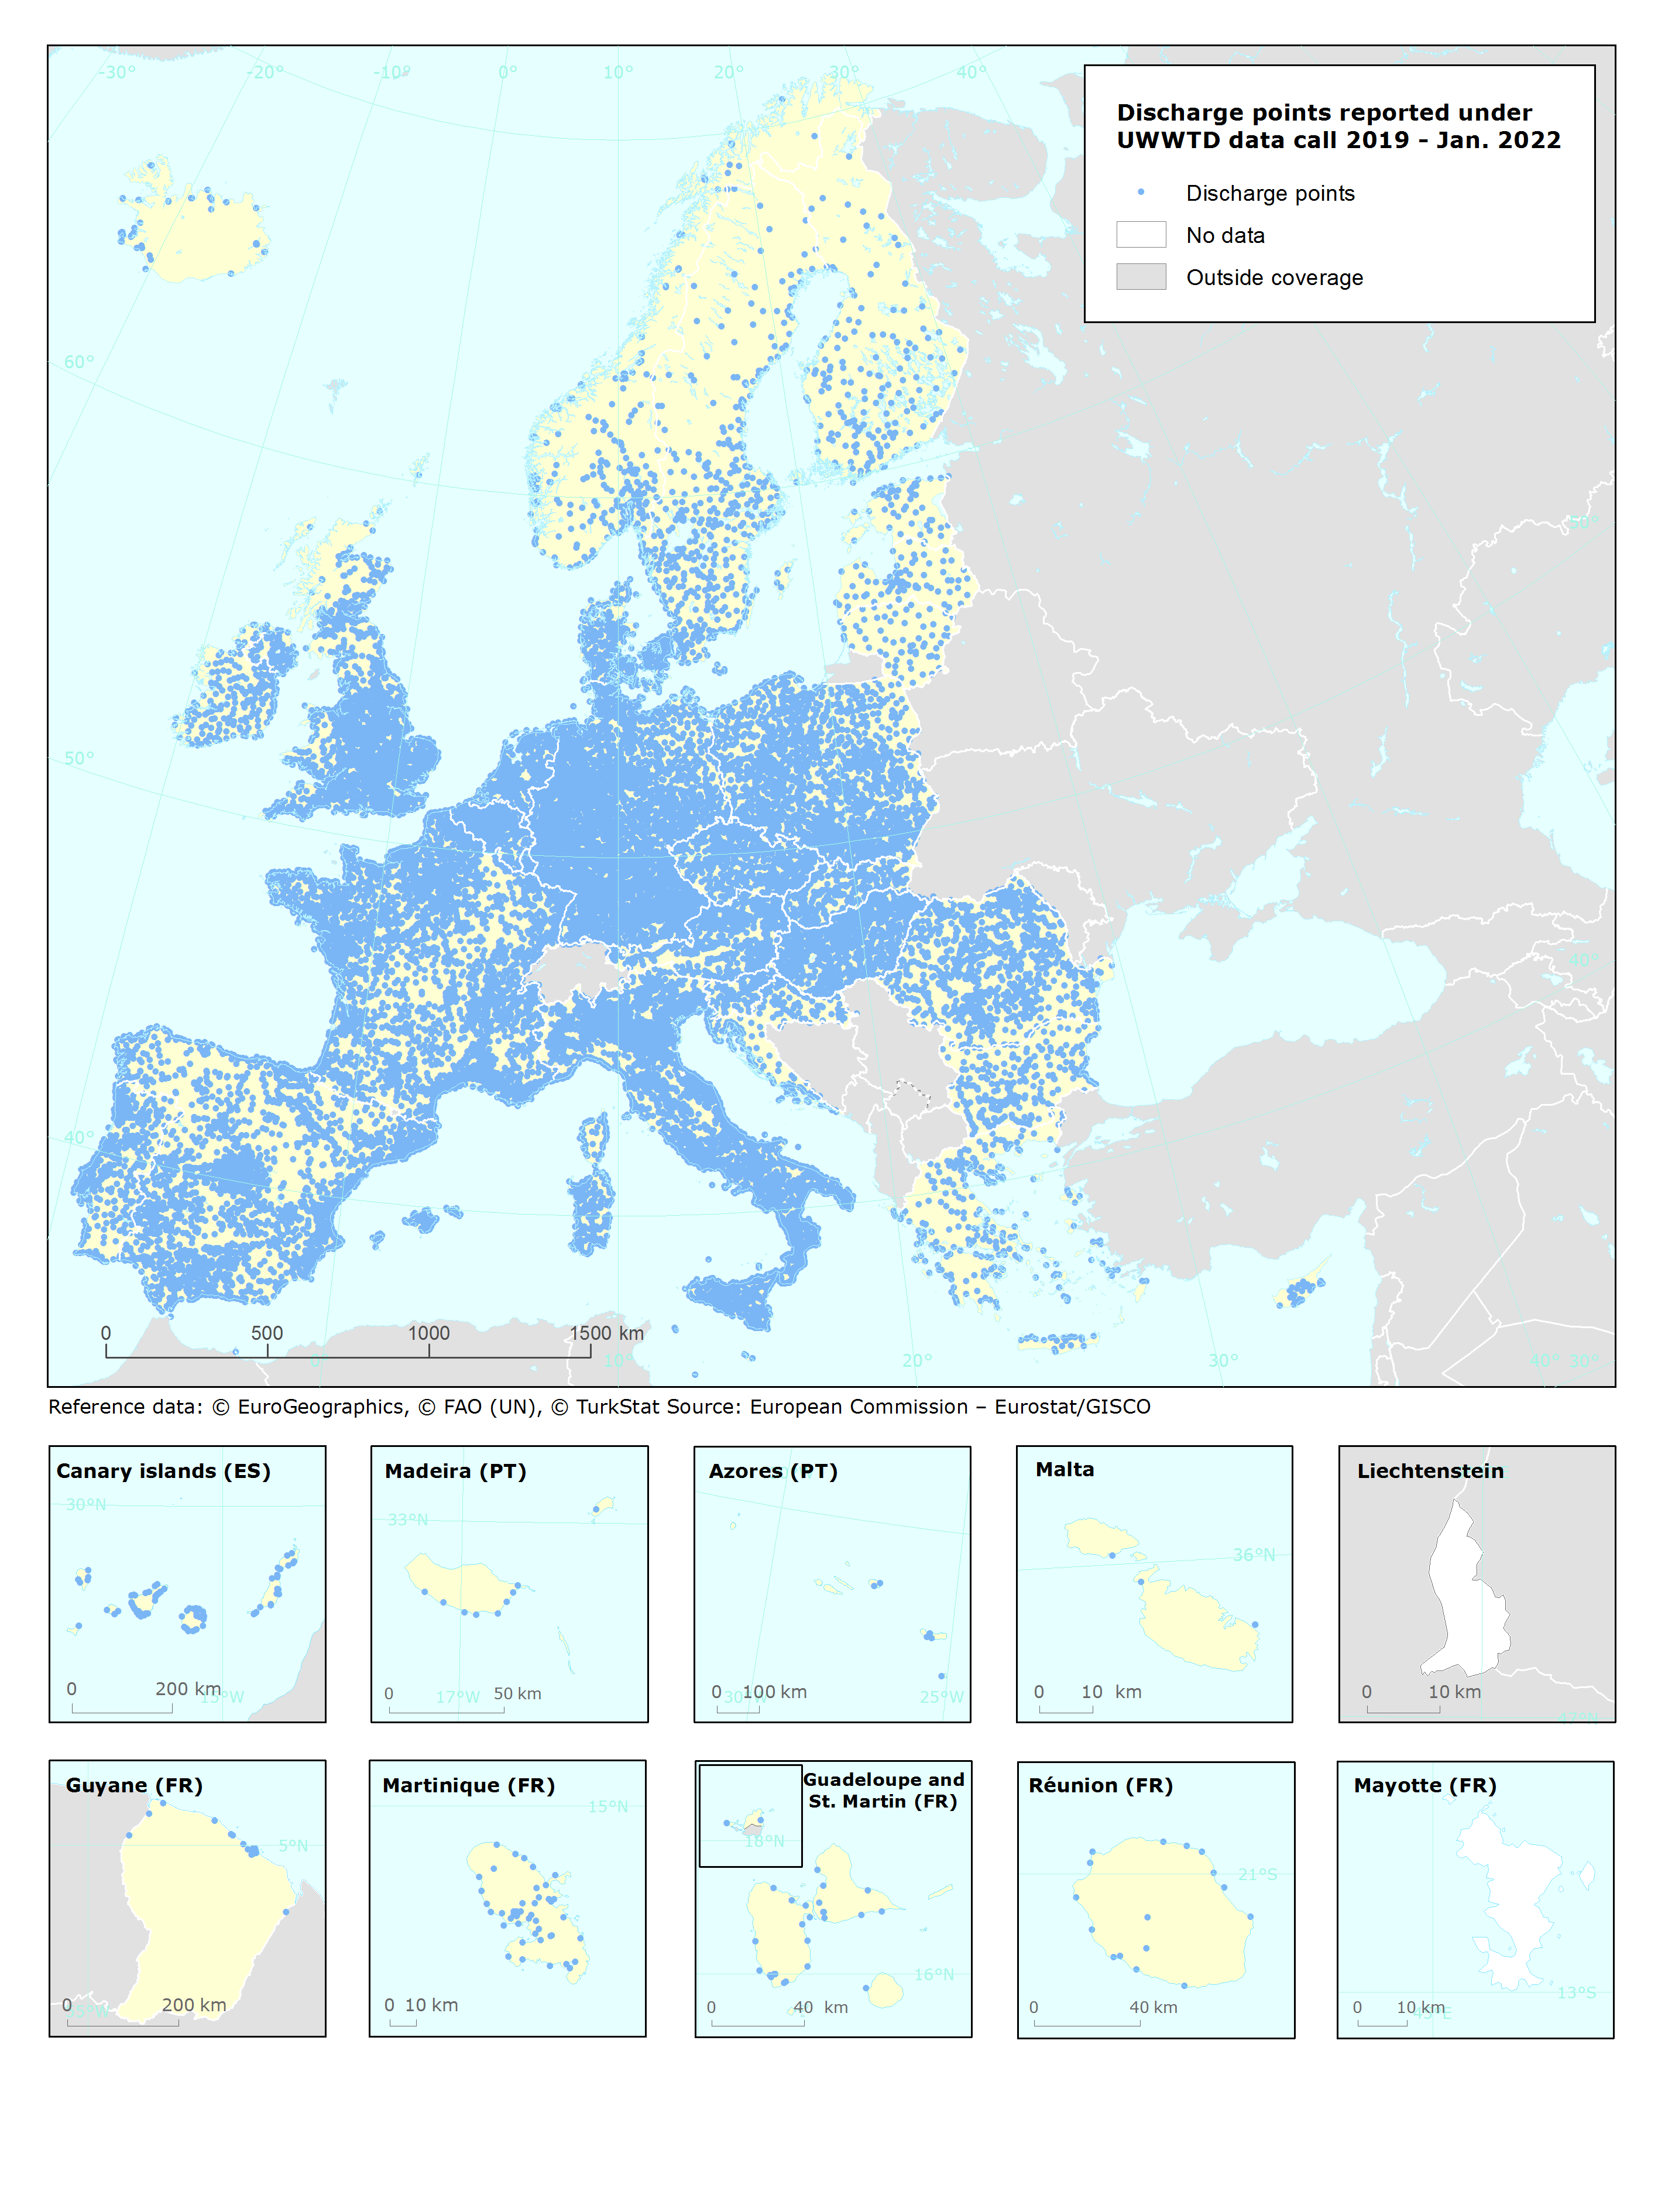
UWWTD Discharge Points, Jan. 2022 is one of the datasets produced within the frame of the reporting under 11th UWWTD Art.15 reporting period (UWWTD data call 2019). The Urban Waste Water Treatment Directive (UWWTD) (91/271/EEC) obliges Member States to report data on the implementation of the Directive upon request from the European Commission bi-annually. Reported data include receiving areas as designated under UWWTD, agglomerations, urban waste water treatment plants serving the agglomerations and points of discharges. Dataset UWWTD_DischargePoints contains information on individual points of discharge from urban waste water treatment plants or collecting systems, including their coordinates of discharge, link to specific treatment plant, type of receiving area into which the effluent / wastewater is discharged, related waterbody (or river basin), information on the discharge on land and potential reuse of the treated waste water. This dataset includes the reported discharge points which are displayed on the UWWTD maps (https://www.eea.europa.eu/themes/water/european-waters/water-use-and-environmental-pressures/uwwtd/interactive-maps/urban-waste-water-treatment-maps-3). The active discharge points with correct coordinates in the reported data were selected from the source European UWWTD tabular dataset, which is available on the download link https://www.eea.europa.eu/data-and-maps/data/waterbase-uwwtd-urban-waste-water-treatment-directive-7. The definition of the UWWTD Discharge Points dataset attributes (fields) is available on the link https://dd.eionet.europa.eu/datasets/latest/UWWTDArt15/tables/DischargePoints The full (internal) dataset including inactive discharge points is available under "Urban Waste Water Treatment Directive, Discharge points reported under UWWTD data call 2019 - INTERNAL VERSION, Jan. 2022". In comparison to the previous version (Nov. 2020), late redeliveries and corrections provided by several countries during 2021 are included in current revision. Next, the dataset is provided in GeoPackage and ESRI File geodatabase formats instead of shapefile used up to now, to avoid truncation of attribute names.
-
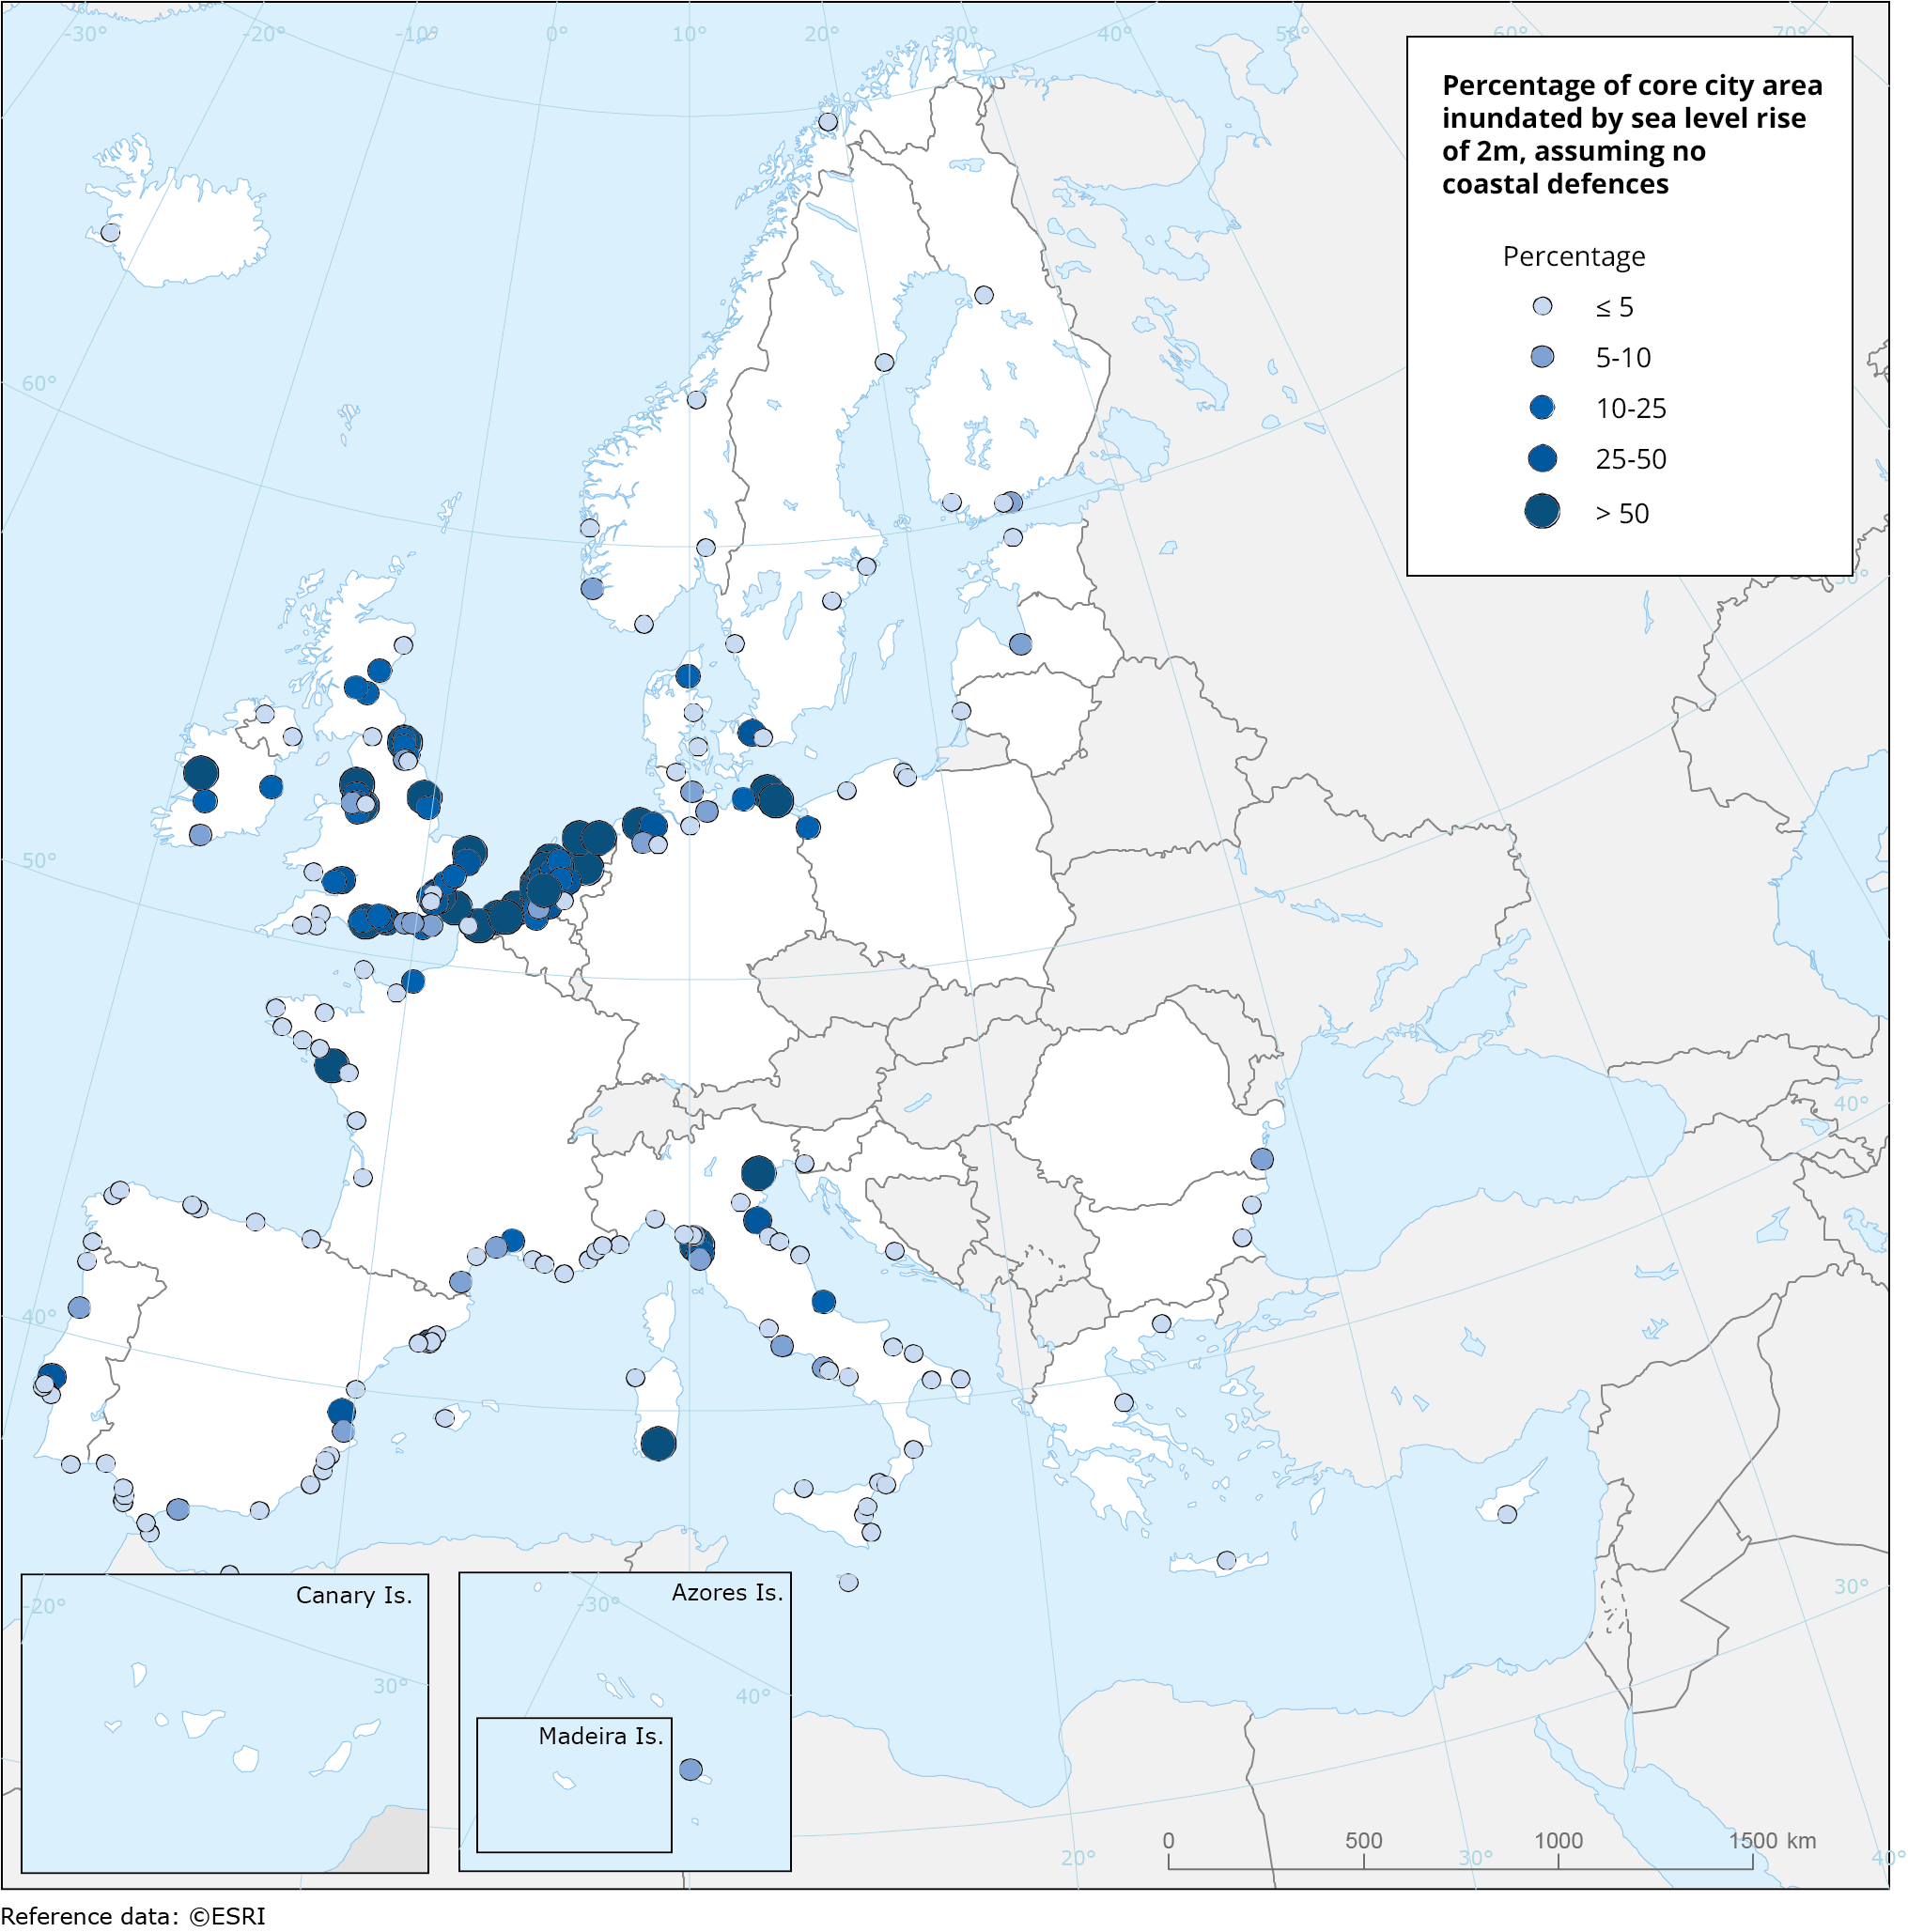
This metadata refers to a dataset that shows the percentage of cities' administrative area (core city based on the Urban Morphological Zones dataset) inundated by the sea level rise of 2 metres, without any coastal flooding defences present for a series of individual coastal European cities (included in Urban Audit). The dataset has been computed using the CReSIS (Centre for Remote Sensing of Ice Sheets) dataset for 2018.
-

The dataset shows the percentage of cities' administrative area (core city based on the Urban Morphological Zones dataset) inundated by the sea level rise of 1 metre, without any coastal flooding defences present for a series of individual coastal European cities (included in Urban Audit). The dataset has been computed using the CReSIS (Centre for Remote Sensing of Ice Sheets) dataset for 2018.