 Catalogue PIGMA
Modelling data
Type of resources
Available actions
Topics
Keywords
Contact for the resource
Provided by
Years
Formats
Representation types
Update frequencies
status
Resolution
-

NASA's OceanColor Web is supported by the Ocean Biology Processing Group (OBPG) at NASA's Goddard Space Flight Center. Our responsibilities include the collection, processing, calibration, validation, archive and distribution of ocean-related products from a large number of operational, satellite-based remote-sensing missions providing ocean color, sea surface temperature and sea surface salinity data to the international research community since 1996. As a Distributed Active Archive Center (DAAC), known as the Ocean Biology DAAC (OB.DAAC), we are responsible for the archive and distribution of satellite ocean biology data produced or collected under NASA EOSDIS, including those from historical missions and partner space organizations.
-
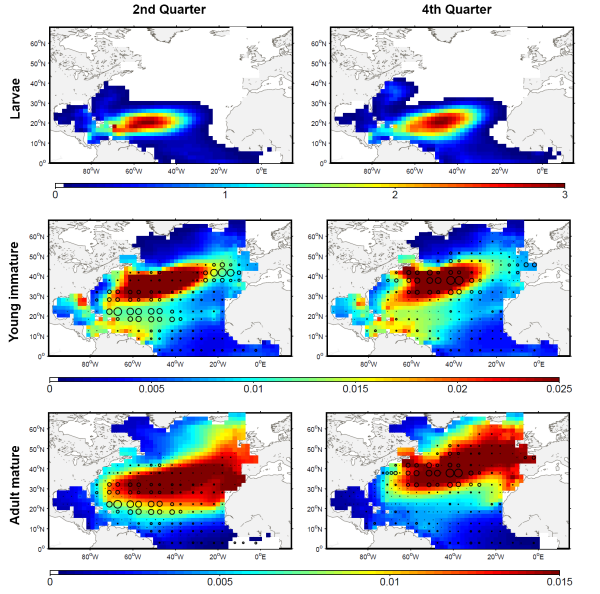
The development of the ecosystem approach and models for the management of ocean marine resources requires easy access to standard validated datasets of historical catch data for the main exploited species. They are used to measure the impact of biomass removal by fisheries and to evaluate the models skills, while the use of standard dataset facilitates models inter-comparison. North Atlantic albacore tuna is exploited all year round by longline and in summer and autumn by surface fisheries and fishery statistics compiled by the International Commission for the Conservation of Atlantic Tunas (ICCAT). Catch and effort with geographical coordinates at monthly spatial resolution of 1° or 5° squares were extracted for this species with a careful definition of fisheries and data screening. In total, thirteen fisheries were defined for the period 1956-2010, with fishing gears longline, troll, mid-water trawl and bait fishing. However, the spatialized catch effort data available in ICCAT database represent a fraction of the entire total catch. Length frequencies of catch were also extracted according to the definition of fisheries above for the period 1956-2010 with a quarterly temporal resolution and spatial resolutions varying from 1°x 1° to 10°x 20°. The resolution used to measure the fish also varies with size-bins of 1, 2 or 5 cm (Fork Length). The screening of data allowed detecting inconsistencies with a relatively large number of samples larger than 150 cm while all studies on the growth of albacore suggest that fish rarely grow up over 130 cm. Therefore, a threshold value of 130 cm has been arbitrarily fixed and all length frequency data above this value removed from the original data set.
-

NOAA High-resolution Blended Analysis of Daily SST and Ice. Data is from Sep 1981 and is on a 1/4 deg global grid.
-
The Task Force on Hemispheric Transport of Air Pollution (TF HTAP) is an international scientific cooperative effort to improve the understanding of the intercontinental transport of air pollution across the Northern Hemisphere. TF HTAP was organized in 2005 under the auspices of the UNECE Convention on Long-range Transboundary Air Pollution (LRTAP Convention) and reports to the Convention’s EMEP Steering Body. However, participation is open to all interested experts, both inside and outside the UNECE region. TF HTAP organizes scientific cooperation in the areas of emissions inventories and projections, analysis of ambient monitoring and remote sensing, global and regional modeling, and impact assessment to understand the intercontinental flows of ozone and its precursors, fine particles and their components, mercury, and persistent organic pollutants (POPs). The main questions of interest to the TF HTAP relate to the benefits of international cooperation to decrease air pollution emissions: - How do air pollution concentrations (or deposition) in one region of the world change as emissions change in other regions or the world? - How do changes in emissions outside a region affect the health, ecosystem, and climate impacts of air pollution within a given region? - How does the feasibility of further emissions control differ in different regions of the world?
-
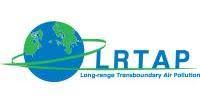
The gyre index constructed here from satellite altimetry is related to core aspects of the North Atlantic subpolar gyre, meridional overturning circulation, hydrographic properties in the Atlantic inflows toward the Arctic, and in marine ecosystems in the northeast Atlantic Ocean. The data series spans the period January 1993 to September 2018. Data description: Monthly gyre index from January 1993 until September 2018. The data is provided in one comma separated value (csv) file with the following entries on each row: year, month, index value. The index is normalized, i.e. it has a zero mean and unit standard deviation. Positive (negative) gyre index reflects stronger (weaker) than average surface circulation of the North Atlantic subpolar gyre.
-
NASA's Physical Oceanography Distributed Active Archive Center (PO.DAAC) is located at NASA's Jet Propulsion Laboratory in Pasadena, California. PO.DAAC manages and provides tools and services for NASA's oceanographic and hydrologic data (satellite, airborne, and in-situ) to enable a greater understanding of the physical processes and conditions of the global ocean. Measurements include gravity, ocean winds, sea surface temperature, ocean surface topography, sea surface salinity, and circulation. The data support a wide range of applications including climate research, weather prediction, resource management, policy, and the stewardship of ocean data resources.
-

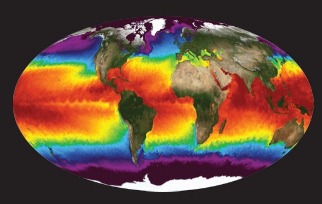
We assembled a dataset of 14C-based productivity measurements to understand the critical variables required for accurate assessment of daily depth-integrated phytoplankton carbon fixation (PP(PPeu)u) from measurements of sea surface pigment concentrations (Csat)(Csat). From this dataset, we developed a light-dependent, depth-resolved model for carbon fixation (VGPM) that partitions environmental factors affecting primary production into those that influence the relative vertical distribution of primary production (Pz)z) and those that control the optimal assimilation efficiency of the productivity profile (P(PBopt). The VGPM accounted for 79% of the observed variability in Pz and 86% of the variability in PPeu by using measured values of PBopt. Our results indicate that the accuracy of productivity algorithms in estimating PPeu is dependent primarily upon the ability to accurately represent variability in Pbopt. We developed a temperature-dependent Pbopt model that was used in conjunction with monthly climatological images of Csat sea surface temperature, and cloud-corrected estimates of surface irradiance to calculate a global annual phytoplankton carbon fixation (PPannu) rate of 43.5 Pg C yr‒1. The geographical distribution of PPannu was distinctly different than results from previous models. Our results illustrate the importance of focusing Pbopt model development on temporal and spatial, rather than the vertical, variability.
-
The principal component (PC)-based indices of the North Atlantic Oscillation (NAO) are the time series of the leading Empirical Orthogonal Function (EOF) of SLP anomalies over the Atlantic sector, 20°-80°N, 90°W-40°E. These indices are used to measure the NAO throughout the year, tracking the seasonal movements of the Icelandic low and Azores high. These movements are illustrated in the Figures on this page. Positive values of the NAO index are typically associated with stronger-than-average westerlies over the middle latitudes, more intense weather systems over the North Atlantic and wetter/milder weather over western Europe.
-
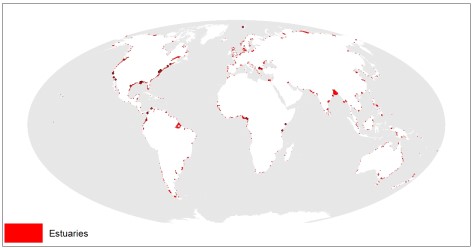
This dataset shows the global distribution of over 1,300 estuaries, including some lagoon systems and fjords. The majority of estuaries are represented by polygons, except for 44 records for which points are available. This dataset was developed by Sea Around Us (www.seaaroundus.org).
-
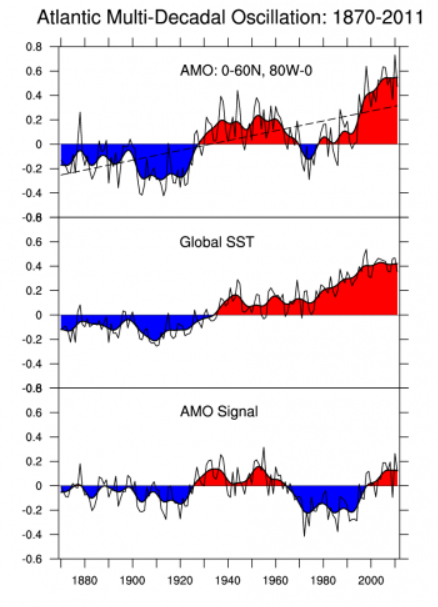
The Atlantic Multi-decadal Oscillation (AMO) has been identified as a coherent mode of natural variability occurring in the North Atlantic Ocean with an estimated period of 60-80 years. It is based upon the average anomalies of sea surface temperatures (SST) in the North Atlantic basin, typically over 0-80N. To remove the climate change signal from the AMO index, users typically detrend the SST data at each gridpoint or detrend the spatially averaged time series. Trenberth and Shea (2006) recommend that the detrending be done by subtracting the global-mean SST anomaly time series from the spatially averaged time series. See the Expert Guidance by Dr. Kevin Trenberth for the rationale for the global-mean detrending approach. The Expert Guidance by Dr. Rong Zhang discusses the impacts and mechanisms of the AMO.