Salinity of the water column
Type of resources
Available actions
Topics
Keywords
Contact for the resource
Provided by
Years
Formats
Representation types
Update frequencies
status
Scale
Resolution
-

COSYNA provides near real-time data from integrated observations and model results. The observations comprise a variety of in situ techniques (e.g. FerryBox, Gliders, Cabled Underwater Observatories) as well as remote sensing from shore by radar and from space by satellite. Key physical, sedimentary, geochemical and biological parameters are observed at high temporal resolution in the water column and the upper and lower boundary layers. COSYNA’s modelling part consists of nested models with different grid sizes for hydrography (salinity, waves, currents), for suspended matter and for biogeochemical and ecosystem processes. Sophisticated data assimilation procedures, i.e. continuous corrections of the models by observations, improve the reliability of now-casts and short-term forecasts. All data and plots are generally available for download through the data portal (http://codm.hzg.de/codm/). FerryBox data can be directly accessed via the data portal ferrydata.hzg.de where different vizualizaton tools are available (e.g. single transect, pool data along a certain transect for a longer time period or time-series at certain locations). Furthermore, all datasets can be exported in ASCII (tab separated tables) or NetCDF format and downloaded. COSYNA’s motivation is bridging the gap between operational oceanography and the various users of forecasts of the marine state. For further outreach to stakeholders and the wider community an app has been developed for the most common platforms.
-
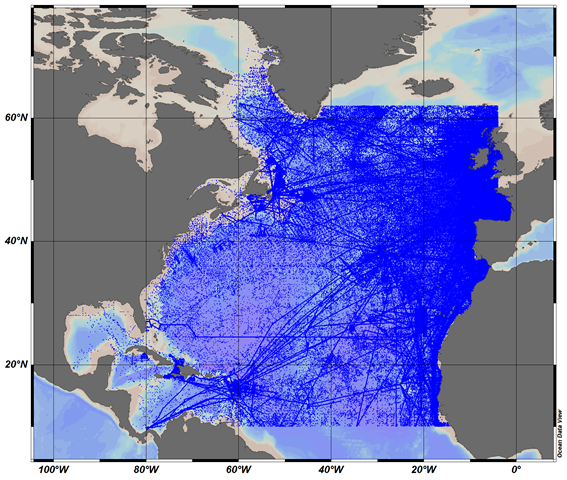
The SeaDataCloud TS historical data collection v1 for the North Atlantic Ocean, includes open access in situ data on temperature and salinity of water column in the North Atlantic Ocean from 10°N to 62°N, including the Labrador Sea, The data were retrieved from the SeaDataNet infrastructure at the end of November 2017. The dataset format is Ocean Data View (ODV - http://odv.awi.de/) binary collection. The quality control of the data has been performed with the help of ODV software. Data Quality Flags have been revised and set up using the elaborated by SeaDataNet2 project QC procedures in conjunction with the visual expert check. The final number of the Temperature and Salinity profiles (stations) in the collection is 9091773. For data access please register at http://www.marine-id.org/.
-

SYKE Alg@line project in the Baltic Sea monitors the state of the sea and detects algal blooms. Several millions of data points are collected annually from the Baltic Sea, using a fleet of 5-7 ferries. Two best equipped ferries offered in TNA are m/s Silja Serenade, which travels daily between Helsinki and Stockholm (Sweden) and m/s Finnmaid, which travels approx. twice a week from Helsinki to Travemünde (Germany) and back. Both ferries are equipped with flow-through system with thermosalinograph, chlorohyll, phycocyanin and CDOM fluorometers, turbiditymeter and refrigerated sampling unit providing discrete water samples for laboratory analyses (e.g. microscopy, flowCAM, nutrients, optical analysis, experimental work). Additional sensors e.g. for primary production (FRRF) and light reflectance are used periodically, new sensors for light absorption and pCO2 will be soon implemented. Data can be retrieved in real time using satellite or GSM connection (basic sensors) or downloaded during harbour visits (additional sensors). Alg@line data is available e.g. through MyOcean and has also been delivered to users based on mutual cooperation, including scientific advice. Algaline ships maintained by SYKE host measurement systems from other countries, and periodically they are used as platforms for international short-term studies.
-

Data access will be provided in near real time and in delayed mode. Parameters include salinity, temperature, chlorophyll fluorescence, turbidity, oxygen, pH, pCO2, wave height and direction, current speed and direction and also in air data on temperature, irradiation and air pressure. Also data from laboratory analyses of water samples are included, e.g. chlorophyll, salinity, CDOM, coloured dissolved organic matter, phytoplankton abundance and biodiversity. Data is distributed through the Baltic Operational Oceanographic System, BOOS and through the Swedish Oceanographic Data Centre at SMHI. Data is accessible through download and through web services. Data and metadata is delivered through SMHI systems for distributing oceanographic data, e.g. http://sharkdata.smhi.se according to EU standards and procedures.
-
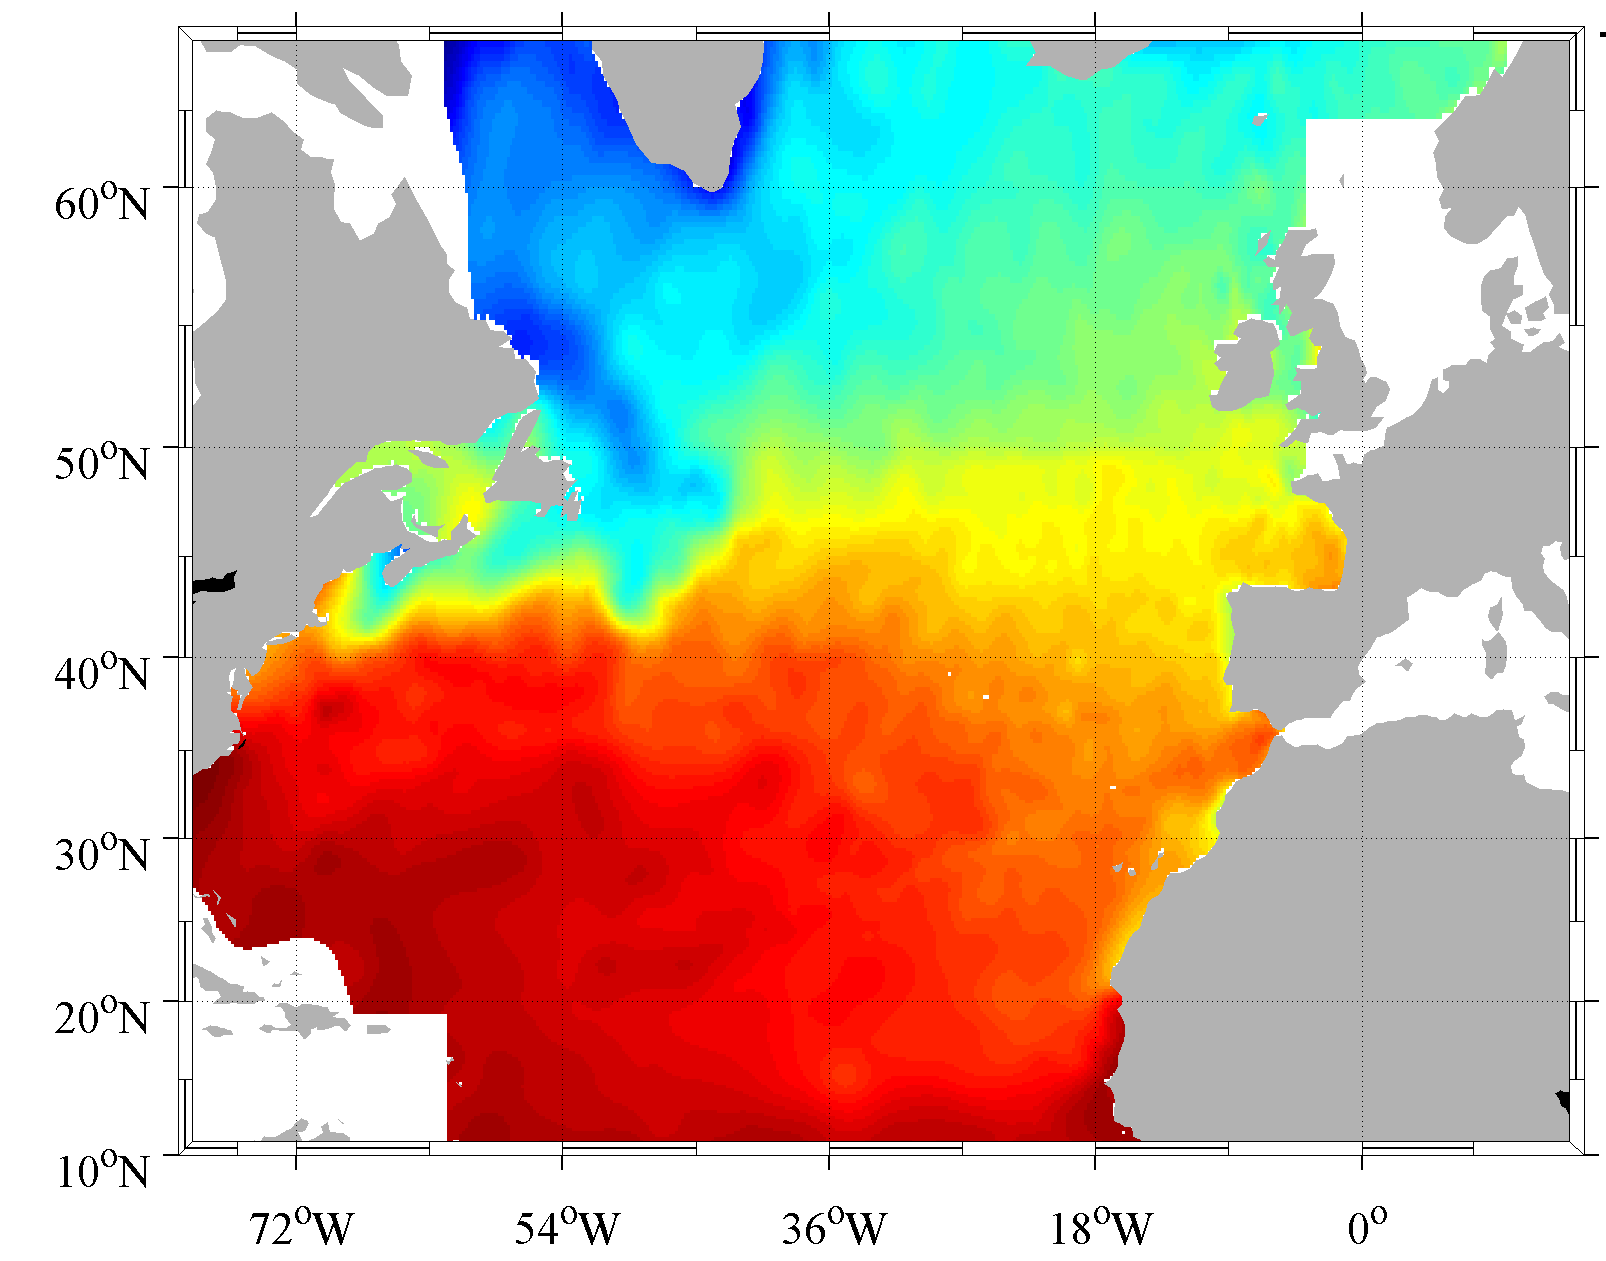
Climatology done from the SeaDataNet aggregated dataset v1.1 for the North Atlantic Ocean. The version used for the DIVA software is the 4.6.9. The period covers 1900-2013. For data access please register at http://www.marine-id.org
-

SYKE Alg@line project in the Baltic Sea monitors the state of the sea and detects algal blooms. Several millions of data points are collected annually from the Baltic Sea, using a fleet of 5-7 ferries. Two best equipped ferries offered in TNA are m/s Silja Serenade, which travels daily between Helsinki and Stockholm (Sweden) and m/s Finnmaid, which travels approx. twice a week from Helsinki to Travemünde (Germany) and back. Both ferries are equipped with flow-through system with thermosalinograph, chlorohyll, phycocyanin and CDOM fluorometers, turbiditymeter and refrigerated.sampling unit providing discrete water samples for laboratory analyses (e.g. microscopy, flowCAM, nutrients, optical analysis, experimental work). Additional sensors e.g. for primary production (FRRF) and light reflectance are used periodically, new sensors for light absorption and pCO2 will be soon implemented. Data can be retrieved in real time using satellite or GSM connection (basic sensors) or downloaded during harbour visits (additional sensors). Alg@line data is available e.g. through MyOcean and has also been delivered to users based on mutual cooperation, including scientific advice. Algaline ships maintained by SYKE host measurement systems from other countries, and periodically they are used as platforms for international short-term studies.
-
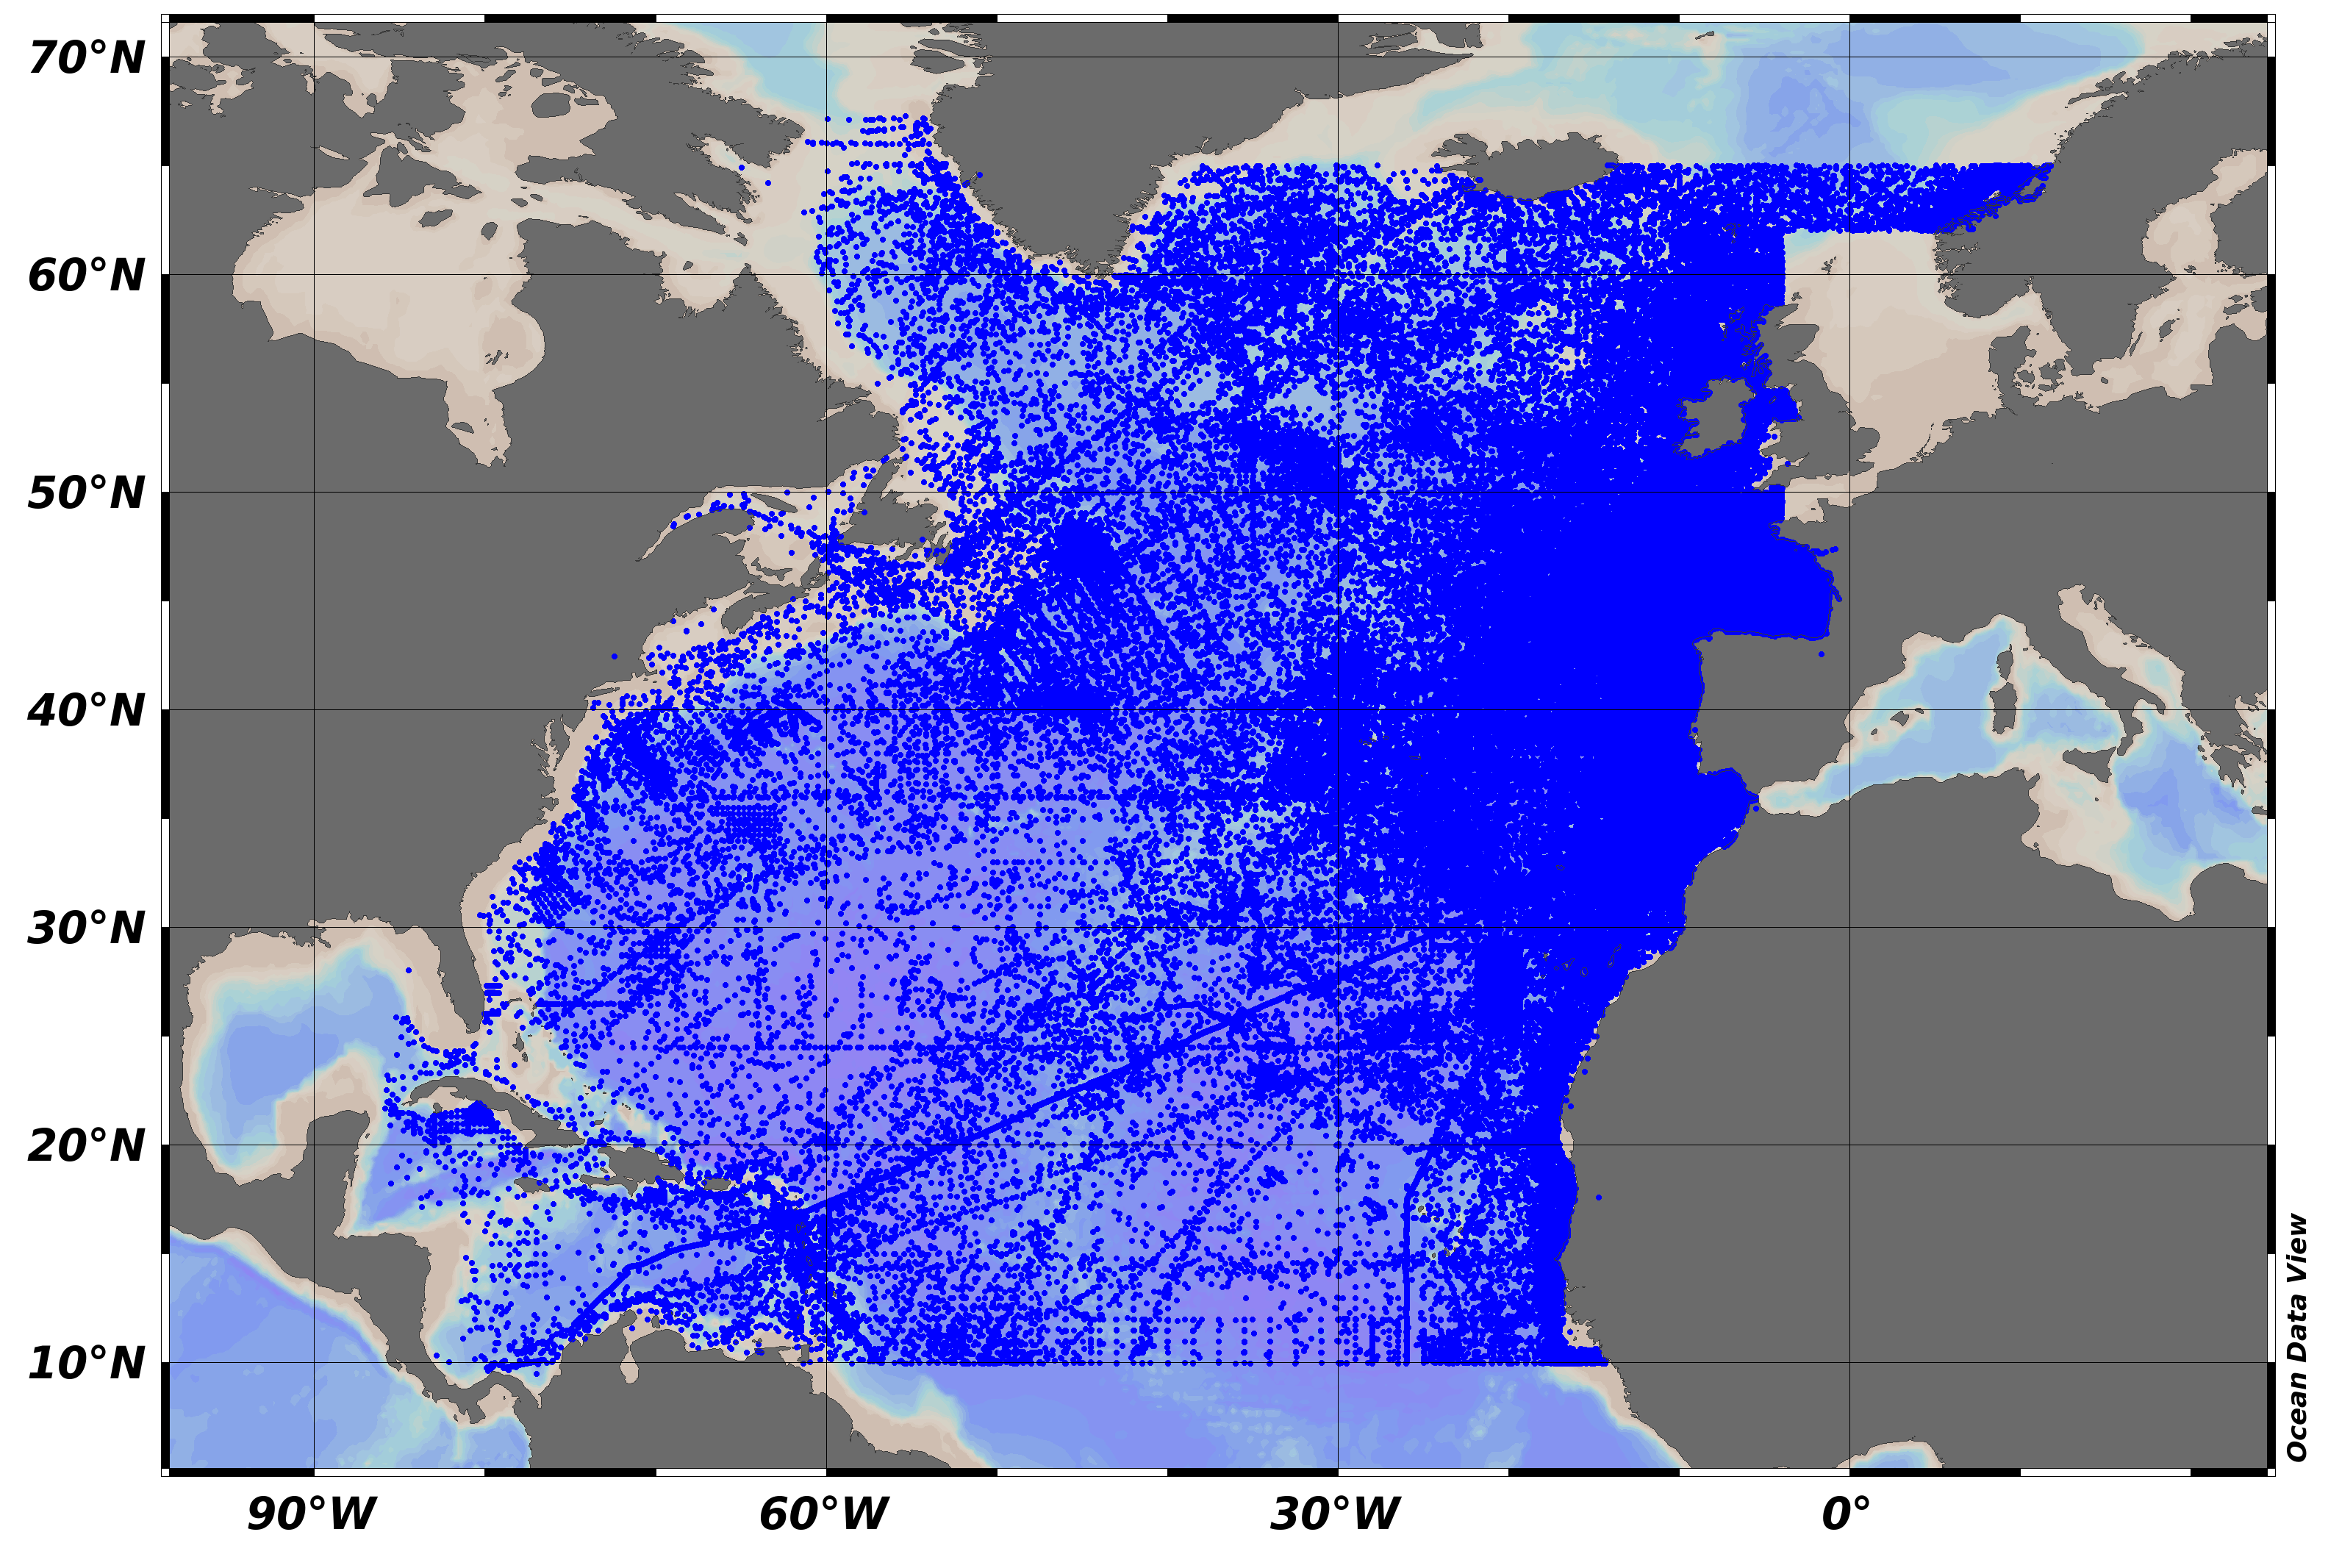
SeaDataNet Temperature and Salinity historical data collection, including revised quality flags after quality control with ODV. For data access please register at http://www.marine-id.org The dataset format is ODV binary collections. You can read, analyse and export from the ODV application provided by Alfred Wegener institute at http://odv.awi.de/
-
SeaDataNet Temperature and Salinity historical data collection v2, including revised quality flags after quality control with ODV. For data access please register at http://www.marine-id.org
-
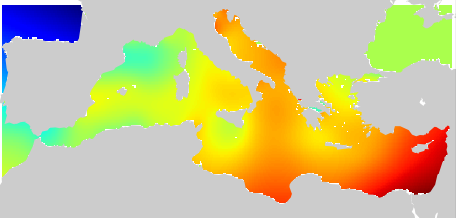
Mediterranean Sea Climatology computed from the SeaDataNet V1.1 aggregated dataset . The version used for the DIVA software is the 4.6.9. The period covers 1900-2013. For data access please register at http://www.marine-id.org
-
POSEIDON is an operational marine monitoring, forecasting and information system for the Greek Seas. The observing component is a distributed infrastructure made by three coastal buoys (Saronikos buoy-SB, Heraklion Coastal Buoy-HCB and Athos buoy-AB) and one Ferrybox (PFB). A calibration laboratory) is supporting the observing activities. The Ferrybox is installed on board H/S/F “Knossos Palace” and is equipped with sensors measuring T, C/S, DO, pH, fluorescence and turbidity. It is the only Ferry Box in the Mediterranean operating daily along the route Heraklion – Piraeus.
 Catalogue PIGMA