 Catalogue PIGMA
climate
Type of resources
Available actions
Topics
Keywords
Contact for the resource
Provided by
Years
Formats
Representation types
Update frequencies
status
Scale
Resolution
-
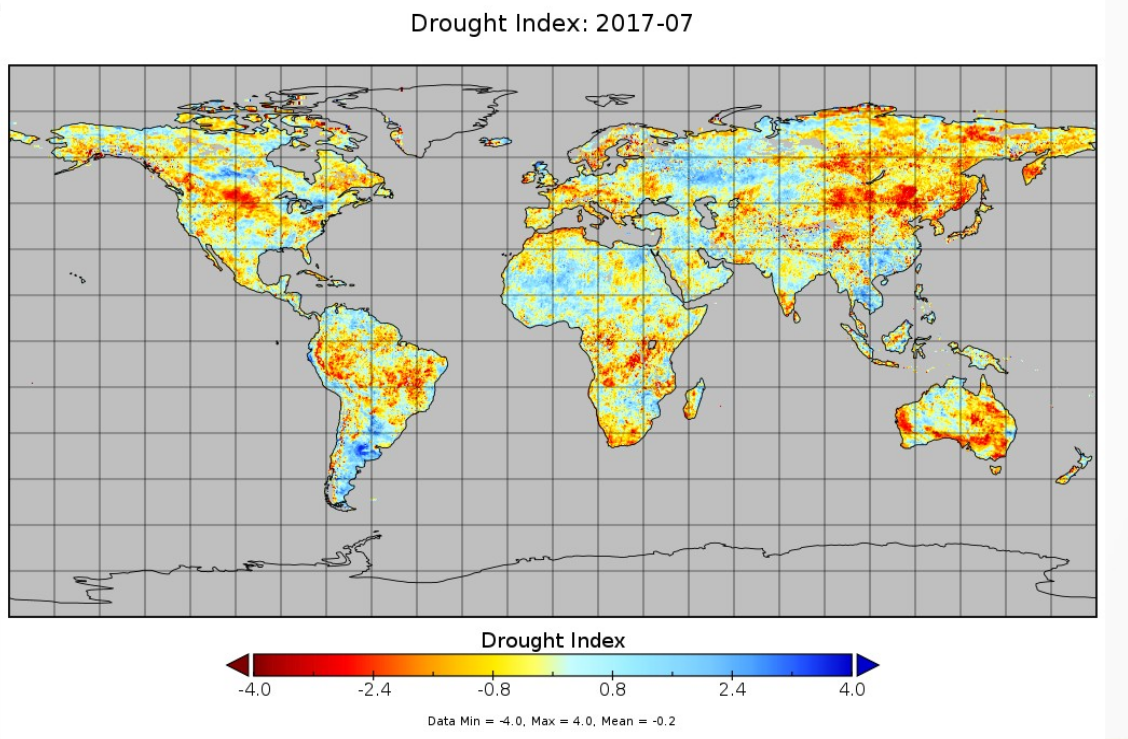
The drought index (DI) is computed using SMOS derived root zone soil moisture (RZSM) monthly fields. The concept is to consider 13 years of SMOS data (2010-2022). The RZSM monthly mean and max over the period is iused to compute a soil water deficit to remove seasonal variability. from teh soil water deficit a soil moisture drought index is computed .The range of values for SMDI lies between -4 to +4, with -4 representing extreme dry conditions and +4 representing extreme wet conditions.
-

Global mean sea level is an integral of changes occurring in the climate system in response to unforced climate variability as well as natural and anthropogenic forcing factors. Its temporal evolution allows detecting changes (e.g., acceleration) in one or more components. Study of the sea level budget provides constraints on missing or poorly known contributions, such as the unsurveyed deep ocean or the still uncertain land water component. In the context of the World Climate Research Programme Grand Challenge entitled “Regional Sea Level and Coastal Impacts”, an international effort involving the sea level community worldwide has been recently initiated with the objective of assessing the various data sets used to estimate components of the sea level budget during the altimetry era (1993 to present). These data sets are based on the combination of a broad range of space-based and in situ observations, model estimates and algorithms. Evaluating their quality, quantifying uncertainties and identifying sources of discrepancies between component estimates is extremely useful for various applications in climate research. This effort involves several tens of scientists from about sixty research teams/institutions worldwide (www.wcrp-climate.org/grand-challenges/gc-sea-level). The results presented in this paper are a synthesis of the first assessment performed during 2017-2018. We present estimates of the altimetry-based global mean sea level (average rate of 3.1 +/- 0.3 mm/yr and acceleration of 0.1 mm/yr2 over 1993-present), as well as of the different components of the sea level budget. We further examine closure of the sea level budget, comparing the observed global mean sea level with the sum of components. Ocean thermal expansion, glaciers, Greenland and Antarctica contribute by 42%, 21%, 15% and 8% to the global mean sea level over the 1993-present. We also study the sea level budget over 2005-present, using GRACE-based ocean mass estimates instead of sum of individual mass components. Results show closure of the sea level budget within 0.3 mm/yr. Substantial uncertainty remains for the land water storage component, as shown in examining individual mass contributions to sea level.
-
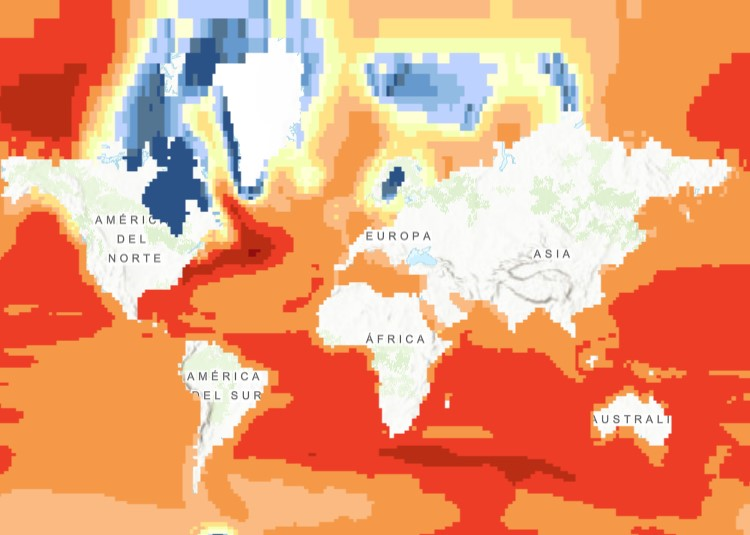
The raster dataset (1ºx1º) shows the projected change in relative sea level (in metres) in 2081-2100 compared to 1986-2005 for the medium-low emission scenario RCP4.5, based on an ensemble of Coupled Model Intercomparison Project Phase 5 (CMIP5) climate models. Projections consider land movement due to glacial isostatic adjustment but not land subsidence due to human activities. No projections are available for the Black Sea. The dataset has been used as a source for an earlier version of the EEA indicator “Global and European Sea Level”: https://www.eea.europa.eu/data-and-maps/indicators/sea-level-rise-5/assessment.
-
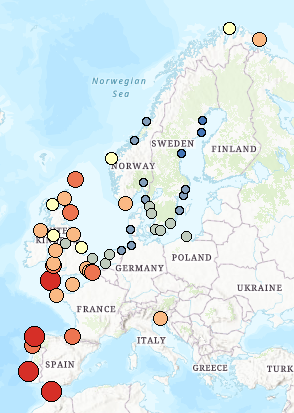
This dataset presents the estimated multiplication factor by which the frequency of flooding events of a given height in European tide gauges will change between 2010 and 2100, due to projected regional sea relative level rise under the Representative Concentration Pathways (RCP) 4.5 scenario. Values larger than 1 indicate an increase in flooding frequency. This dataset is derived from the Figure 13.25(b) of the Working Group I contribution to the IPCC Fifth Assessment Report (http://www.climatechange2013.org/images/report/WG1AR5_ALL_FINAL.pdf). This dataset also contributes to an earlier version of the EEA Indicator "Global and European sea-level": https://www.eea.europa.eu/data-and-maps/indicators/sea-level-rise-5/assessment.
-
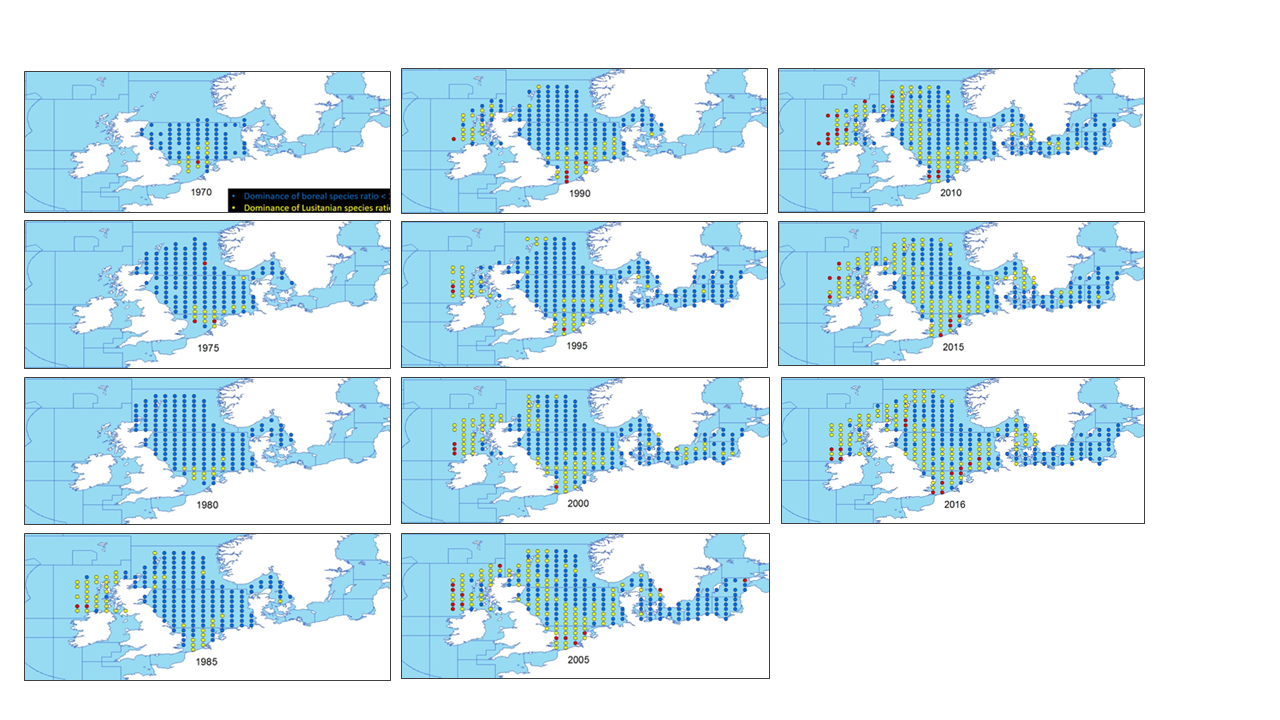
This metadata describes the ICES data on the temporal development of the Lusitanian/Boreal species ratio in the period from 19657 to 2016. Key message: The ratio between the number of Lusitanian (warm-favouring) and Boreal (cool-favouring) species are significantly increasing in several North-East Atlantic marine areas whereas there is no significant changes in all the southern areas. Changes in ratios are most apparent in the North Sea, Irish Sea and West of Scotland. Furthermore, it seems that Lusitanian species have not spread in all northward directions, but have followed two particular routes, through the English Channel and north around Scotland Blue dots indicates L/B ratios below 1 (dominance of Boreal species) Yellow dots indicates L/B ratios >=1 and <2 (dominance of Lusitanian species) Red dots indicates L/B ratios >=2 (high dominance of Lusitanian species) The dataset is derived from the ICES data portal 'DATRAS' (the Database of Trawl Surveys). DATRAS is an online database of trawl surveys with access to standard data products. DATRAS stores data collected primarily from bottom trawl fish surveys coordinated by ICES expert groups. The survey data are covering the Baltic Sea, Skagerrak, Kattegat, North Sea, English Channel, Celtic Sea, Irish Sea, Bay of Biscay and the eastern Atlantic from the Shetlands to Gibraltar. At present, there are more than 56 years of continuous time series data in DATRAS, and survey data are continuously updated by national institutions. The dataset has been used in the EEA Indicator "Changes in fish distribution in European seas" https://www.eea.europa.eu/data-and-maps/indicators/fish-distribution-shifts/assessment-1. The dataset has been used for this static map: https://www.eea.europa.eu/en/analysis/indicators/changes-in-fish-distribution-in/temporal-development-of-the-ratio
-

The dataset shows the percentage of cities' administrative area (core city based on the Urban Morphological Zones dataset) inundated by the sea level rise of 1 metre, without any coastal flooding defences present for a series of individual coastal European cities (included in Urban Audit). The dataset has been computed using the CReSIS (Centre for Remote Sensing of Ice Sheets) dataset for 2018.
-
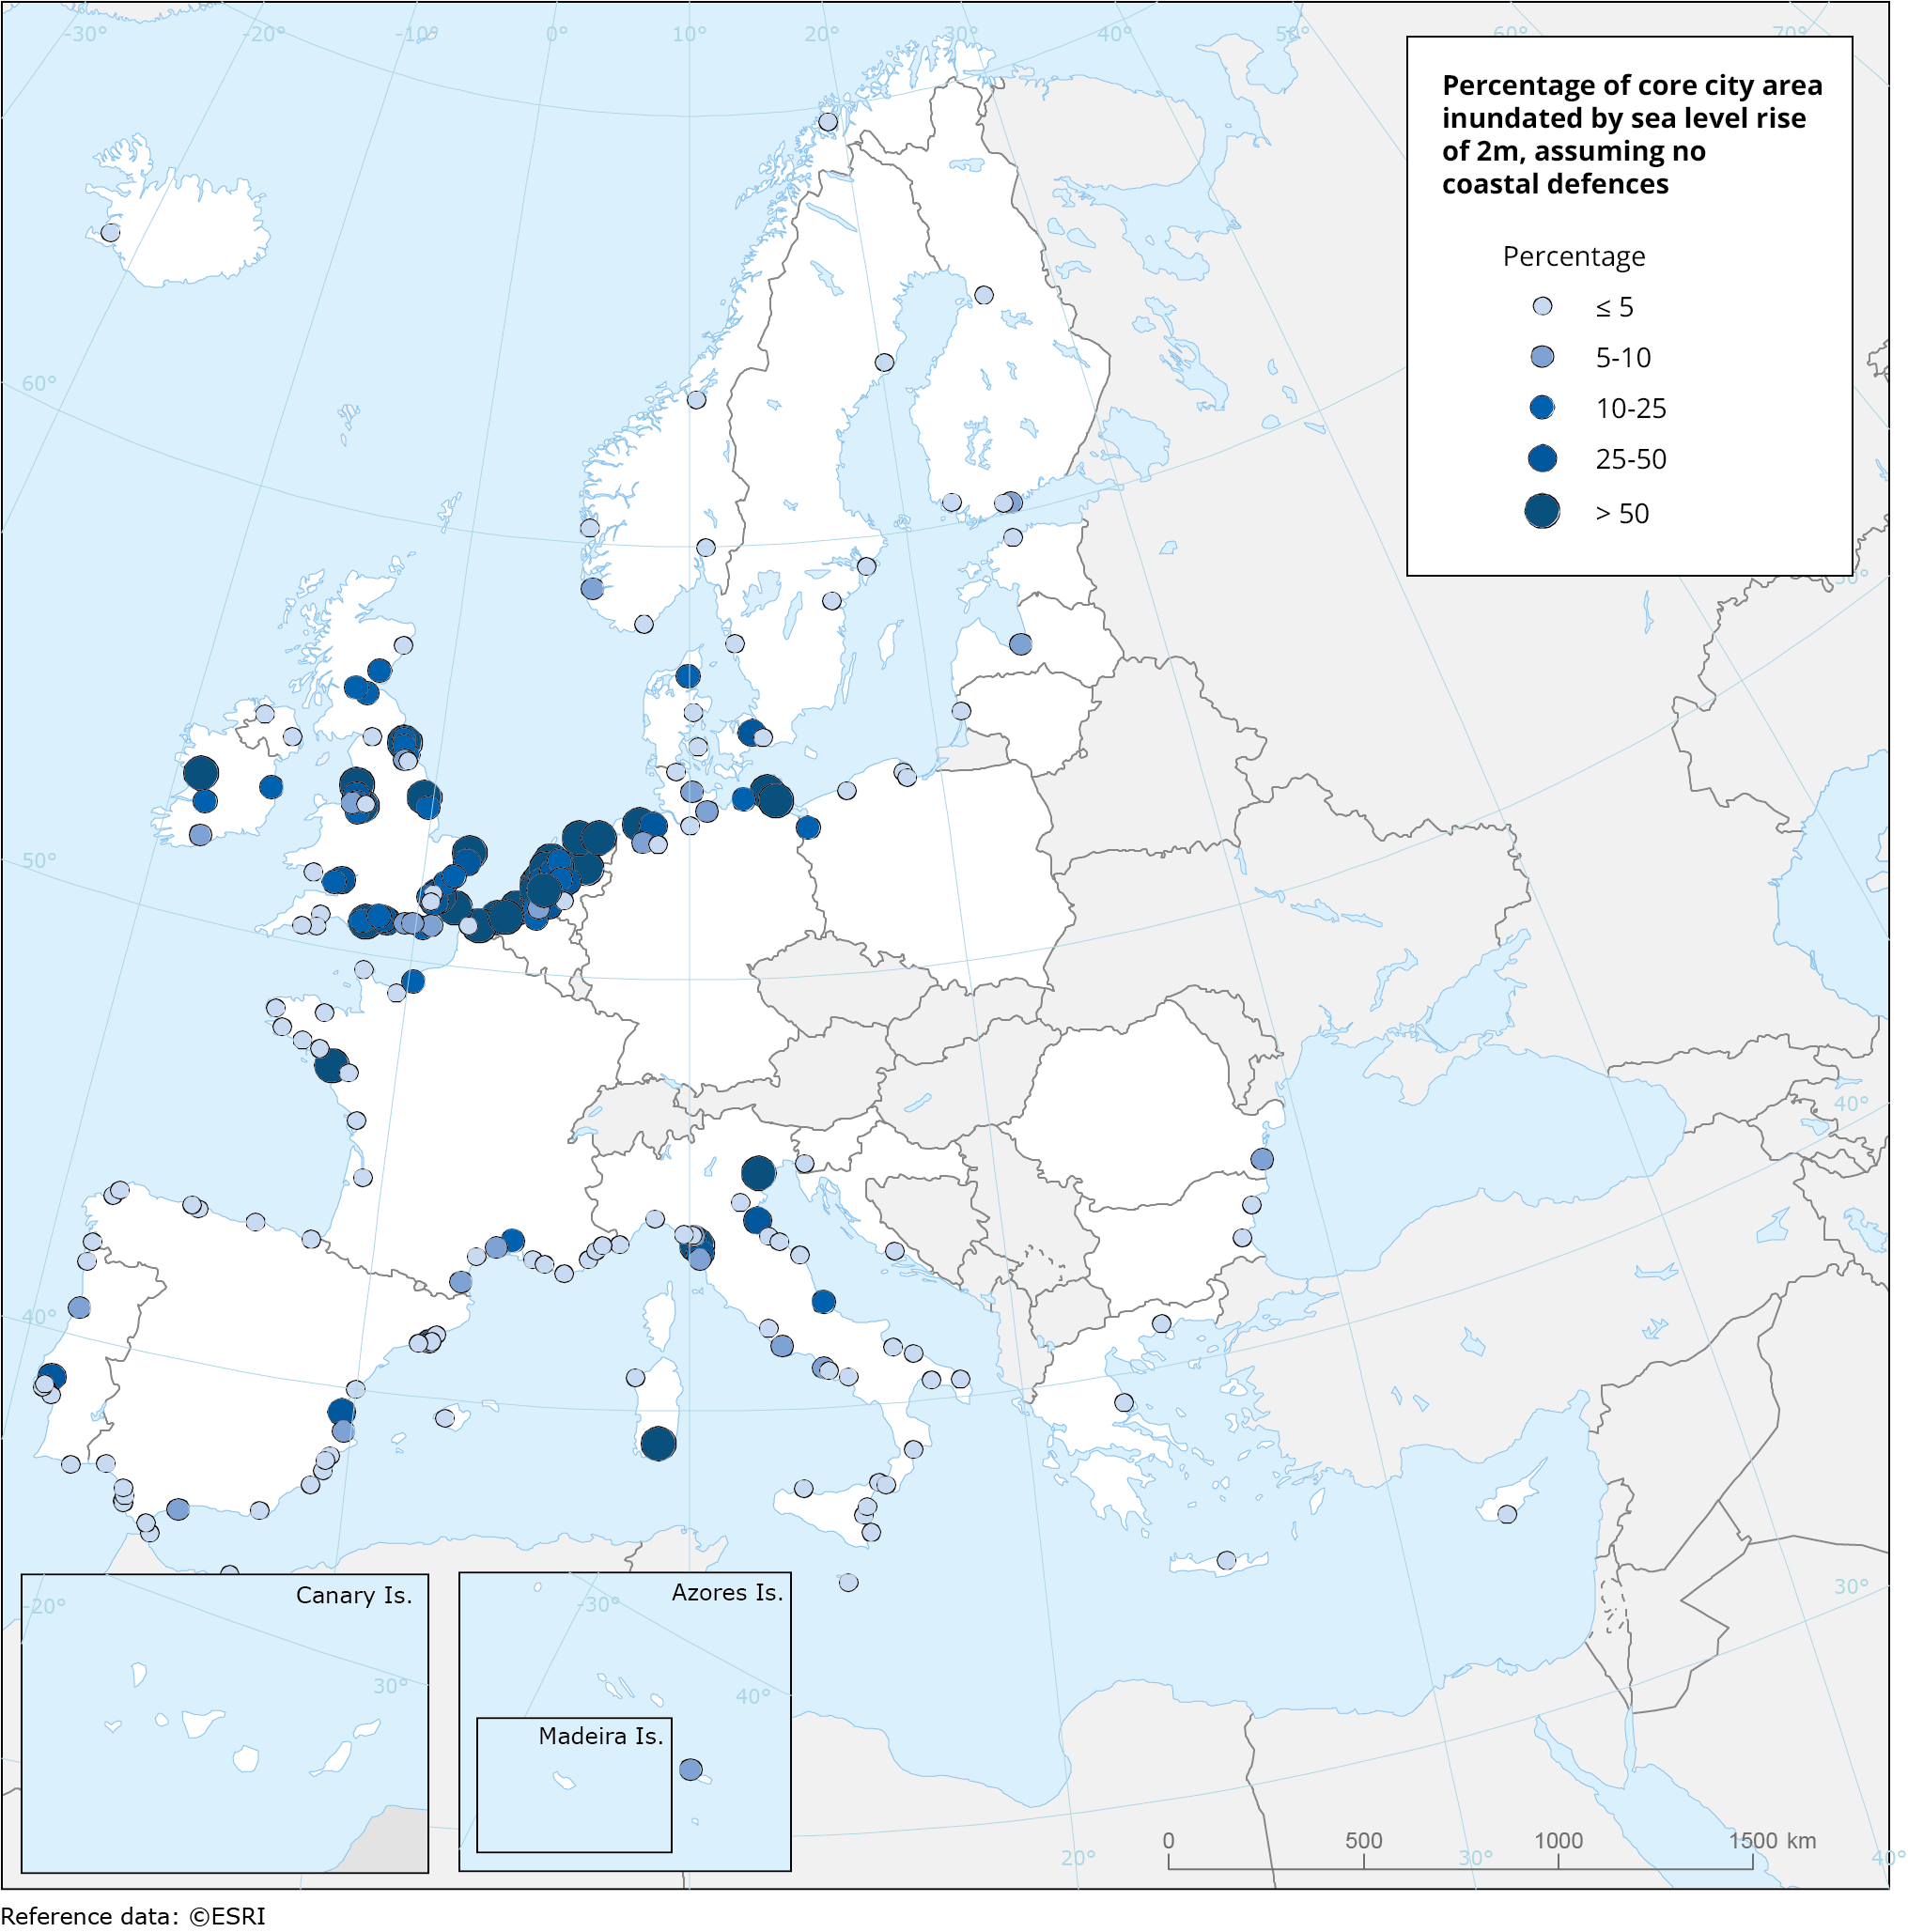
This metadata refers to a dataset that shows the percentage of cities' administrative area (core city based on the Urban Morphological Zones dataset) inundated by the sea level rise of 2 metres, without any coastal flooding defences present for a series of individual coastal European cities (included in Urban Audit). The dataset has been computed using the CReSIS (Centre for Remote Sensing of Ice Sheets) dataset for 2018.