 Catalogue PIGMA
flooding
Type of resources
Available actions
Topics
Keywords
Contact for the resource
Provided by
Years
Formats
Representation types
Update frequencies
Scale
-
This dataset presents the estimated multiplication factor by which the frequency of flooding events of a given height in European tide gauges will change between 2010 and 2100, due to projected regional sea relative level rise under the Representative Concentration Pathways (RCP) 4.5 scenario. Values larger than 1 indicate an increase in flooding frequency. This dataset is derived from the Figure 13.25(b) of the Working Group I contribution to the IPCC Fifth Assessment Report (http://www.climatechange2013.org/images/report/WG1AR5_ALL_FINAL.pdf). This dataset also contributes to an earlier version of the EEA Indicator "Global and European sea-level": https://www.eea.europa.eu/data-and-maps/indicators/sea-level-rise-5/assessment.
-

The dataset shows the percentage of cities' administrative area (core city based on the Urban Morphological Zones dataset) inundated by the sea level rise of 1 metre, without any coastal flooding defences present for a series of individual coastal European cities (included in Urban Audit). The dataset has been computed using the CReSIS (Centre for Remote Sensing of Ice Sheets) dataset for 2018.
-
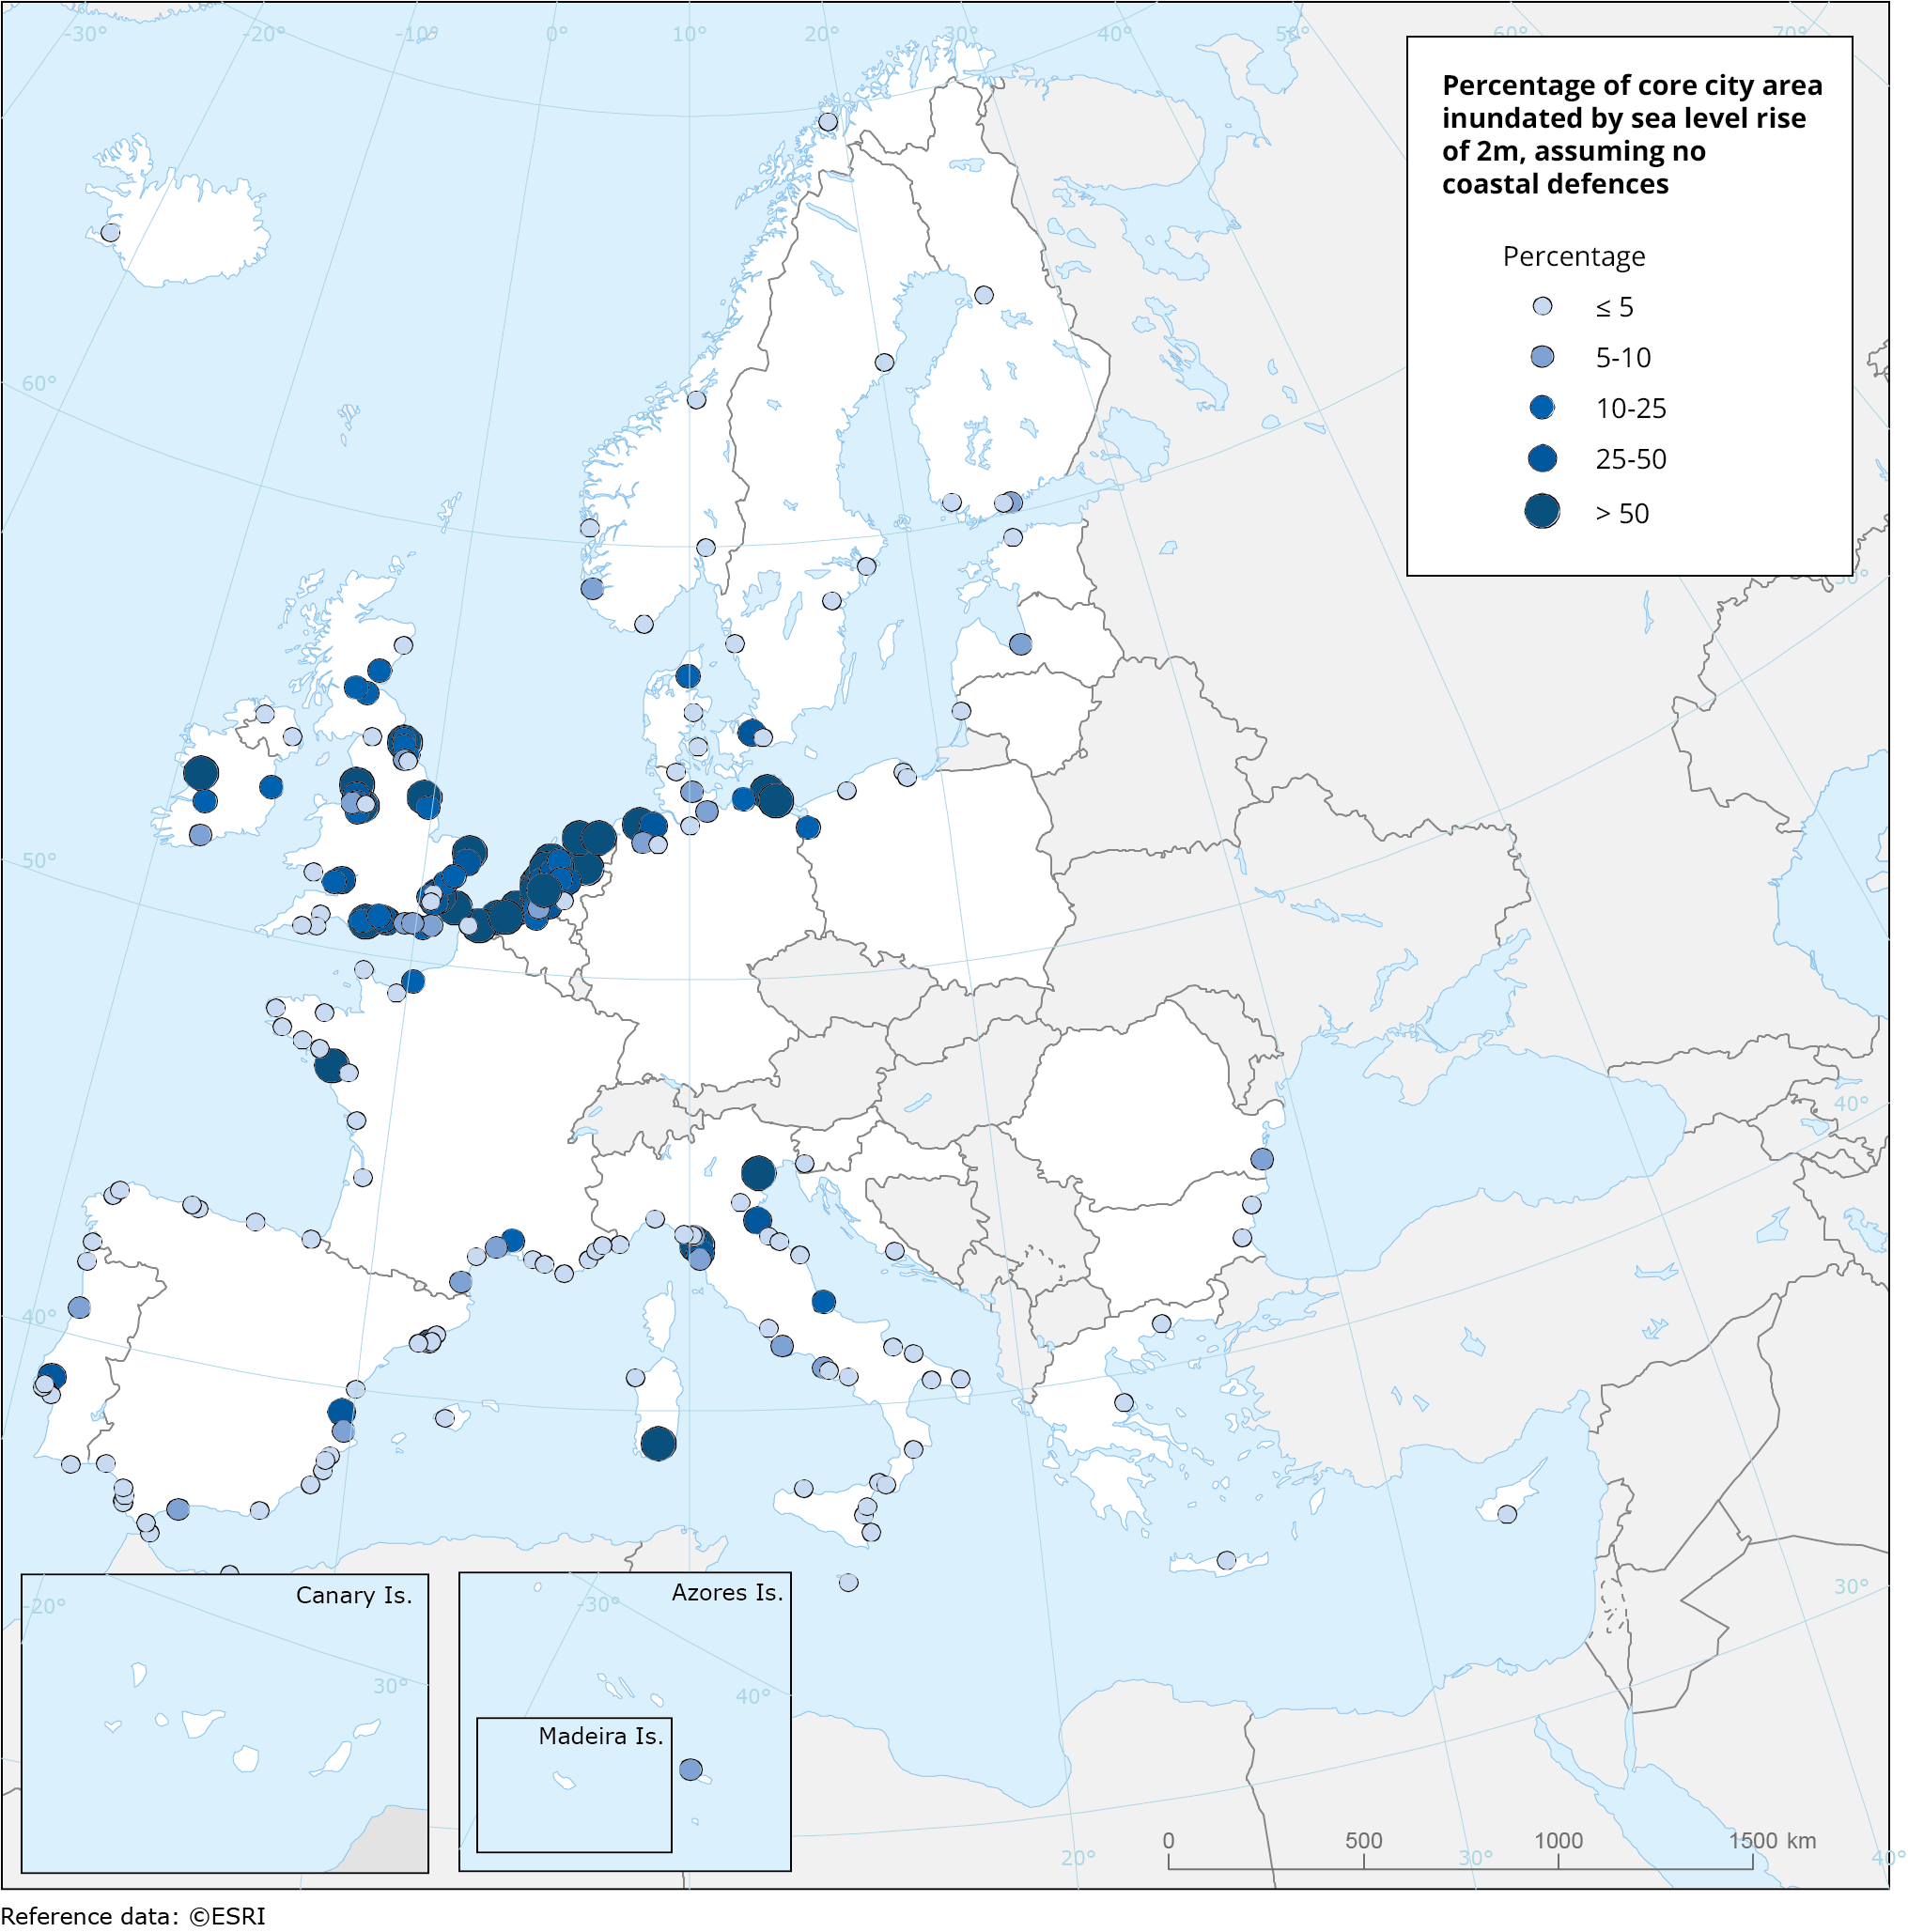
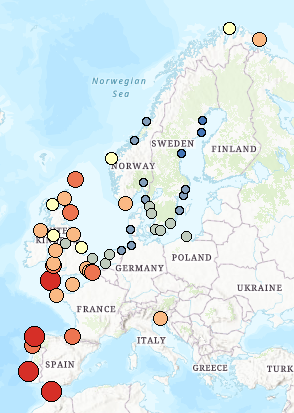
This metadata refers to a dataset that shows the percentage of cities' administrative area (core city based on the Urban Morphological Zones dataset) inundated by the sea level rise of 2 metres, without any coastal flooding defences present for a series of individual coastal European cities (included in Urban Audit). The dataset has been computed using the CReSIS (Centre for Remote Sensing of Ice Sheets) dataset for 2018.