oceanography
Type of resources
Available actions
Topics
Keywords
Contact for the resource
Provided by
Years
Formats
Representation types
Update frequencies
status
-
Shom uses HYCOM 3D (Hybrid Coordinate Ocean Model) digital models to model changes to the ocean environment (currents, temperature, salinity, water depth). These HYCOM 3D models include a scalable (space and time) vertical grid, which is particularly suitable for the coastal regions and physical phenomena modelled (particularly the transition from a deep sea zone to the continental shelf, and the presence of frontal zones). These models were adapted to coastal models at Shom, particularly by integrating tides and the effects of rivers. These models focus on changes and variability in the different physical processes affecting coastal areas (continental shelves and slopes), such as tidal fronts, river plumes, tides and internal waves, upwelling and the dynamics of the mixed layer at an hourly frequency and with high spatial resolution (1/60 deg for the Biscay Channel model).
-

This dataset is composed by the climatological seasonal field of the Ocean Salinity Stratification as defined from the Brunt-Vaisala frequency limited to the upper 300 m depth. The details are given in Maes, C., and T. J. O’Kane (2014), Seasonal variations of the upper ocean salinity stratification in the Tropics, J. Geophys. Res. Oceans, 119, 1706–1722, doi:10.1002/2013JC009366.
-
The Shom uses a 2D barotropic version of the HYCOM code (https://hycom.org/) to compute water level /surge forecasts (astronomical tides and meteorological surges) for the Atlantic, Mediterranean, Antilles-Guyane and Indian Ocean domains. The configurations use curvilinear grid with resolutions of several km offshore and ranging from 1.5km to around 500m on the french mainland coasts and the Antilles-Guyana coast. A downscaling by nesting allows a resolution of 800m to 200m over the Indian domain. These models have been adapted by the Shom to be operable in coastal areas by taking into account, in particular, the tide and high resolution bathymetry in these areas (from 100m for DTMs of facade to 20m for coastal DTMs) using Litto3D surveys by airborne LIDAR. The models are operated by Météo-France and the Shom in the framework of the HOMONIM project for the coastal flood/wave warning system.
-

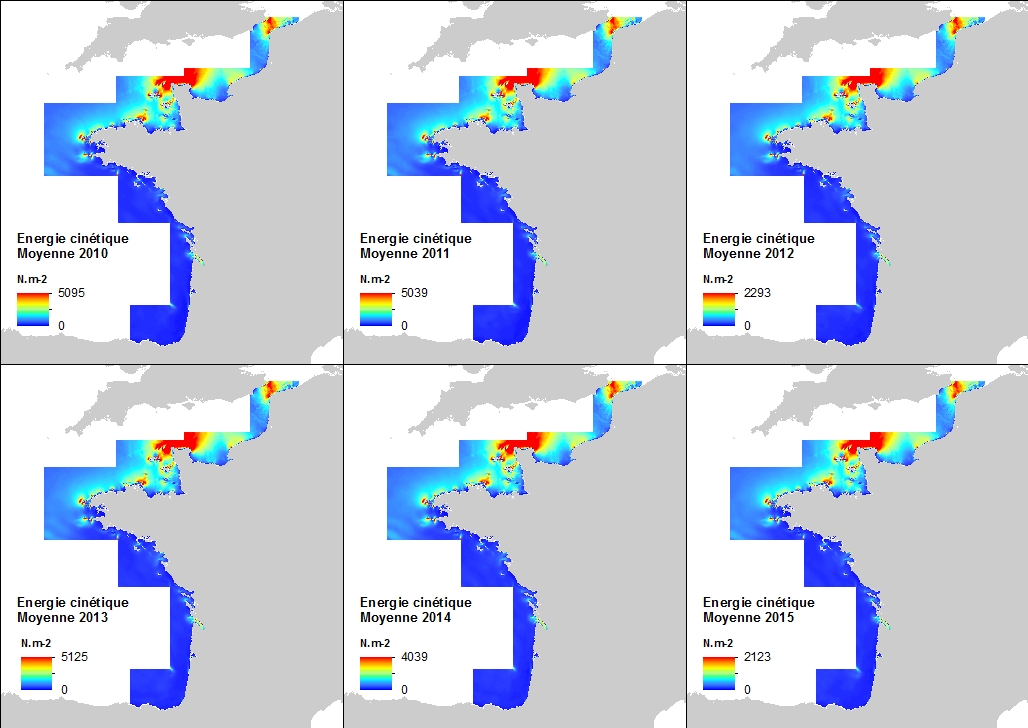
This annual statistics at 500m horizontal resolution was produced from the archived time series of MARS 3D physics model hindcast runs along French Atlantic Coast. The variable that is available here is the Kinetic Energy induced by currents caused by tide, water density gradients and action of winds. The formula used for the Kinetic Energy calculation is 0.5mv², where m is the density of seawater (1027 kg.m-3) and v is the current-induced velocity. Values are expressed in N.m-2 (Newton per square meter). The vertical level is the seabed.
-

The upper ocean pycnocline (UOP) monthly climatology is based on the ISAS20 ARGO dataset containing Argo and Deep-Argo temperature and salinity profiles on the period 2002-2020. Regardless of the season, the UOP is defined as the shallowest significant stratification peak captured by the method described in Sérazin et al. (2022), whose detection threshold is proportional to the standard deviation of the stratification profile. The three main characteristics of the UOP are provided -- intensity, depth and thickness -- along with hydrographic variables at the upper and lower edges of the pycnocline, the Turner angle and density ratio at the depth of the UOP. A stratification index (SI) that evaluates the amount of buoyancy required to destratify the upper ocean down to a certain depth, is also included. When evaluated at the bottom of the UOP, this gives the upper ocean stratification index (UOSI) as discussed in Sérazin et al. (2022). Three mixed layer depth variables are also included in this dataset, including the one using the classic density threshold of 0.03 kg.m-3, along with the minimum of these MLD variables. Several statistics of the UOP characteristics and the associated quantities are available in 2°×2° bins for each month of the year, whose results were smoothed using a diffusive gaussian filter with a 500 km scale. UOP characteristics are also available for each profile, with all the profiles sorted in one file per month.
-

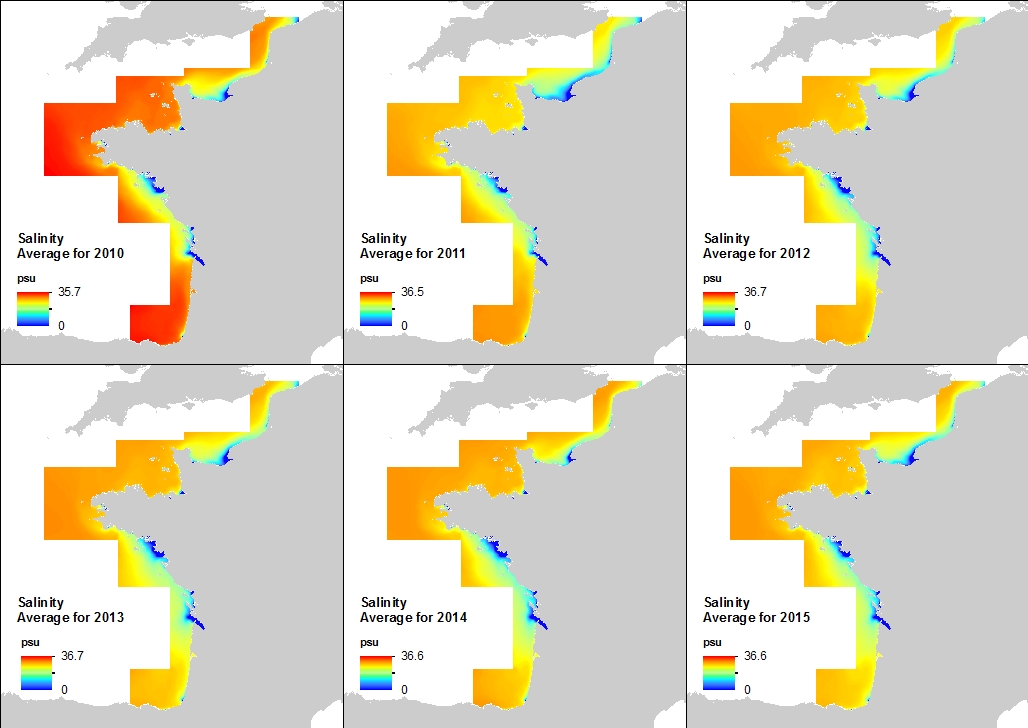
This annual statistics at 500m horizontal resolution was produced from the archived time series of MARS 3D physics model hindcast runs along French Atlantic Coast. The variable that is available here is the Salinity. Values are expressed in psu. The vertical level is the sea surface.
-

This annual statistics at 500m horizontal resolution was produced from the archived time series of MARS 3D physics model hindcast runs along French Atlantic Coast. The variable that is available here is Temperature. Values are expressed in Celsius degrees. In each pixel the value is an average of the values of the 40 vertical levels that are considered in the model.
-

This annual statistics at 500m horizontal resolution was produced from the archived time series of MARS 3D physics model hindcast runs along French Atlantic Coast. The variable that is available here is the Temperature. Values are expressed in Celcius degrees. The vertical level is the seabed.
-

This annual statistics at 500m horizontal resolution was produced from the archived time series of MARS 3D physics model hindcast runs along French Atlantic Coast. The variable that is available here is the Kinetic Energy induced by currents caused by tide, water density gradients and action of winds. The formula used for the Kinetic Energy calculation is 0.5mv², where m is the density of seawater (1027 kg.m-3) and v is the current-induced velocity. Values are expressed in N.m-2 (Newton per square meter). The vertical level is the sea surface.
-

This annual statistics at 500m horizontal resolution was produced from the archived time series of MARS 3D physics model hindcast runs along French Atlantic Coast. The variable that is available here is the Salinity. Values are expressed in psu. The vertical level is the seabed.
 Catalogue PIGMA