 Catalogue PIGMA
IFREMER
Type of resources
Available actions
Topics
Keywords
Contact for the resource
Provided by
Years
Formats
Representation types
Update frequencies
status
Service types
Scale
Resolution
-
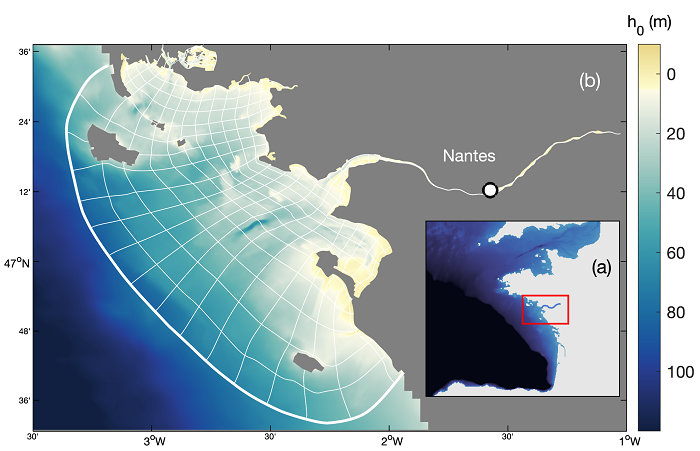
A ten-year numerical hindcast of hydrodynamics, hydrology and sediment dynamics in the Loire Estuary (France), produced by coupling the hydrodynamics model MARS3D with the sediment dynamics module MUSTANG and the wave spectral model WAVEWATCH III®. Numerical simulations are based on the same model chain used in the Seine Estuary (curviseine) and the Gironde Estuary (curvigironde).
-
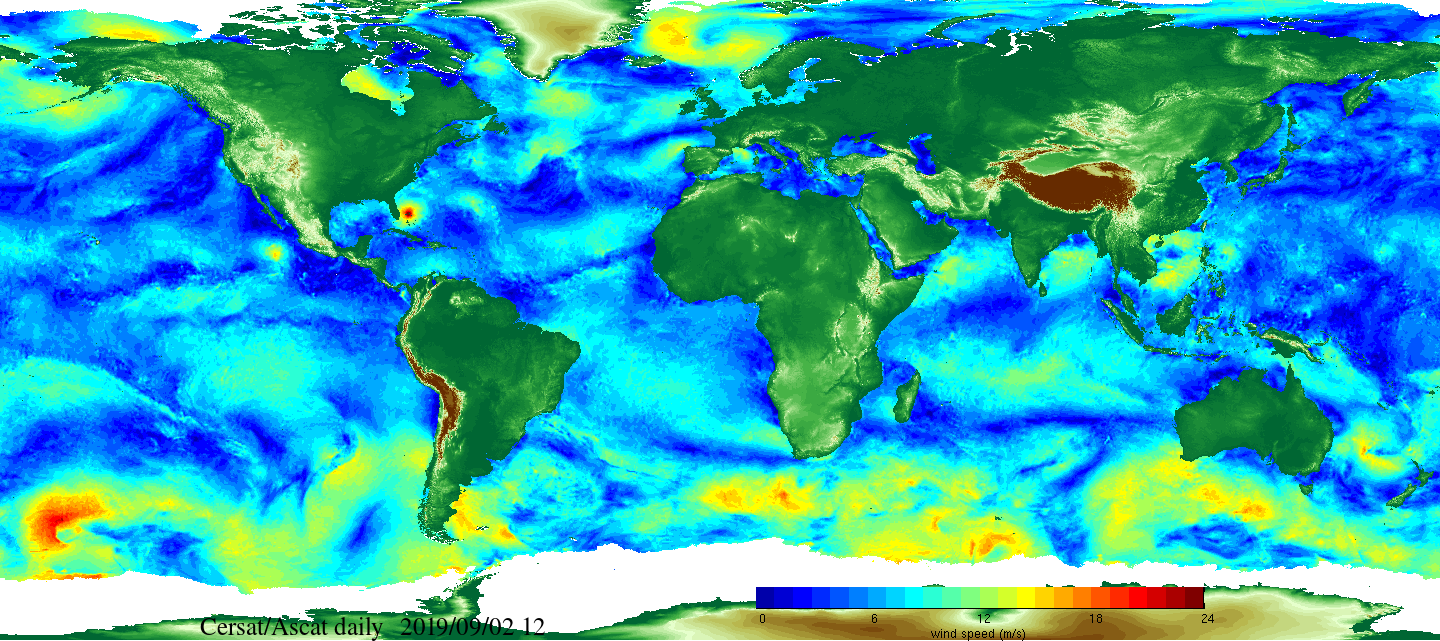
Daily and monthly surface wind analyses are determined as gridded wind products over global oceans, with regular spatial resolution of 0.25° in latitude and longitude. They are estimated from scatterometer wind retrievals (L2b data). According to the scatterometer sampling scheme, the objective method allowing the determination of regular in space surface wind fields uses remotely sensed observations as well as ECMWF analyses. The calculation of daily estimates uses ascending as well as descending available and valid retrievals. The objective method aims to provide daily-averaged gridded wind speed, zonal component, meridional component, wind stress and the corresponding components at global scale. The error associated to each parameter, related to the sampling impact and wind space and time variability, is provided too. Monthly wind analyses are calculated from daily estimates.
-
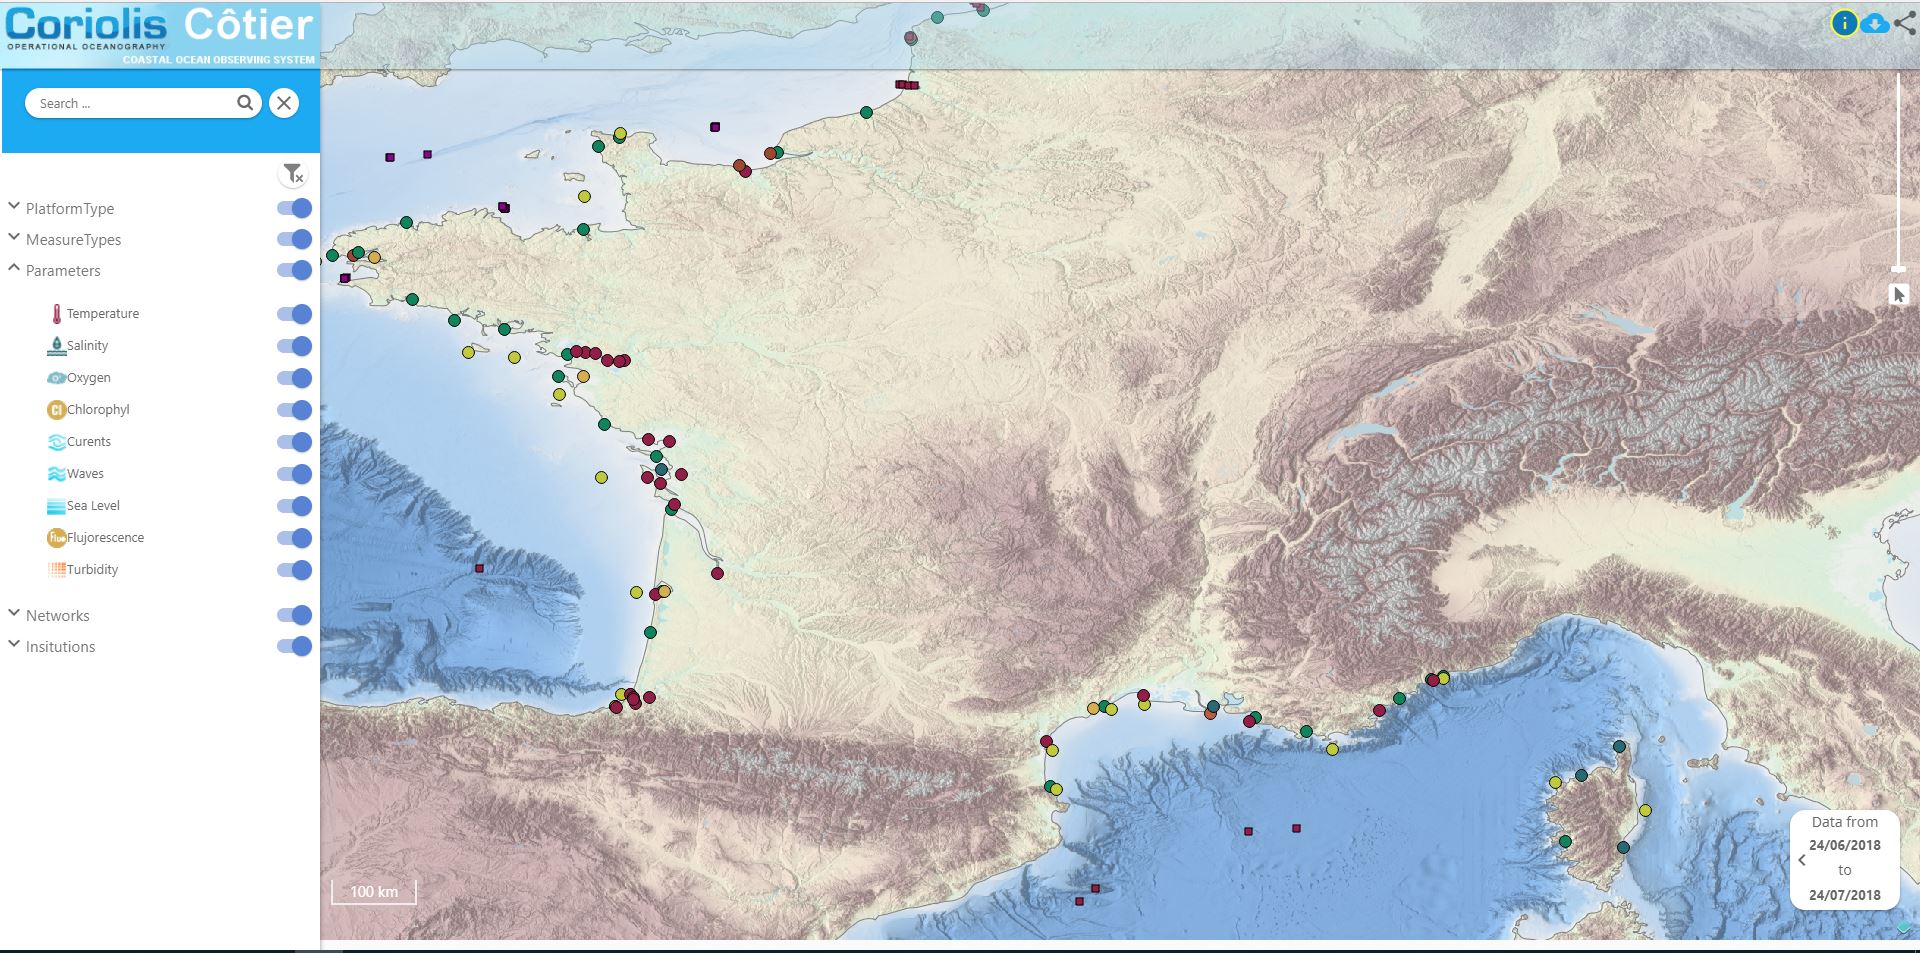
Data available in the French Coast
-

Analysis of tuna stomach contents
-

This dataset provides global surface winds and pressure fields on a 0.25° resolution horizontal grid with hourly frequency, based on the global ERA5 reanalysis but with enhanced realistic TCs, built from a parametric wind formulation fitted to SAR high-resolution observations. TC wind structures in ERA5 are indeed known to be strongly biased. The methodology, developed in Herry et al. (2025) and applied here, is to replace ERA5 underestimated winds in TCs by the parametric wind formulation of Wood et al. (2013) with optimized parameters (fitted to SAR data), while keeping ERA5 wind field elsewhere. The wind profile and the transition area between the parametric and ERA5 winds are adjusted for each TC, according to its intensity and size. This blended product manages to represent a variety of realistic TC structures, and ensure an asymmetry associated to the synoptic flow for each case.
-
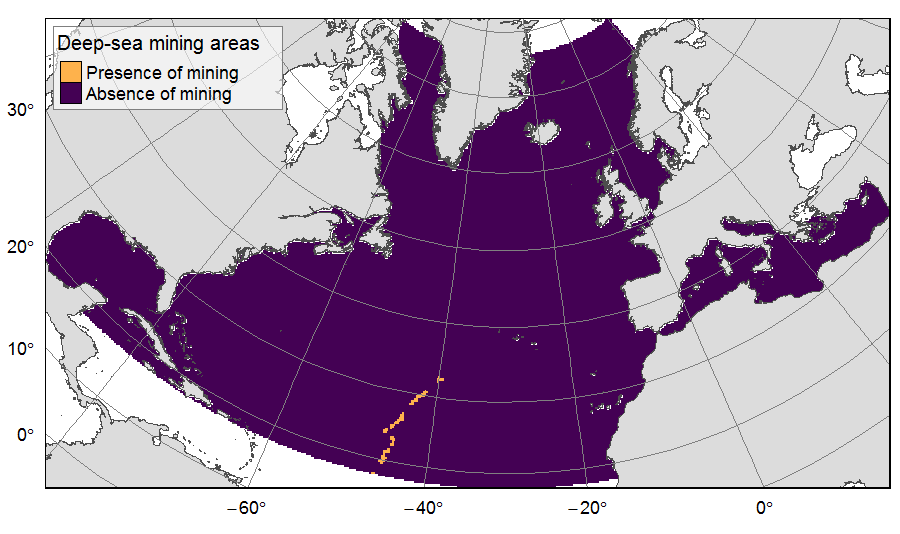
Presence of deep-sea mining exploration zones on the North Atlantic (18°N to 76°N and 36°E to 98°W). These areas correspond to the three polymetallic sulphides exploration contracts on the Mid-Atlantic Ridge, attributed to Poland, France and Russia. Each of the three contract areas is divided into 100 squares of 10km by 10km. Source polygons originated from the International Seabed Authority. The presence (value=1) of deep-sea mining was extracted in 25km * 25km gridsquares. This dataset was built to feed a basin-wide spatial conservation planning exercise, targeting the deep sea of the North Atlantic. The goal of this approach was to identify conservation priority areas for Vulnerable Marine Ecosystems (VMEs) and deep fish species, based on the distribution of species and habitats, human activities and current spatial management.
-
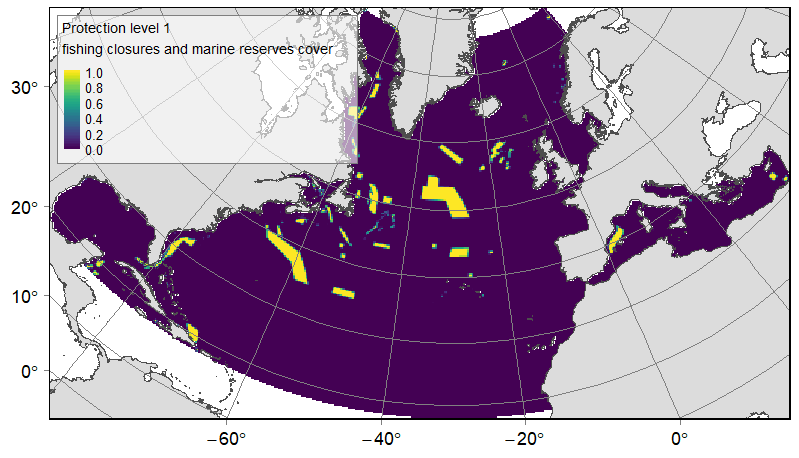
Distribution of three categories of protected or significant areas on the North Atlantic (18°N to 76°N and 36°E to 98°W). Categories were delineated according to relative levels of protection, from the highest to the lowest: fishing closures implemented by Regional Fisheries Management Organisations (RFMOs) and marine reserves; other MPAs likely to benefit from a lower protection; and Ecologically or Biologically Significant Marine Areas (EBSAs). Source vector data originated from the RFMOs (NAFO, NEAFC and GFCM), the World Database on Protected Areas (WDPA), national MPAs databases (US: NOAA and SAFMC; Canada: Fisheries and Oceans Canada; Norway: Institute of Marine Research) and the CBD website. The relative cover or each protection category on 25km *25km gridsquares was computed. This dataset was built to feed a basin-wide spatial conservation planning exercise, targeting the deep sea of the North Atlantic. The goal of this approach was to identify conservation priority areas for Vulnerable Marine Ecosystems (VMEs) and deep fish species, based on the distribution of species and habitats, human activities and current spatial management.
-

In European sea bass like in other animals, the tongue plays a fundamental role in the mechanics of food ingestion. It is composed from the surface in depth of mucosa, submucosa, musculature and fibro cartilaginous skeleton. The tunica mucosa exhibits a stratified epithelium interrupted by numerous teeth differently distributed that erupt more or less completely from the layers below. The European sea bass tongue is composed of canine-like teeth, surrounded by taste buds and numerous fungiform and conical papillae. The tongue beeing directly in contact with external environment, the success of the adaptation of fishes to different environments in the context of global change, depends oamong other on the modifications occurring on the tongue structures. The present study investigates the potential effect of ocean acidification on the lingual transcriptome.
-
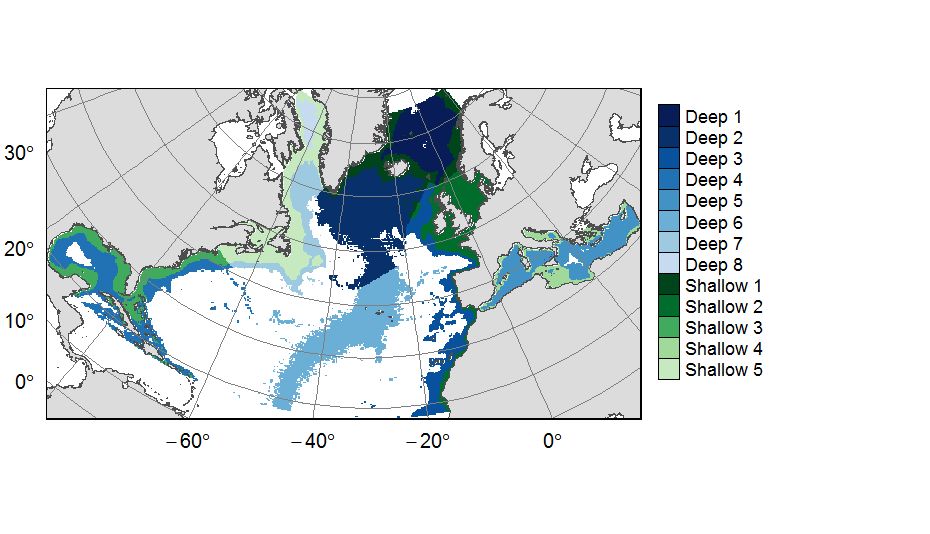
Planning units layers used for ATLAS EU prioritization scenarios on the North Atlantic (18°N to 76°N and 36°E to 98°W). This raster layer is designed on a grid of 25km * 25km resolution, that served to extract all the spatial data used prioritization. The 31 518 planning units (cells with value) corresponded to areas containing depths shallower or equal to 3500m, even if they could also contain deeper areas locally. For connectivity scenarios, only the planning units matching with the extent of available connectivity data were selected. One layer allocates planning units to the 13 geographical provinces (values ranging from 1 to 13) created for the purpose of prioritization. This dataset was built to feed a basin-wide spatial conservation planning exercise, targeting the deep sea of the North Atlantic. The goal of this approach was to identify conservation priority areas for Vulnerable Marine Ecosystems (VMEs) and deep fish species, based on the distribution of species and habitats, human activities and current spatial management.
-
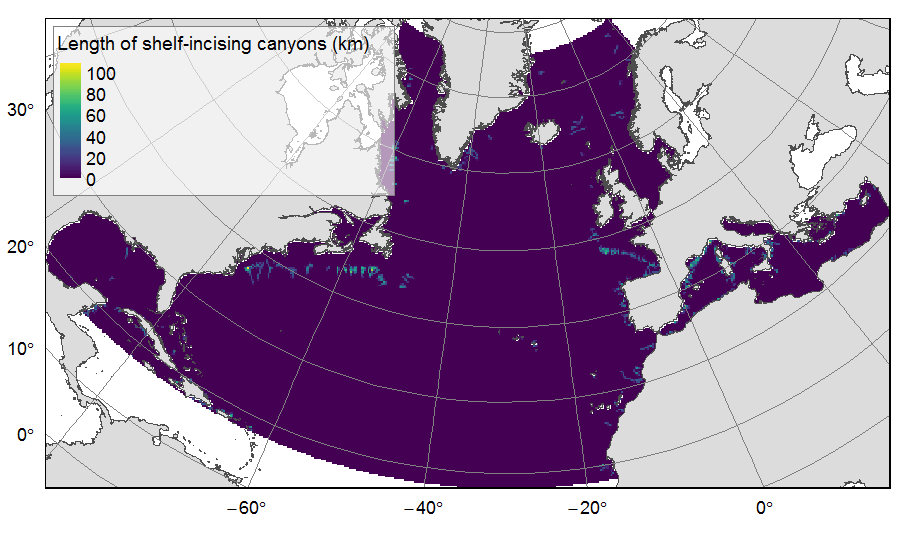
Distribution of three geomorphologic features (fracture zones, canyons, and seamounts) on the North Atlantic (18°N to 76°N and 36°E to 98°W). Source vector data originated from the GEBCO Gazetteer of Undersea Features Names for fractures, Harris & Whiteway (2011) for canyons, and Yesson et al. (2011) for seamounts. The presence (value=1) of fracture zones or seamounts and the total length of canyons (in km, independently for shelf-incising or blind canyons) was extracted in 25km * 25km gridsquares. This dataset was built to feed a basin-wide spatial conservation planning exercise, targeting the deep sea of the North Atlantic. The goal of this approach was to identify conservation priority areas for Vulnerable Marine Ecosystems (VMEs) and deep fish species, based on the distribution of species and habitats, human activities and current spatial management.