 Catalogue PIGMA
IFREMER / IDM / SISMER - Scientific Information Systems for the SEA
Type of resources
Available actions
Topics
Keywords
Contact for the resource
Provided by
Years
Formats
Representation types
Update frequencies
status
Scale
Resolution
-
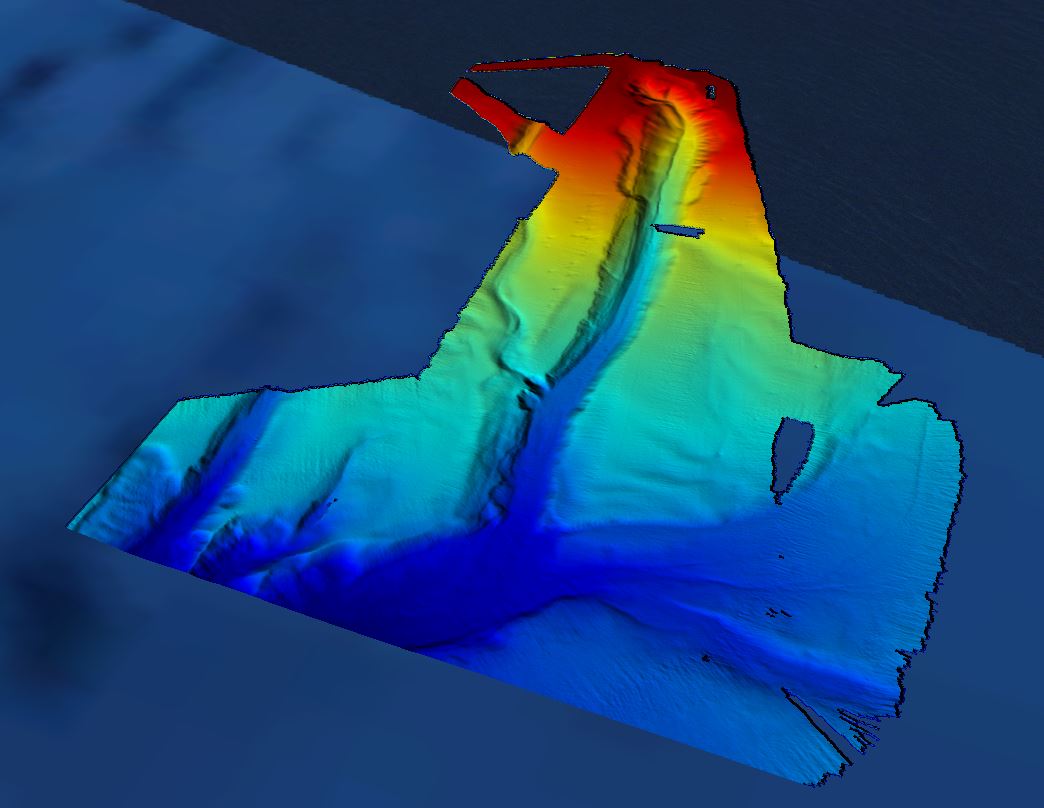
Grid processed for the purpose of the HR DTMs layer of EMODnet Bathymetry HRSM, October 2018
-
The Digital Terrain Model of the Bay of Biscaye and of the Channel is the result of the processing of a compilation of single and multibeam echosounder data, of DTMs and of chart countours produced before 2008 for hydrodynamic modeling..
-
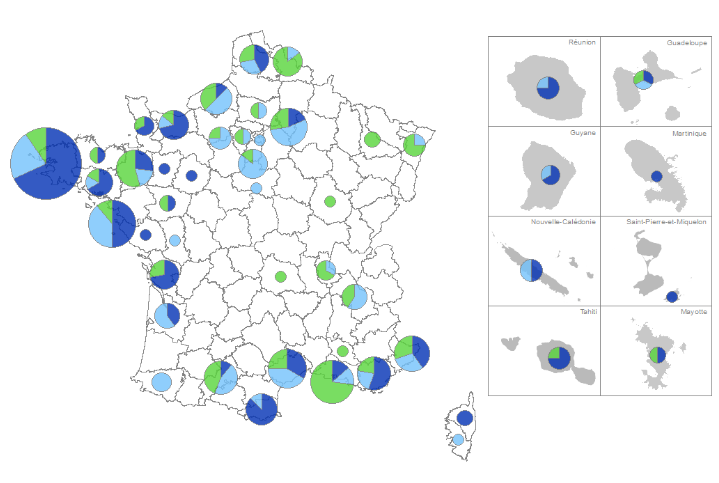
Inventaire quantitatif et qualitatif des ressources publiques en France ayant des activités de recherche en Sciences et Techniques de la Mer. Ce jeu de données dresse une liste exhaustive des entités publiques en France (Unités de recherche, laboratoires, centres techniques, etc.) ayant des activités de recherche significatives et régulières en Sciences et Techniques de la Mer. Il permet d’identifier les thèmes de recherche de chaque entité, de connaître où et dans quel cadre organisationnel cette recherche est effectuée, et d'accéder aux effectifs de ces acteurs publics, répartis par catégorie de qualification (chercheurs, ingénieurs, techniciens…). En effet, chaque entité est décrite par un ensemble d'informations: description, localisation, organismes de tutelle, date d'évaluation par le Hcéres* si existante, classification par domaine Hcéres, par thème de recherche, ensemble de mots clefs décrivant l'activité de recherche en STM de l'entité et ses domaines d’application, effectifs de recherche en STM de l'entité en Équivalents Temps Plein par catégorie de personnel, classement de l'entité parmi 3 catégories: 100% Maritime, Partiellement maritime, Contributive, budget opérationnel de l'entité et la part de celui-ci consacré à la recherche en Sciences et Techniques de la Mer. Ces données sont bancarisées dans la base de données SERVEUR du SISMER. Les 7 couches proposées ici permettent de visualiser ces données sous forme de cartographie. Cette étude, réalisée par l’Ifremer, répond à une sollicitation du Conseil National de la Mer et du Littoral et de son comité spécialisé pour la recherche marine, maritime et littorale, le COMER, et a été co-financée par le Commissariat Général au Développement Durable (CGDD), dans le cadre d’une convention de partenariat et de subvention 17-MUTS-MER ET LITTORAL-1-CVS-002 2017 - n° Chorus 2 102 231 000, entre le Ministère de la Transition Écologique et Solidaire et l’Ifremer. Les résultats présentés ici ont fait l’objet d’une publication détaillant le besoin, la méthodologie et proposant de premières analyses : Moulinier Hervé, Vernet Marine, Dosdat Antoine, Petit De La Villeon Loic, Le Gall Morgane, Ibarra Doriane, Meillon Julien (2020). « Sciences et Techniques de la Mer », un inventaire national quantitatif et qualitatif des ressources publiques de recherche. https://doi.org/10.13155/76327 *Haut Conseil de l’évaluation de la recherche et de l’enseignement supérieur
-

This visualization product displays the density of floating micro-litter per net normalized per m³ per year from specific protocols different from research and monitoring protocols. EMODnet Chemistry included the collection of marine litter in its 3rd phase. Before 2021, there was no coordinated effort at the regional or European scale for micro-litter. Given this situation, EMODnet Chemistry proposed to adopt the data gathering and data management approach as generally applied for marine data, i.e., populating metadata and data in the CDI Data Discovery and Access service using dedicated SeaDataNet data transport formats. EMODnet Chemistry is currently the official EU collector of micro-litter data from Marine Strategy Framework Directive (MSFD) National Monitoring activities (descriptor 10). A series of specific standard vocabularies or standard terms related to micro-litter have been added to SeaDataNet NVS (NERC Vocabulary Server) Common Vocabularies to describe the micro-litter. European micro-litter data are collected by the National Oceanographic Data Centres (NODCs). Micro-litter map products are generated from NODCs data after a test of the aggregated collection including data and data format checks and data harmonization. A filter is applied to represent only micro-litter sampled according to a very specific protocol such as the Volvo Ocean Race (VOR) or Oceaneye. Densities were calculated for each net using the following calculation: Density (number of particles per m³) = Micro-litter count / Sampling effort (m³) When the number of micro-litters was not filled, it was not possible to calculate the density. Percentiles 50, 75, 95 & 99 have been calculated taking into account data for all years. Warning: the absence of data on the map does not necessarily mean that they do not exist, but that no information has been entered in the National Oceanographic Data Centre (NODC) for this area.
-
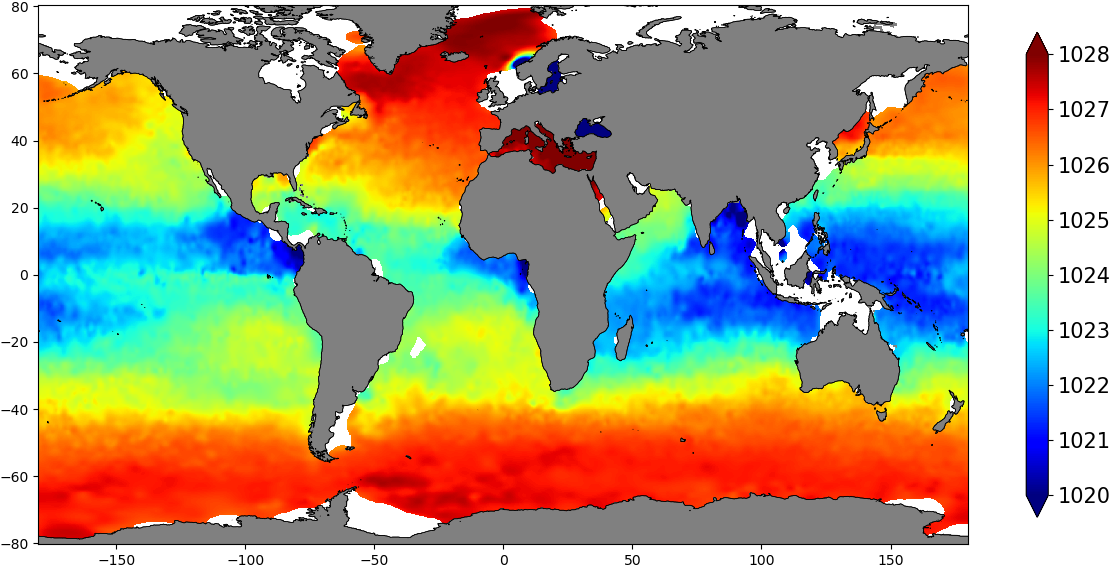
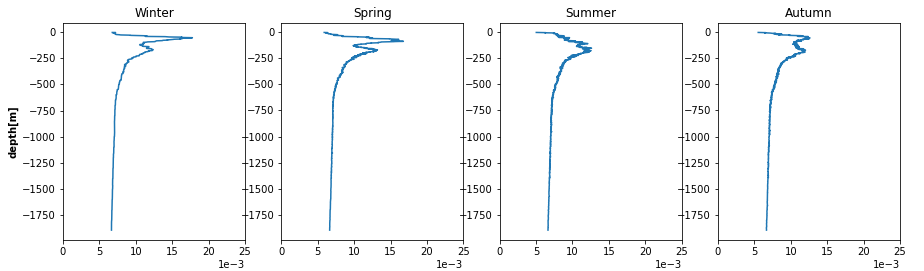
The SDC_GLO_CLIM_Dens product contains global monthly climatological estimates of in situ density using Temperature and Salinity from profiling floats contained in the World Ocean Data 18 (WOD18) database. The profiles were first quality controlled with a Nonlinear Quality control procedure. The climatology considers observations from surface to 2000 m for the time period 2003-2017. Density profiles are computed using UNESCO 1983 (EOS 80) equation from in situ temperature, salinity and pressure measurements by the PFL. Only profiles with both T,S values were used. The gridded fields are computed using DIVAnd (Data Interpolating Variational Analysis) version 2.3.1.
-
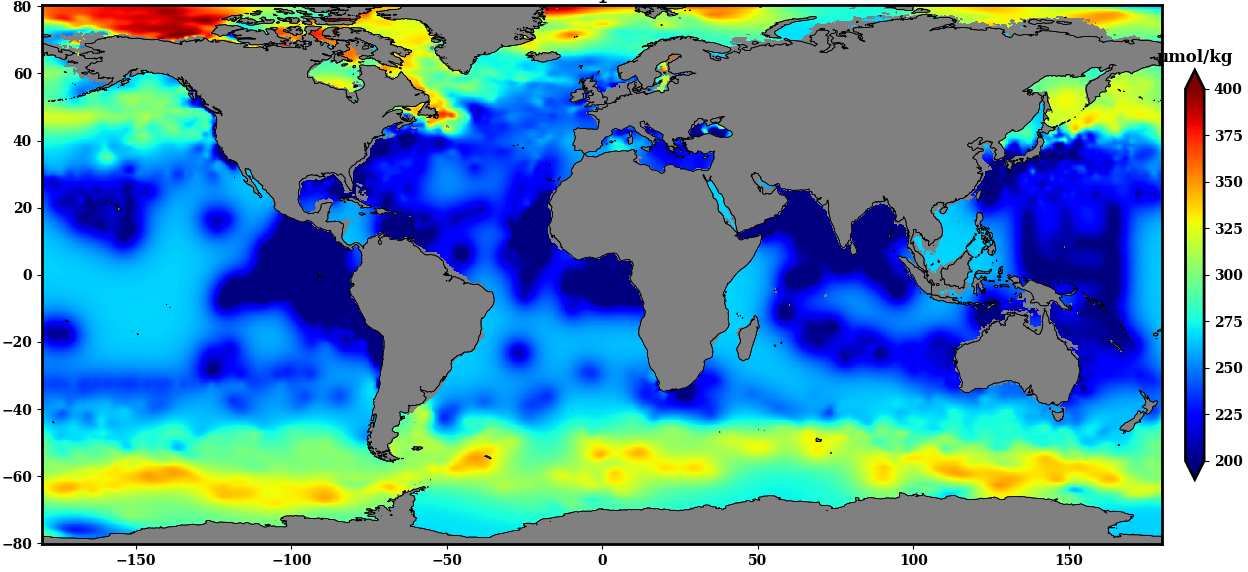
The SDC_GLO_CLIM_O2_AOU product contains two different monthly climatology for dissolved Oxygen and Apparent Oxygen Utilization, SDC_GLO_CLIM_O2 and SDC_GLO_CLIM_AOU respectively from the World Ocean Data (WOD) database. Only basic quality control flags from the WOD are used. The first climatology, SDC_GLO_CLIM_O2, considers Dissolved Oxygen profiles casted together with temperature and salinity from CTD, Profiling Floats (PFL) and Ocean Station Data (OSD) for time duration 2003 to 2017. The second climatology, SDC_GLO_CLIM_AOU, apparent Oxygen utilization, is computed as a difference of dissolved oxygen and saturation O2 profiles. The gridded fields are computed using DIVAnd (Data Interpolating Variational Analysis) version 2.3.1.
-
The SDC_GLO_CLIM_N2 product contains seasonally averaged Brunt-Vaisala squared frequency profiles using the density profiles computed in SeadataCloud Global Ocean Climatology - Density Climatology. The Density Climatology product uses the Profiling Floats (PFL) data from World Ocean database 18 for the time period 2003 to 2017 with a Nonlinear Quality procedure applied on it. Computed BVF profiles are averaged seasonally into 5x5 degree boxes for Atlantic and Pacific Oceans. For data access, please register at http://www.marine-id.org/.
-

This visualization product displays the type of litter in percent per net per year from specific protocols different from research and monitoring protocols. EMODnet Chemistry included the collection of marine litter in its 3rd phase. Before 2021, there was no coordinated effort at the regional or European scale for micro-litter. Given this situation, EMODnet Chemistry proposed to adopt the data gathering and data management approach as generally applied for marine data, i.e., populating metadata and data in the CDI Data Discovery and Access service using dedicated SeaDataNet data transport formats. EMODnet Chemistry is currently the official EU collector of micro-litter data from Marine Strategy Framework Directive (MSFD) National Monitoring activities (descriptor 10). A series of specific standard vocabularies or standard terms related to micro-litter have been added to SeaDataNet NVS (NERC Vocabulary Server) Common Vocabularies to describe the micro-litter. European micro-litter data are collected by the National Oceanographic Data Centres (NODCs). Micro-litter map products are generated from NODCs data after a test of the aggregated collection including data and data format checks and data harmonization. A filter is applied to represent only micro-litter sampled according to a very specific protocol such as the Volvo Ocean Race (VOR) or Oceaneye. To calculate percentages for each type, formula applied is: Type (%) = (∑number of particles of each type)*100 / (∑number of particles of all type) When the number of micro-litters was not filled or was equal to zero, it was not possible to calculate the percentage. Standard vocabularies for micro-litter types are taken from Seadatanet's H01 library (https://vocab.seadatanet.org/v_bodc_vocab_v2/search.asp?lib=H01). Some morphological types of micro-litters may have been sampled but were not defined by the protocole applied during the survey. They are represented as « undefined micro-litter items ». Warnings: - the absence of data on the map does not necessarily mean that they do not exist, but that no information has been entered in the National Oceanographic Data Centre (NODC) for this area. - since 03/07/2023, the preferred label « Undefined micro-litter items » has been integrated into the H01 library whereas the labels « microplastic items », « non-plastic man-made micro-particles (e.g. glass, metal, tar) » and «non-plastic filaments (natural fibres, rubber) » have been deprecated. When defined, the material or polymer type can be checked directly in the source data.
-

This visualization product displays the size of litter in percent per net per year from specific protocols different from research and monitoring protocols. EMODnet Chemistry included the collection of marine litter in its 3rd phase. Before 2021, there was no coordinated effort at the regional or European scale for micro-litter. Given this situation, EMODnet Chemistry proposed to adopt the data gathering and data management approach as generally applied for marine data, i.e., populating metadata and data in the CDI Data Discovery and Access service using dedicated SeaDataNet data transport formats. EMODnet Chemistry is currently the official EU collector of micro-litter data from Marine Strategy Framework Directive (MSFD) National Monitoring activities (descriptor 10). A series of specific standard vocabularies or standard terms related to micro-litter have been added to SeaDataNet NVS (NERC Vocabulary Server) Common Vocabularies to describe the micro-litter. European micro-litter data are collected by the National Oceanographic Data Centres (NODCs). Micro-litter map products are generated from NODCs data after a test of the aggregated collection including data and data format checks and data harmonization. A filter is applied to represent only micro-litter sampled according to a very specific protocol such as the Volvo Ocean Race (VOR) or Oceaneye. To calculate percentages for each size, formula applied is: Size (%) = (∑number of particles of each size)*100 / (∑number of particles of all size) When the number of micro-litters was not filled or was equal to zero, it was not possible to calculate the percentage. Standard vocabularies for micro-litter size classes are taken from Seadatanet's H03 library (https://vocab.seadatanet.org/v_bodc_vocab_v2/search.asp?lib=H03 ). Different protocols with different degrees of precision were used to classify the sampled micro-litters. Consequently, on the map, the distribution of micro-litter in the size classes depends on the protocol applied during the survey. Warning: the absence of data on the map does not necessarily mean that they do not exist, but that no information has been entered in the National Oceanographic Data Centre (NODC) for this area.
-
This visualization product displays the spatial distribution of the sampling effort (based on the start position of the sampling tow) over the six-years' period 2017-2022 from other specific protocols. EMODnet Chemistry included the collection of marine litter in its 3rd phase. Before 2021, there was no coordinated effort at the regional or European scale for micro-litter. Given this situation, EMODnet Chemistry proposed to adopt the data gathering and data management approach as generally applied for marine data, i.e., populating metadata and data in the CDI Data Discovery and Access service using dedicated SeaDataNet data transport formats. EMODnet Chemistry is currently the official EU collector of micro-litter data from Marine Strategy Framework Directive (MSFD) National Monitoring activities (descriptor 10). A series of specific standard vocabularies or standard terms related to micro-litter have been added to SeaDataNet NVS (NERC Vocabulary Server) Common Vocabularies to describe the micro-litter. European micro-litter data are collected by the National Oceanographic Data Centres (NODCs). Micro-litter map products are generated from NODCs data after a test of the aggregated collection including data and data format checks and data harmonization. A filter is applied to represent only micro-litter samplings carried out according to a very specific protocol such as the Volvo Ocean Race (VOR) or Oceaneye. The spatial distribution was then determined by calculating the number of times each cell was sampled during the period 2017-2022, only taking into account the start position of the tows. The corresponding total distance (kms) sampled in each cell is also provided in the attribute table. Information on data processing and calculation are detailed in the attached methodology document. Warning: the absence of data on the map does not necessarily mean that they do not exist, but that no information has been entered in the National Oceanographic Data Centre (NODC) for this area. This work is based on the work presented in the following scientific article: O. Gerigny, M. Brun, M.C. Fabri, C. Tomasino, M. Le Moigne, A. Jadaud, F. Galgani, Seafloor litter from the continental shelf and canyons in French Mediterranean Water: Distribution, typologies and trends, Marine Pollution Bulletin, Volume 146, 2019, Pages 653-666, ISSN 0025-326X, https://doi.org/10.1016/j.marpolbul.2019.07.030.