 Catalogue PIGMA
0.1 degree
Type of resources
Available actions
Topics
Keywords
Contact for the resource
Provided by
Years
Formats
Representation types
Update frequencies
status
Resolution
-
Moving 6-year analysis of Water body phosphate in the NorthEast Atlantic for each season: - winter: January-March, - spring: April-June, - summer: July-September, - autumn: October-December. Every year of the time dimension corresponds to the 6-year centred average of each season. 6-year periods span from 1950/1955 until 2016/2021. Observation data span from 1950 to 2021. Depth levels (IODE standard depths): [0.0, 5.0, 10.0, 20.0, 30.0, 40.0, 50.0, 75.0, 100.0, 125.0, 150.0, 200.0, 250.0, 300.0, 400.0, 500.0, 600.0, 700.0, 800.0, 900.0, 1000.0, 1100.0, 1200.0, 1300.0, 1400.0, 1500.0, 1750.0, 2000.0]. Data sources: observational data from SeaDataNet/EMODNet Chemistry Data Network. Descrption of DIVAnd analysis: the computation was done with DIVAnd (Data-Interpolating Variational Analysis in n dimensions), version 2.7.4, using GEBCO 30 sec topography for the spatial connectivity of water masses. The horizontal resolution of the produced DIVAnd maps is 0.1 degrees. Horizontal correlation length varies from 250km in open sea regions to 50km at the coast. Vertical correlation length is defined as twice the vertical resolution. Signal-to-noise ratio was fixed to 1 for vertical profiles and 0.1 for time series to account for the redundancy in the time series observations. A logarithmic transformation (DIVAnd.Anam.loglin) was applied to the data prior to the analysis to avoid unrealistic negative values. Background field: a vertically-filtered profile of the seasonal data mean value (including all years) is substracted from the data. Detrending of data: no, advection constraint applied: no. Units: umol/l.
-
Combined product of Water body dissolved oxygen concentration based on DIVA 4D 10-year analysis on five regions : Northeast Atlantic Ocean, North Sea, Baltic Sea, Black Sea, Mediterranean Sea. The boundaries and overlapping zones between these five regions were filtered to avoid any unrealistic spatial discontinuities. This combined water body dissolved oxygen concentration product is masked using the relative error threshold 0.5. Units: umol/l
-
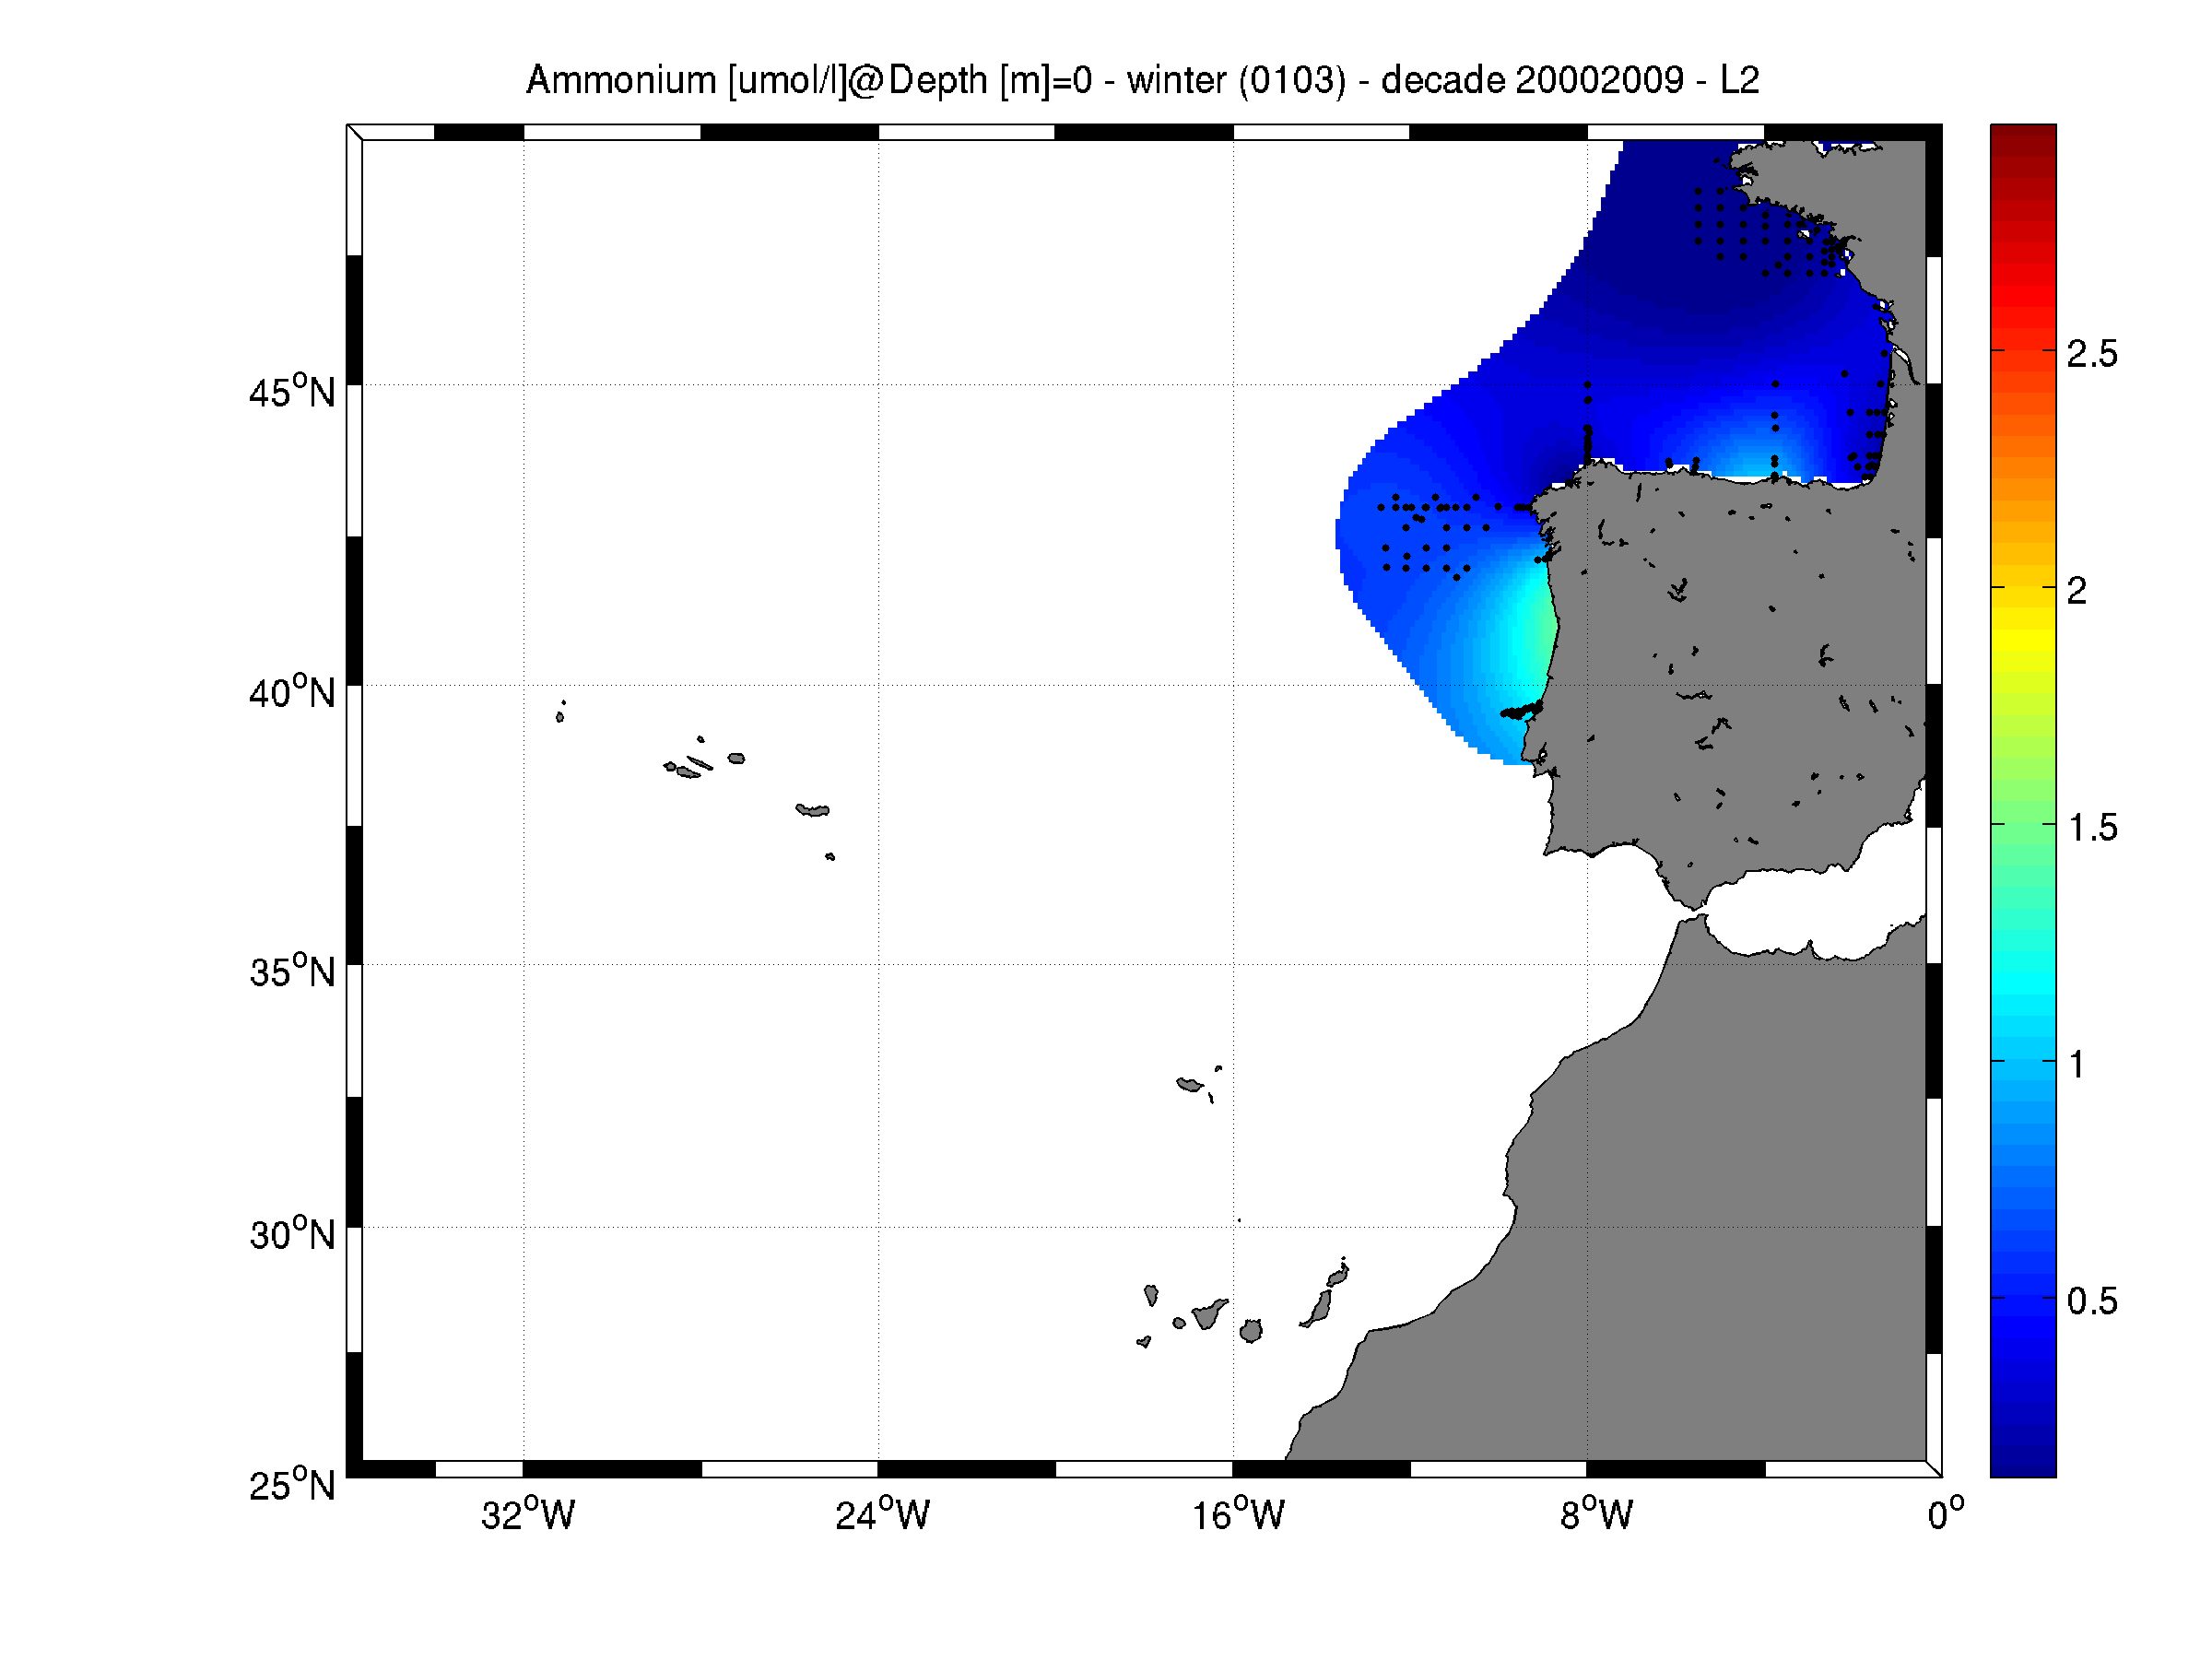
Moving 10-years analysis of Ammonium at Northeast Atlantic Ocean for each season: - winter: January-March, - spring: April-June, - summer: July-September, - autumn: October-December. Every year of the time dimension corresponds to the 10-year centred average of each season. Decades span : - from 1984-1993 until 2005-2014 (winter) - from 1980-1989 until 2005-2014 (spring) - from 1980-1989 until 2005-2014 (summer) - from 1980-1989 until 2005-2014 (autumn) Observational data span from 1962 to 2014. Depth range (IODE standard depths): -3000.0, -2500.0, -2000.0, -1750, -1500.0, -1400.0, -1300.0, -1200.0, -1100.0, -1000.0, -900.0, -800.0, -700.0, -600.0, -500.0, -400.0, -300.0, -250.0, -200.0, -150.0, -125.0, -100.0, -75.0, -50.0,-40.0, -30.0, -20.0, -10.0, -5.0, -0.0 Data Sources: observational data from SeaDataNet/EMODNet Chemistry Data Network. Description of DIVA analysis: Geostatistical data analysis by DIVA (Data-Interpolating Variational Analysis) tool. GEBCO 1min topography is used for the contouring preparation. Analyzed filed masked using relative error threshold 0.3 and 0.5 DIVA settings. Signal to noise ratio and correlation length were optimized and filtered vertically and a seasonally-averaged profile was used. Logarithmic transformation applied to the data prior to the analysis. Background field: the data mean value is subtracted from the data. Detrending of data: no, Advection constraint applied: no. Units: umol/l
-
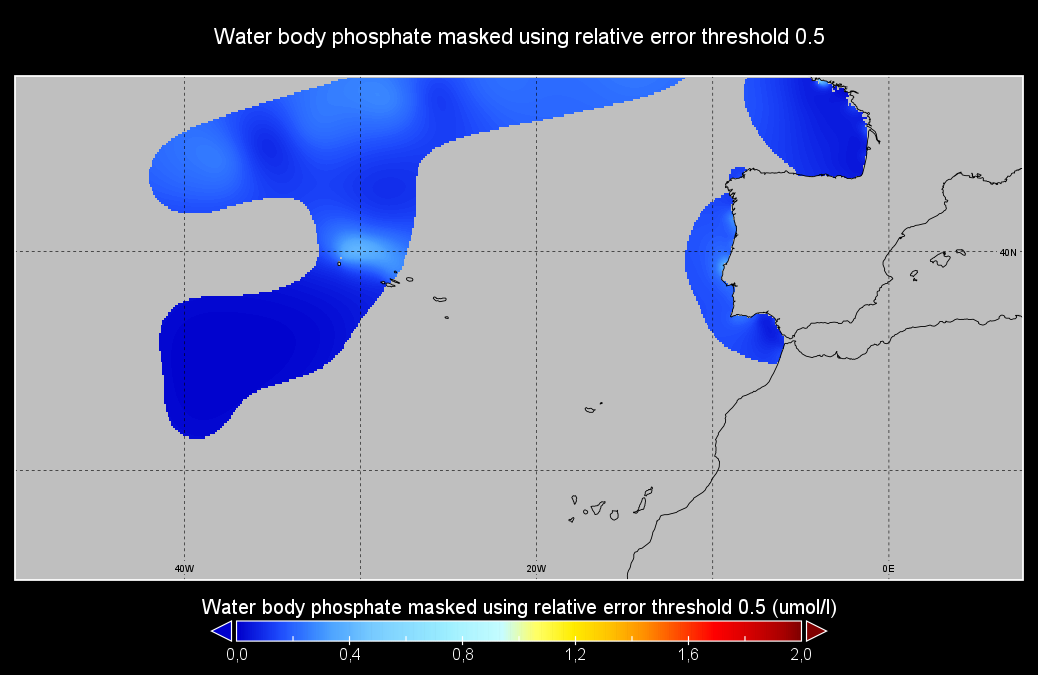
The analysis was performed per season using DIVA software tool (Data-Interpolating Variational Analysis). The analyses products are stored as NetCDF CF files and made available as WMS layers for easy browsing and adding. Every step of the time dimension corresponds to a 6-year moving average from 1983 to 2016. The depth dimension spans from surface to 1000 m, with 21 vertical levels. The boundaries and overlapping zones between these regions were filtered to avoid any unrealistic spatial discontinuities. This combined water body dissolved oxygen concentration product is masked using the relative error threshold 0.5. Units: µmol/l Created by 'University of Liège, GeoHydrodynamics and Environment Research (ULiège-GHER)'. The data used as input for DIVA have been extracted from the EMODnet Chemistry Download Service: https://emodnet-chemistry.maris.nl/search Intermediate regional data products: Mediterranean Sea - DIVA 4D 6-year analysis of Water body phosphate 1968/2016 v2018, Arctic Ocean - DIVA 4D 6-year analysis of Water body phosphate 1980/2017 v2018, North Sea - DIVA 4D 6-year analysis of Water body phosphate 1980/2017 v2018, Black Sea - DIVA 4D 6-year analysis of Water body phosphate 1990/2016 v2018, North East Atlantic Ocean - DIVA 4D 6-year analysis of Water body phosphate 1960/2017 v2018, Baltic Sea - DIVA 4D 6-year analysis of Water body phosphate 1980/2016 v2018
-
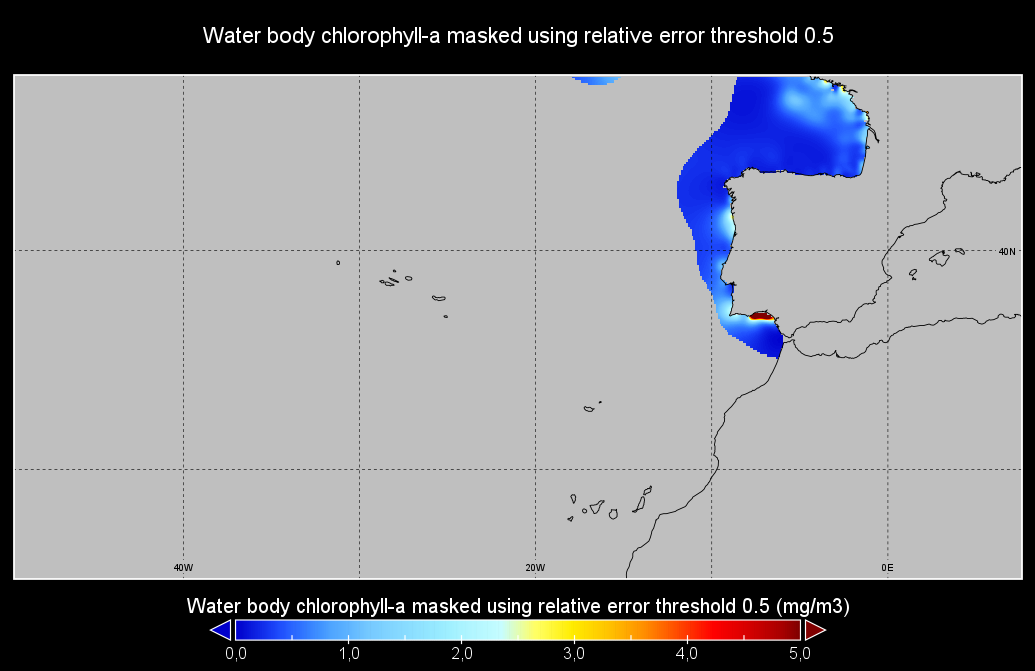
Moving 6-year analysis of Water body chlorophyll-a in the NorthEast Atlantic for each season: - winter: January-March, - spring: April-June, - summer: July-September, - autumn: October-December. Every year of the time dimension corresponds to the 6-year centred average of each season. 6-year periods span from 1971/1976 until 2016/2021. Observation data span from 1971 to 2021. High-frequency observation trails were filtered to a 3h temporal resolution. Depth levels (IODE standard depths): [0.0, 5.0, 10.0, 20.0, 30.0, 40.0, 50.0, 75.0, 100.0, 125.0, 150.0, 200.0, 250.0, 300.0]. Data sources: observational data from SeaDataNet/EMODNet Chemistry Data Network. Descrption of DIVAnd analysis: the computation was done with DIVAnd (Data-Interpolating Variational Analysis in n dimensions), version 2.7.4, using GEBCO 30 sec topography for the spatial connectivity of water masses. The horizontal resolution of the produced DIVAnd maps is 0.1 degrees. Horizontal correlation length varies from 200km in open sea regions to 50km at the coast. Vertical correlation length is defined as twice the vertical resolution. Signal-to-noise ratio was fixed to 1 for vertical profiles and 0.1 for time series to account for the redundancy in the time series observations. A logarithmic transformation (DIVAnd.Anam.loglin) was applied to the data prior to the analysis to avoid unrealistic negative values. Background field: a vertically-filtered profile of the seasonal data mean value (including all years) is substracted from the data. Detrending of data: no, advection constraint applied: no. Units: mg/m3.
-
A Group for High Resolution Sea Surface Temperature (GHRSST) Level 4 sea surface temperature (SST) analysis produced daily on an operational basis at the Canadian Meteorological Center. This dataset merges infrared satellite SST at varying points in the time series from the Advanced Very High Resolution Radiometer (AVHRR) from NOAA-18,19, the European Meteorological Operational-A (METOP-A) and Operational-B (METOP-B), and microwave data from the Advanced Microwave Scanning Radiometer 2 (AMSR2) onboard the GCOM-W satellite in conjunction with in situ observations of SST from drifting buoys and ships from the ICOADS program. It uses the previous days analysis as the background field for the statistical interpolation used to assimilate the satellite and in situ observations. This dataset adheres to the GHRSST Data Processing Specification (GDS) version 2 format specifications. Version Description:
-
A Group for High Resolution Sea Surface Temperature (GHRSST) Level 4 sea surface temperature analysis produced daily on an operational basis at the Naval Oceanographic Office (NAVOCEANO) on a global 0.1 degree grid. The K10 L4 sea surface temperature analysis uses SST observations from the Advanced Very High Resolution Radiometer (AVHRR), the Advanced Microwave Scanning Radiometer for EOS (AMSR-E), and the Geostationary Operational Environmental Satellite (GOES) Imager. The age, reliability, and resolution of the data are used in the weighted average with the analysis tuned to represent SST at 1 meter depth. AVHRR Pathfinder 9km climatology is used when no new satellite SST retrievals are available after 34 days.
-
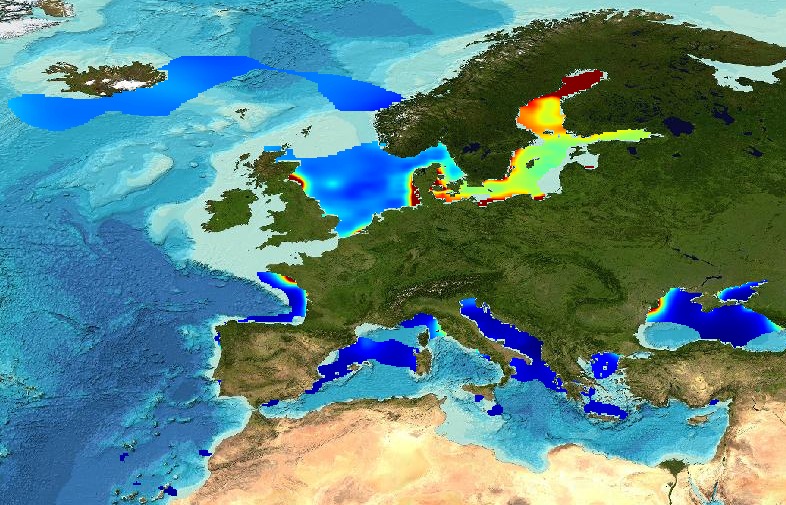
Combined product of Water body chlorophyll a based on DIVA 4D 10-year analysis on five regions : Northeast Atlantic Ocean, North Sea, Baltic Sea, Black Sea, Mediterranean Sea. The boundaries and overlapping zones between these five regions were filtered to avoid any unrealistic spatial discontinuities. This combined Water body chlorophyll a product is masked using the relative error threshold 0.5. Units: mg/m^3. Created by 'University of Liege, GeoHydrodynamics and Environment Research (ULg-GHER)'.
-
The analysis was performed per season using DIVA software tool (Data-Interpolating Variational Analysis). The analyses products are stored as NetCDF CF files and made available as WMS layers for easy browsing and adding. Every step of the time dimension corresponds to a 6-year moving average from 1983 to 2016. The depth dimension spans from surface to 1000 m, with 21 vertical levels. The boundaries and overlapping zones between these regions were filtered to avoid any unrealistic spatial discontinuities. This combined water body dissolved oxygen concentration product is masked using the relative error threshold 0.5. Units: µmol/l Created by 'University of Liège, GeoHydrodynamics and Environment Research (ULiège-GHER)'. The data used as input for DIVA have been extracted from the EMODnet Chemistry Download Service: https://emodnet-chemistry.maris.nl/search Intermediate regional data products: Mediterranean Sea - DIVA 4D 6-year analysis of Water body silicate 1965/2016 v2018, Arctic Ocean - DIVA 4D 6-year analysis of Water body silicate 1980/2017 v2018, North Sea - DIVA 4D 6-year analysis of Water body silicate 1980/2017 v2018, Black Sea - DIVA 4D 6-year analysis of Water body silicate 1990/2016 v2018, North East Atlantic Ocean - DIVA 4D 6-year analysis of Water body silicate 1971/2017 v2018
-
This is a Group for High Resolution Sea Surface Temperature (GHRSST) Level 4 sea surface temperature (SST) analysis dataset produced daily on an operational basis by the Naval Oceanographic Office (NAVO) on a global 0.1x0.1 degree grid. The K10 (NAVO 10-km gridded SST analyzed product) L4 analysis uses SST observations from the following instruments: Advanced Very High Resolution Radiometer (AVHRR), Visible Infrared Imaging Radiometer Suite (VIIRS), and Spinning Enhanced Visible and InfraRed Imager (SEVIRI). The AVHRR data for this comes from the MetOp-A, MetOp-B, and NOAA-19 satellites; VIIRS data is sourced from the Suomi_NPP satellite; SEVIRI data comes from the Meteosat-8 and -11 satellites. The age (time-lag), reliability, and resolution of the data are used in the weighted average with the analysis tuned to represent SST at a reference depth of 1-meter. Input data from the AVHRR Pathfinder 9km climatology dataset (1985-1999) is used when no new satellite SST retrievals are available after 34 days. Comparing with its predecessor (DOI: https://doi.org/10.5067/GHK10-L4N01 ), this updated dataset has no major changes in Level-4 interpolated K10 algorithm, except for using different satellite instrument data, and updating metadata and file format. The major updates include: (a) updated and enhanced the granule-level metadata information, (b) converted the SST file from GHRSST Data Specification (GDS) v1.0 to v2.0, (c) added the sea_ice_fraction variable to the product, and (d) updated the filename convention to reflect compliance with GDS v2.0. Version Description: