 Catalogue PIGMA
25 km
Type of resources
Available actions
Topics
Keywords
Contact for the resource
Provided by
Years
Formats
Representation types
Update frequencies
status
Scale
Resolution
-
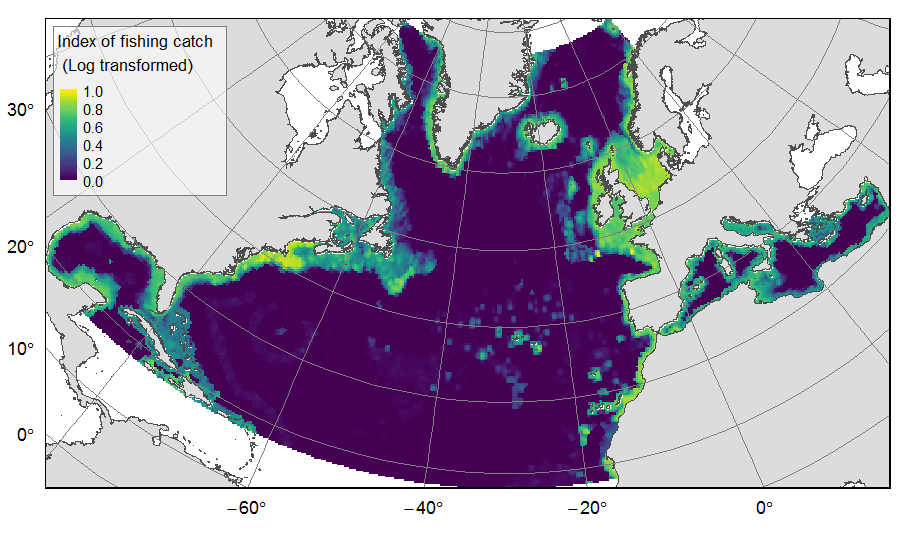
Distribution of catch from deep-sea impacting fishing on the North Atlantic (18°N to 76°N and 36°E to 98°W), for the period 2010-2015. The average of yearly fishing catch for the period 2010-2015 is displayed as an index on the ATLAS grid of 25km * 25km resolution. Source data originated from the Global Fisheries Landings V4.0 database. The dataset was filtered to select only the fishing gears that have an impact on large areas of the seafloor (dredges, bottom trawls, and Danish seines). Within each cell, all remaining catch records were summed to get the total catch rate of the considered year. This dataset was built to feed a basin-wide spatial conservation planning exercise, targeting the deep sea of the North Atlantic. The goal of this approach was to identify conservation priority areas for Vulnerable Marine Ecosystems (VMEs) and deep fish species, based on the distribution of species and habitats, human activities and current spatial management.
-
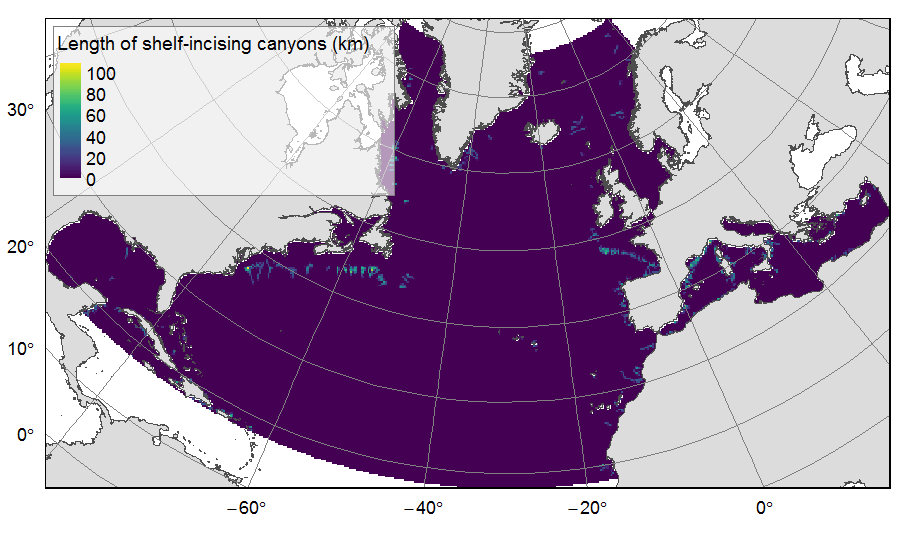
Distribution of three geomorphologic features (fracture zones, canyons, and seamounts) on the North Atlantic (18°N to 76°N and 36°E to 98°W). Source vector data originated from the GEBCO Gazetteer of Undersea Features Names for fractures, Harris & Whiteway (2011) for canyons, and Yesson et al. (2011) for seamounts. The presence (value=1) of fracture zones or seamounts and the total length of canyons (in km, independently for shelf-incising or blind canyons) was extracted in 25km * 25km gridsquares. This dataset was built to feed a basin-wide spatial conservation planning exercise, targeting the deep sea of the North Atlantic. The goal of this approach was to identify conservation priority areas for Vulnerable Marine Ecosystems (VMEs) and deep fish species, based on the distribution of species and habitats, human activities and current spatial management.
-
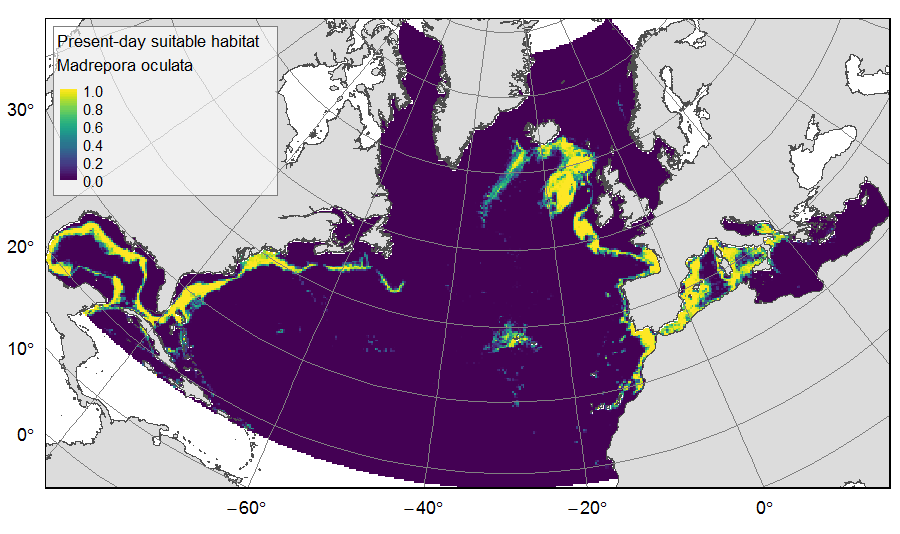
Distribution of predicted suitable habitat for six cold-water-coral, six deep-water fish and one sponge species, on the North Atlantic (18°N to 76°N and 36°E to 98°W). For each species, predicted habitat distribution was obtained for present-day conditions (1951-2000) and for the future climate refugias, i.e. the areas that were predicted as suitable both for present-day and forecasted future (2081-2010) conditions. The dataset gathers 26 raster layers created on the same grid of 25km * 25km resolution, downgraded from source layers (3km *3km resolution) that were created within the work package 3 of EU ATLAS project. The presence (value=1) of climate refugia and the relative cover (value ranging from 0 to 1) of present-day suitable habitat was extracted in gridsquares. This dataset was built to feed a basin-wide spatial conservation planning exercise, targeting the deep sea of the North Atlantic. The goal of this approach was to identify conservation priority areas for Vulnerable Marine Ecosystems (VMEs) and deep fish species, based on the distribution of species and habitats, human activities and current spatial management.
-
The SWISCA Level 2S (L2S) product provides along-track colocation of SWIM wave measuring instrument onto SCAT scatterometer grid, over the global ocean. SWIM and SCAT are both instruments onboard CFOSAT. CFOSAT (Chinese French Ocean SATellite) is a french-chinese mission launched in 2018, whose aim is to provide wind (SCAT instrument) and wave (SWIM instrument) measurements over the sea surface. The SWISCA L2S product is broken down into three different subproducts: - L2A containing the sigma0 of both SWIM and SCAT - L2B containing the wave parameters measured by SWIM and wind vectors measured by SCAT - AUX containing additional ancillary fields such as sea ice concentration (from CERSAT/SSMI), ocean currents (from CMEMS/GlobCurrent), SST and Wind (from ECMWF), rain rate (from IMERG), and WaveWatch3 wave spectra. All SWIM and ancillary observations are resampled onto SCAT scatterometer's geometry (wind vector cells, WVC). The SWISCA level 2S product is generated in delayed mode, a few days after acquisition. It is intended to foster cross analysis of SWIM and SCAT observations, and their combination to improve the retrieval of both wind and wave parameters. The SWISCA L2S product is generated and distributed by Ifremer / CERSAT in the frame of the Ifremer Wind and Wave Operation Center (IWWOC) co-funded by Ifremer and CNES and dedicated to the processing of the delayed mode data of CFOSAT mission.
-
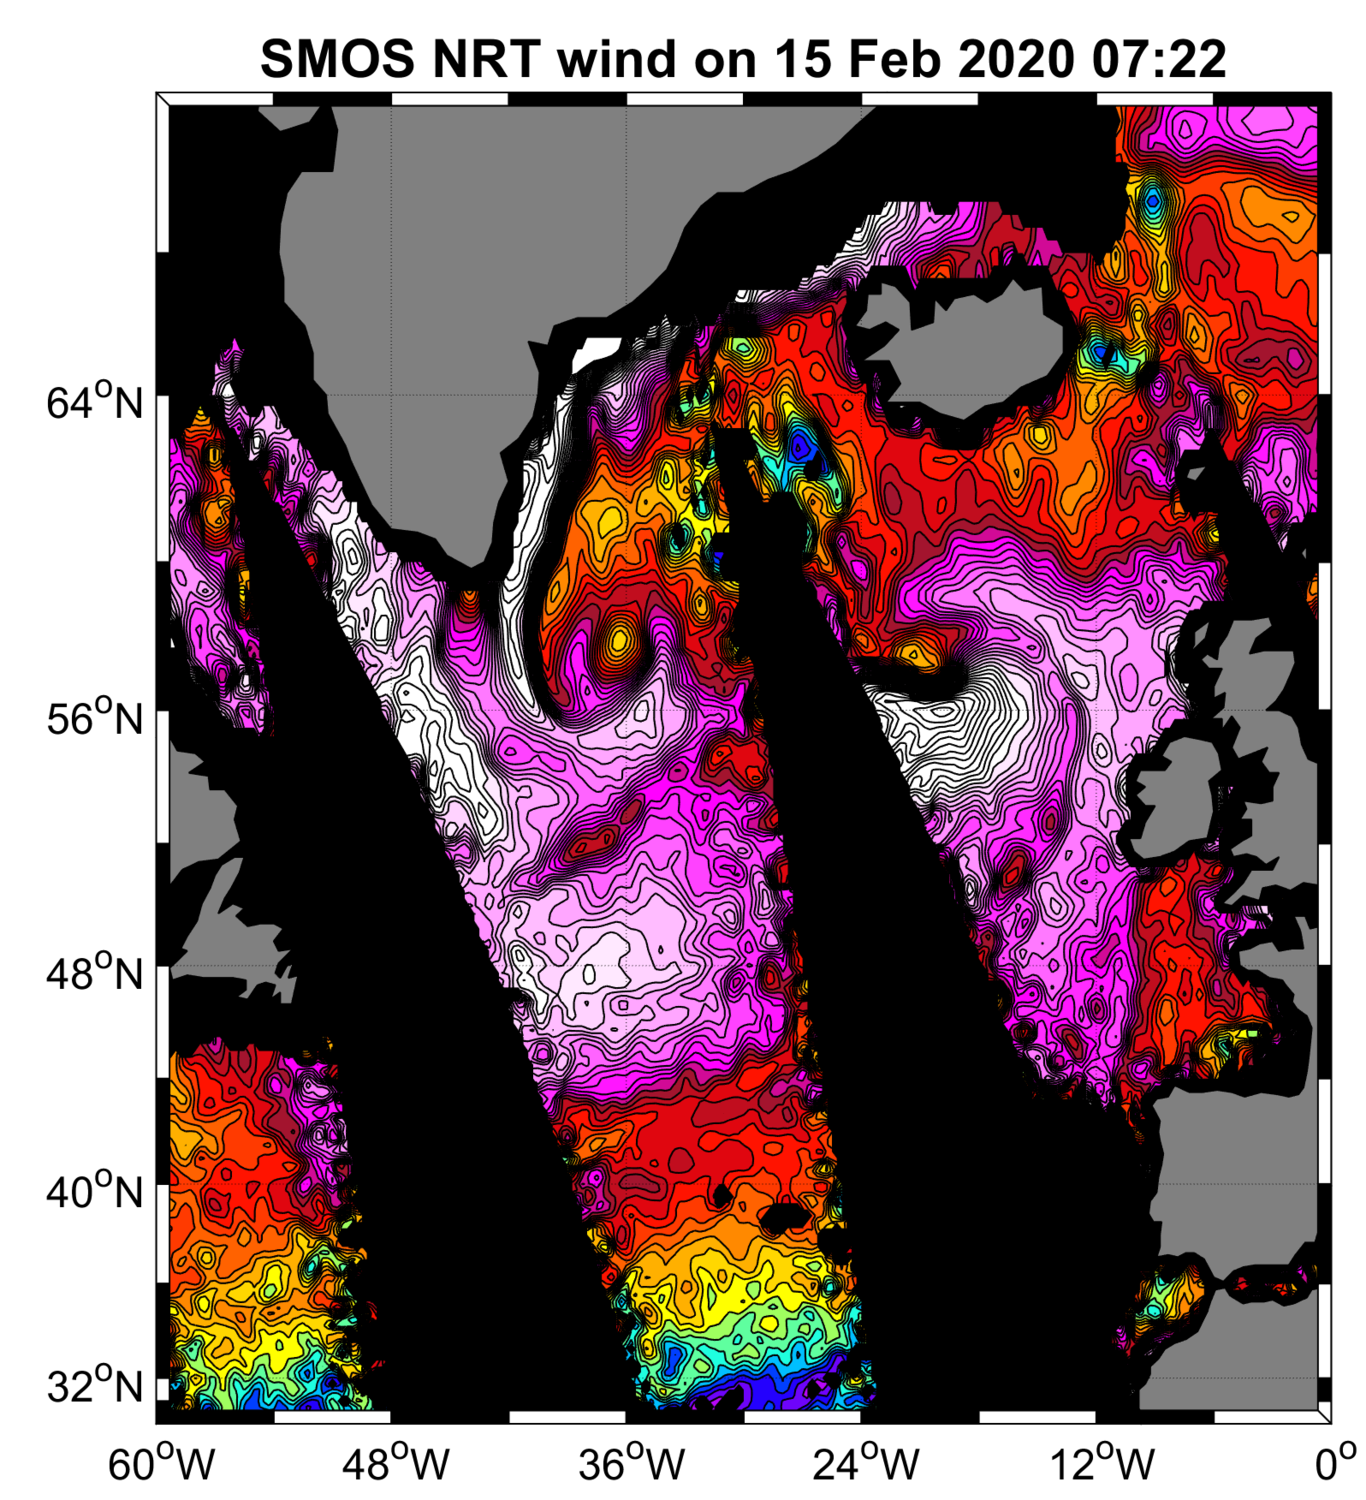
“SMOS Near Real Time Level 2 swath wind speed” (SMOS L2WS NRT) products, which are SMOS retrieved surface wind speed gridded maps with a spatial sampling of 1/4°x 1/4° and consisting of orbital segments (containing parts of ascending and descending half orbits) following the granularity of the SMOS Level 1B near real time (NRT) data products. SMOS L2WS NRT products are available within 4 to 6 hours from sensing and are generated in NetCDF-4 format as described in the "SMOS Wind Data Service Product Description Document" (http://www.smosstorm.org/Document-tools/SMOS-Wind-Data-Service-Documentation).
-

This product provides a “Final” (Refined) Level-2 Sea Surface Temperature (SST) (currently identified by "v8.2" within the file name) for the Group for High Resolution Sea Surface Temperature (GHRSST) Project, which is derived from the Advanced Microwave Scanning Radiometer 2 (AMSR2) by Remote Sensing Systems (RSS, or REMSS). AMSR2 was launched on 18 May 2012, onboard the Global Change Observation Mission - Water (GCOM-W) satellite developed by the Japan Aerospace Exploration Agency (JAXA). The GCOM-W mission aims to establish the global and long-term observation system to collect data, which is needed to understand mechanisms of climate and water cycle variations, and demonstrate its utilization. AMSR2 onboard the first generation of the GCOM-W satellite will continue Aqua/AMSR-E observations of water vapor, cloud liquid water, precipitation, SST, sea surface wind speed, sea ice concentration, snow depth, and soil moisture. AMSR2 is a remote sensing instrument for measuring weak microwave emission from the surface and the atmosphere of the Earth. The antenna of AMSR2 rotates once per 1.5 seconds and obtains data over a 1450 km swath. This conical scan mechanism enables AMSR2 to acquire a set of daytime and nighttime data with more than 99% coverage of the Earth every 2 days. The “Final” SSTs are processed when RSS receives the atmospheric model National Center for Environmental Prediction (NCEP) Final Analysis (FNL) Operational Global Analysis. The NCEP wind directions are particularly useful for retrieving more accurate SSTs and wind speeds.
-
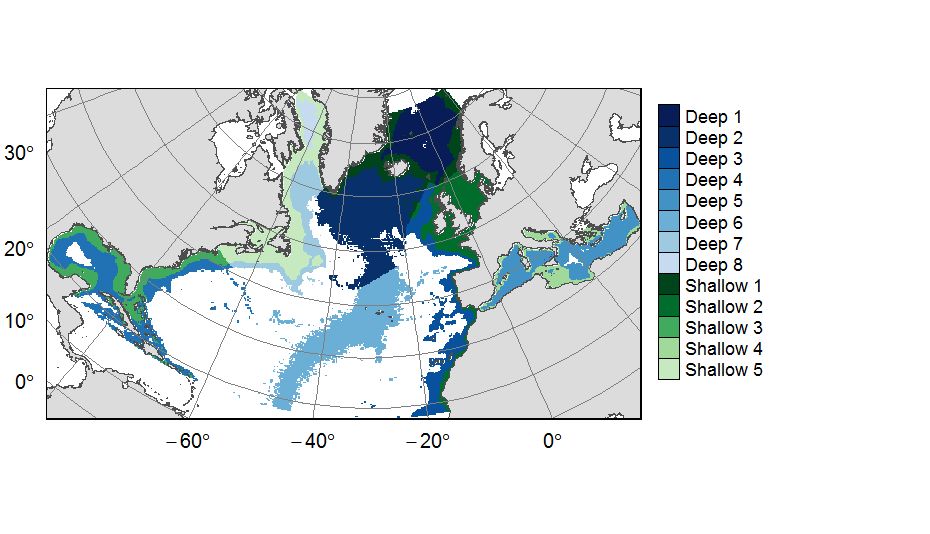
Planning units layers used for ATLAS EU prioritization scenarios on the North Atlantic (18°N to 76°N and 36°E to 98°W). This raster layer is designed on a grid of 25km * 25km resolution, that served to extract all the spatial data used prioritization. The 31 518 planning units (cells with value) corresponded to areas containing depths shallower or equal to 3500m, even if they could also contain deeper areas locally. For connectivity scenarios, only the planning units matching with the extent of available connectivity data were selected. One layer allocates planning units to the 13 geographical provinces (values ranging from 1 to 13) created for the purpose of prioritization. This dataset was built to feed a basin-wide spatial conservation planning exercise, targeting the deep sea of the North Atlantic. The goal of this approach was to identify conservation priority areas for Vulnerable Marine Ecosystems (VMEs) and deep fish species, based on the distribution of species and habitats, human activities and current spatial management.
-
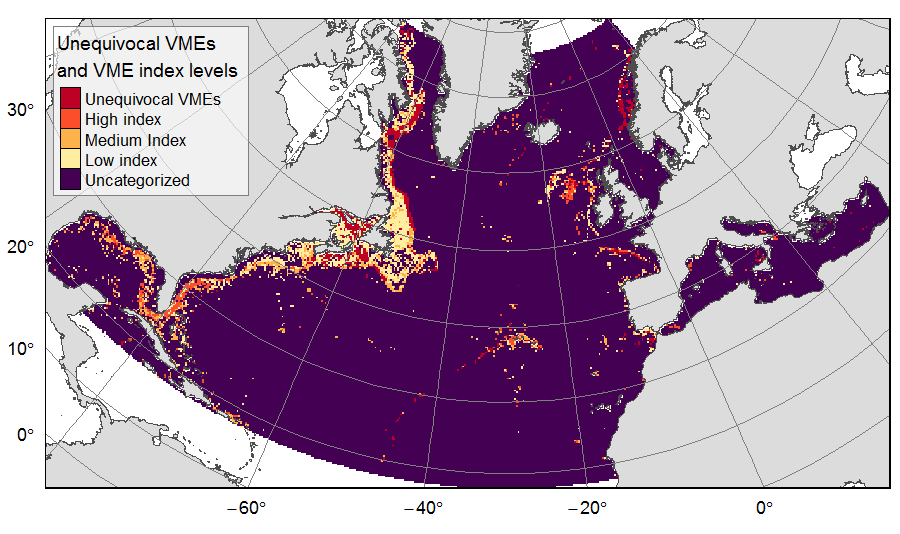
Distribution of unequivocal Vulnerable Marine Ecosystems (VMEs) and VME likelihood based on indicator taxa records, on the North Atlantic (18°N to 76°N and 36°E to 98°W). Several datasets, originating from public databases, literature review and data call to ATLAS partners, were gathered to compute the presence of unequivocal VME habitats in 25km * 25 km cells for the ATLAS work package 3. One layer displays the unequivocal VMEs (value=4) and the assigned high (value=3), medium (value=2) or low (value=1) likelihood of gridsquares to host VMEs, indexed on indicator taxa records from public databases with the method detailed in Morato et al (2018). The second displays the confidence associated to the VME likelihood score, indexed on data quality as detailed in Morato et al (2018) (values for unequivocal VMEs thus 100% confidence=4; high confidence=3; medium confidence=2; low confidence=1). This dataset was built to feed a basin-wide spatial conservation planning exercise, targeting the deep sea of the North Atlantic. The goal of this approach was to identify conservation priority areas for Vulnerable Marine Ecosystems (VMEs) and deep fish species, based on the distribution of species and habitats, human activities and current spatial management.
-

-
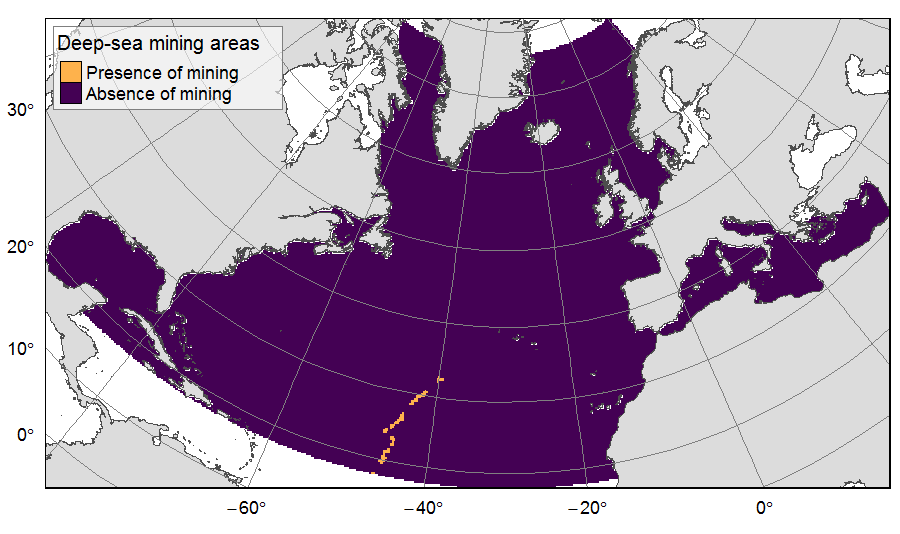
Presence of deep-sea mining exploration zones on the North Atlantic (18°N to 76°N and 36°E to 98°W). These areas correspond to the three polymetallic sulphides exploration contracts on the Mid-Atlantic Ridge, attributed to Poland, France and Russia. Each of the three contract areas is divided into 100 squares of 10km by 10km. Source polygons originated from the International Seabed Authority. The presence (value=1) of deep-sea mining was extracted in 25km * 25km gridsquares. This dataset was built to feed a basin-wide spatial conservation planning exercise, targeting the deep sea of the North Atlantic. The goal of this approach was to identify conservation priority areas for Vulnerable Marine Ecosystems (VMEs) and deep fish species, based on the distribution of species and habitats, human activities and current spatial management.