 Catalogue PIGMA
2015
Type of resources
Available actions
Topics
Keywords
Contact for the resource
Provided by
Years
Formats
Representation types
Update frequencies
status
Service types
Scale
Resolution
-

The vision of the AtlantOS project was to improve and innovate Atlantic observing by using the Framework of Ocean Observing to obtain an international, more sustainable, more efficient, more integrated, and fit-for-purpose system contributing to the Trans-Atlantic Research Alliance, the GEO (Group on Earth Observations) global initiative Blue Planet, and GOOS (Global Ocean Observing Systems). Hence, the AtlantOS project will have a long-lasting and sustainable contribution to the societal, economic and scientific benefit arising from this integrated approach. This will be achieved by improving the value for money, extent, completeness, quality and ease of access to Atlantic Ocean data required by industries, product supplying agencies, scientists and citizens. The overarching target of the AtlantOS initiative was to deliver an advanced framework for the development of an integrated Atlantic Ocean Observing System that goes beyond the state-of–the-art, and leaves a legacy of sustainability after the life of the project (see AtlantOS High-Level Strategy and find out more about the AtlantOS program). The legacy derived from the AtlantOS aims: - to improve international collaboration in the design, implementation and benefit sharing of ocean observing, - to promote engagement and innovation in all aspects of ocean observing, - to facilitate free and open access to ocean data and information, - to enable and disseminate methods of achieving quality and authority of ocean information, - to strengthen the Global Ocean Observing System (GOOS) and to sustain observing systems that are critical for the Copernicus Marine Environment Monitoring Service and its applications and - to contribute to the aims of the Galway Statement on Atlantic Ocean Cooperation The project was organized along work packages on: i) observing system requirements and design studies, ii) enhancement of ship-based and autonomous observing networks, iii) interfaces with coastal ocean observing systems, iv) integration of regional observing systems, v) cross-cutting issues and emerging networks, vi) data flow and data integration, vii) societal benefits from observing /information systems, viii) system evaluation and resource sustainability. Engagement with wider stakeholders including end-users of Atlantic Ocean observation products and services was also key throughout the project. The AtlantOS initiative contributed to achieving the aims of the Galway Statement on Atlantic Ocean Cooperation that was signed in 2013 by the EU, Canada and the US, launching a Transatlantic Ocean Research Alliance to enhance collaboration to better understand the Atlantic Ocean and sustainably manage and use its resources.
-
Specification of the desirable and recommended product attributes for generating spatial layers of annual avergae internal energy for the last 20 years.
-
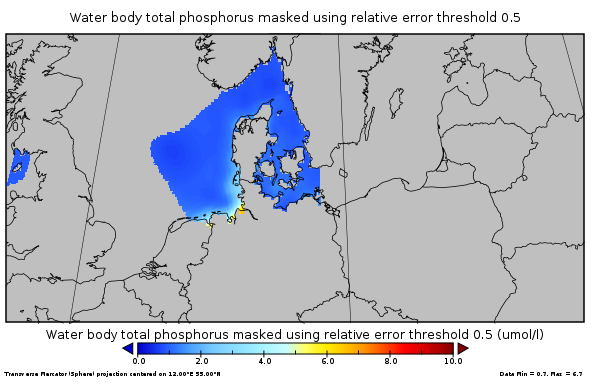
This gridded product visualizes 1960 - 2014 water body total phosphorus concentration (umol/l) in the North Sea domain, for each season (winter: December – February; spring: March – May; summer: June – August; autumn: September – November). It is produced as a Diva 4D analysis, version 4.6.11: a reference field of all seasonal data between 1960-2014 was used; results were logit transformed to avoid negative/underestimated values in the interpolated results; error threshold masks L1 (0.3) and L2 (0.5) are included as well as the unmasked field. Every step of the time dimension corresponds to a 10-year moving average for each season. The depth dimension allows visualizing the gridded field at various depths.
-
.jpg)
The Sir Alister Hardy Foundation for Ocean Science (SAHFOS) is an international charity that operates the Continuous Plankton Recorder (CPR) Survey. The dataset covers the North Atlantic and the North Sea on since 1958.
-

Le document présente l'Observatoire des Espaces Naturels, Agricoles, Forestiers et Urbains (NAFU), dispositif où l'Etat et la Région s'unissent pour donner les moyens de prévoir et d'agir
-
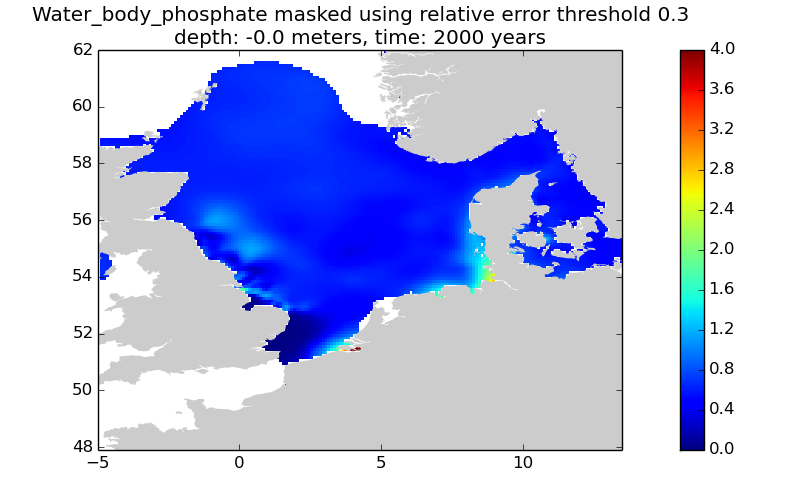
This gridded product visualizes 1960 - 2014 water body phosphate concentration (umol/l) in the North Sea domain, for each season (winter: December – February; spring: March – May; summer: June – August; autumn: September – November). It is produced as a Diva 4D analysis, version 4.6.9: a reference field of all seasonal data between 1960-2014 was used; results were logit transformed to avoid negative/underestimated values in the interpolated results; error threshold masks L1 (0.3) and L2 (0.5) are included as well as the unmasked field. Every step of the time dimension corresponds to a 10-year moving average for each season. The depth dimension allows visualizing the gridded field at various depths.
-

Première utilisation du sol, devant l'agriculture et loin devant l'urbanisme, la forêt couvre 45 % du territoire aquitain. La région se caractérise par la domination d'une essence, le pin maritime. Celui-ci couvre plus de la moitié de la surface forestière régionale. Outre sa valeur patrimoniale, cette forêt génère une activité économique qui représente environ 3 milliards d'euros. Ce secteur forêt-bois est donc un formidable gisement d'emplois, principalement en milieu rural. Cet espace occupé par la forêt attise néanmoins des convoitises pour différents types d'usage: l'urbanisation, les installations photovoltaïques ou encore l'agriculture.
-
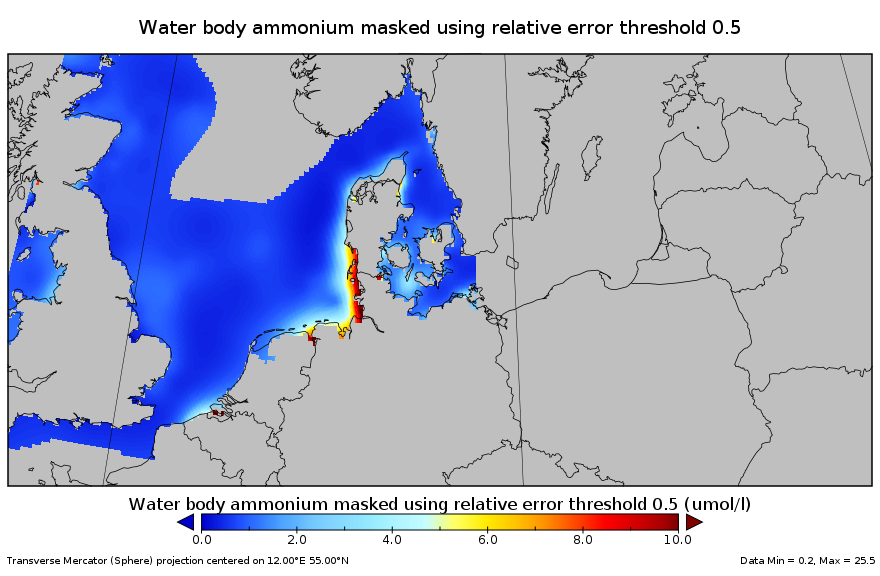
This gridded product visualizes 1960 - 2014 water body ammonium concentration (umol/l) in the North Sea domain, for each season (winter: December – February; spring: March – May; summer: June – August; autumn: September – November). It is produced as a Diva 4D analysis, version 4.6.9: a reference field of all seasonal data between 1960-2014 was used; results were logit transformed to avoid negative/underestimated values in the interpolated results; error threshold masks L1 (0.3) and L2 (0.5) are included as well as the unmasked field. Every step of the time dimension corresponds to a 10-year moving average for each season. The depth dimension allows visualizing the gridded field at various depths.
-
Description of attributes for time series of annual average sea level (units: mm) from tide gauges over periods of 50 years (1963-2012) and 100 years (1913-2012), to characterize and assess average annual sea-level rise relative to the land.
-
Specification of the desirable and recommended product attributes for generating time series of annual average sea level (units: mm) from tide gauges over periods of 50 years (1963-2012) and 100 years (1913-2012), to characterize and assess average annual sea-level rise relative to the land.