 Catalogue PIGMA
2021
Type of resources
Available actions
Topics
Keywords
Contact for the resource
Provided by
Years
Formats
Representation types
Update frequencies
status
Scale
Resolution
-
Seasonal Climatology of Silicate for Loire River for the period 1965-2019 and for the following seasons: - winter: January-March, - spring: April-June, - summer: July-September, - autumn: October-December Observational data span from 1965 to 2019. Depth levels (m): -125.0, -100.0, -75.0, -50.0,-40.0, -30.0, -25.0, -20.0, -15.0, -10.0, -8.0, -6.0, -4.0, -2.0, -0.0 Data Sources: observational data from SeaDataNet/EMODNet Chemistry Data Network. Description of DIVAnd analysis: The computation was done with the DIVAnd (Data-Interpolating Variational Analysis in n dimensions), version 2.7.4, using GEBCO 30sec topography for the spatial connectivity of water masses. The horizontal resolution of the produced DIVAnd maps grids is 0.01 degrees. Correlation length was optimized and filtered vertically and a seasonally-averaged profile was used. Signal to noise ratio was fixed to 1. Logarithmic transformation applied to the data prior to the analysis. Background field: the data mean value is subtracted from the data. The weight of time series was decreased by a factor of 10 relative to the weight of the profiles to account for the redundancy in the time series observations. Detrending of data: no, Advection constraint applied: no. Units: umol/l.
-
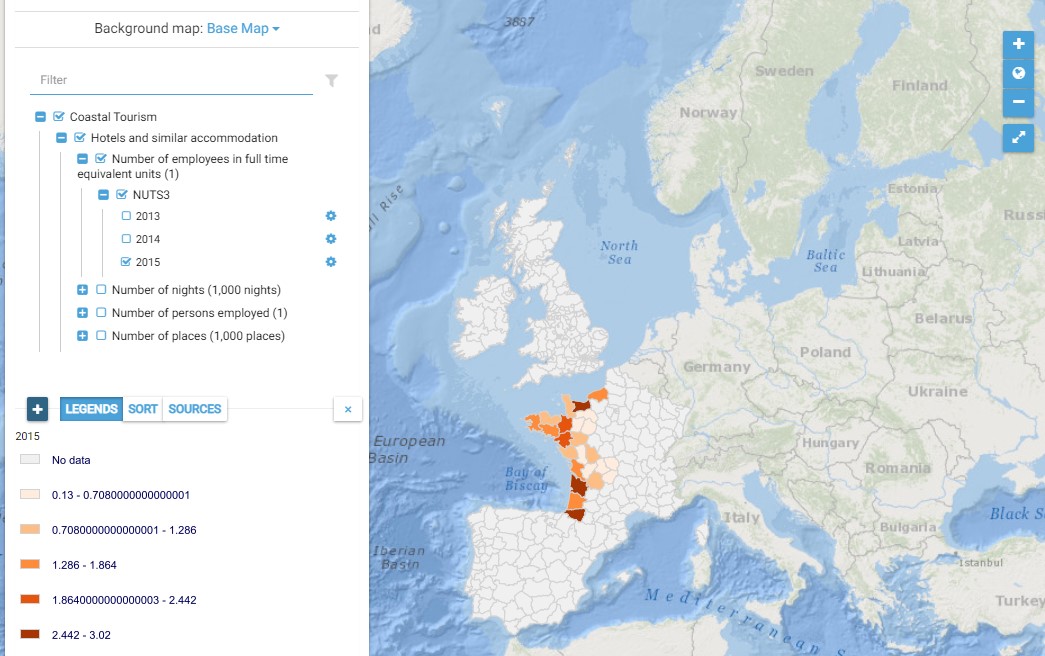
This map presents all layers corresponding to "Hotels and similar accommodation" activities in the Atlantic area. For more information about this NACE code : https://ec.europa.eu/eurostat/ramon/nomenclatures/index.cfm?TargetUrl=DSP_NOM_DTL_VIEW&StrNom=NACE_REV2&StrLanguageCode=EN&IntPcKey=18513734&IntKey=18513764&StrLayoutCode=HIERARCHIC&IntCurrentPage=1 Indicators collected are : Number of persons employed and number of employees in full time equivalent units per NUTS 3 unit of the Atlantic Area Number of nights per NUTS 3 unit of the Atlantic Area Number of places per NUTS 3 unit of the Atlantic Area
-
Water body dissolved oxygen concentration - Monthly Climatology for the European Seas for the period 1960-2020 on the domain from longitude -45.0 to 70.0 degrees East and latitude 24.0 to 83.0 degrees North. Data Sources: observational data from SeaDataNet/EMODnet Chemistry Data Network. Description of DIVA analysis: The computation was done with the DIVAnd (Data-Interpolating Variational Analysis in n dimensions), version 2.7.2, using GEBCO 30sec topography for the spatial connectivity of water masses. Horizontal correlation length and vertical correlation length vary spatially depending on the topography and domain. Depth range: 0.0, 5.0, 10.0, 15.0, 20.0, 25.0, 30.0, 35.0, 40.0, 45.0, 50.0, 55.0, 60.0, 65.0, 70.0, 75.0, 80.0, 85.0, 90.0, 95.0, 100.0, 125.0, 150.0, 175.0, 200.0, 225.0, 250.0, 275.0, 300.0, 325.0, 350.0, 375.0, 400.0, 425.0, 450.0, 475.0, 500.0, 550.0, 600.0, 650.0, 700.0, 750.0, 800.0, 850.0, 900.0, 950.0, 1000.0, 1050.0, 1100.0, 1150.0, 1200.0, 1250.0, 1300.0, 1350.0, 1400.0, 1450.0, 1500.0, 1550.0, 1600.0, 1650.0, 1700.0, 1750.0, 1800.0, 1850.0, 1900.0, 1950.0, 2000.0, 2100.0, 2200.0, 2300.0, 2400.0, 2500.0, 2600.0, 2700.0, 2800.0, 2900.0, 3000.0, 3100.0, 3200.0, 3300.0, 3400.0, 3500.0, 3600.0, 3700.0, 3800.0, 3900.0, 4000.0, 4100.0, 4200.0, 4300.0, 4400.0, 4500.0, 4600.0, 4700.0, 4800.0, 4900.0, 5000.0, 5100.0, 5200.0, 5300.0, 5400.0, 5500.0 m. Units: umol/l. The horizontal resolution of the produced DIVAnd analysis is 0.25 degrees.
-
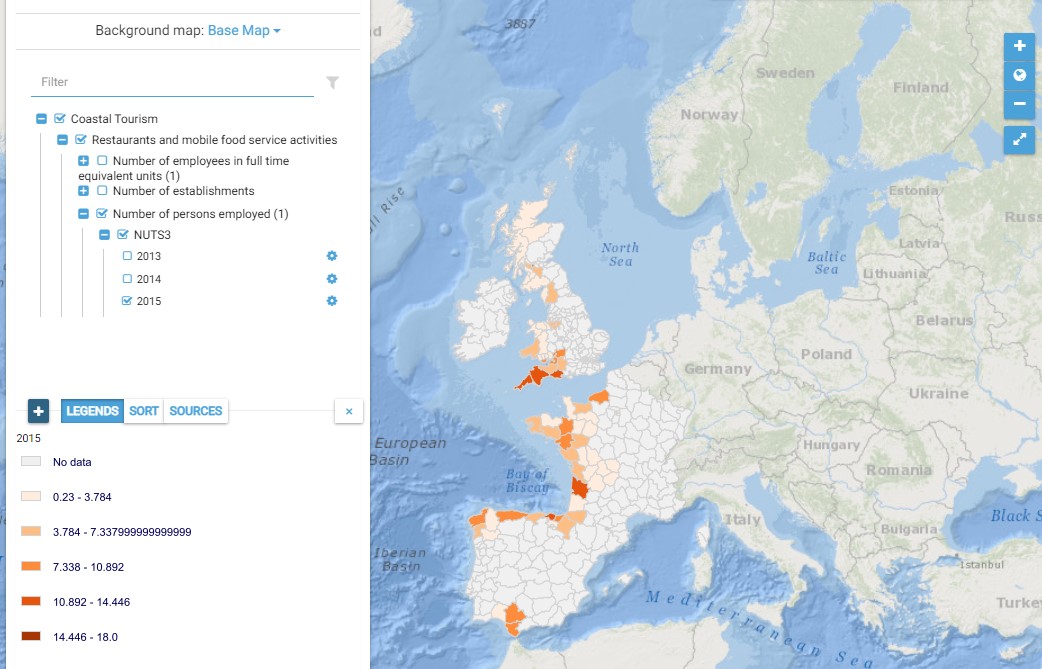
This map presents all layers corresponding to "Restaurants and mobile food service activities" activities in the Atlantic area. For more information about this NACE code : https://ec.europa.eu/eurostat/ramon/nomenclatures/index.cfm?TargetUrl=DSP_NOM_DTL_VIEW&StrNom=NACE_REV2&StrLanguageCode=EN&IntPcKey=18514004&IntKey=18514034&StrLayoutCode=HIERARCHIC&IntCurrentPage=1 Indicators collected are : Number of persons employed and number of employees in full time equivalent units per NUTS 3 unit of the Atlantic Area Number of establishments per NUTS3 unit of the Atlantic Area
-
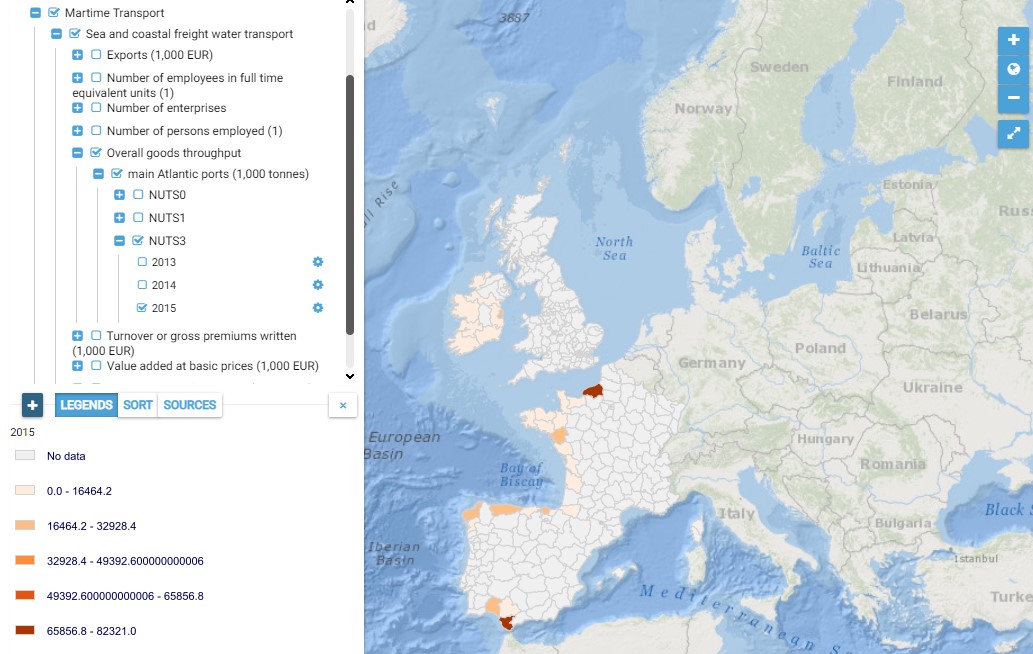
This map presents all layers corresponding to "Sea and coastal freight water transport" activities in the Atlantic area. For more information about this NACE code : https://ec.europa.eu/eurostat/ramon/nomenclatures/index.cfm?TargetUrl=DSP_NOM_DTL_VIEW&StrNom=NACE_REV2&StrLanguageCode=EN&IntPcKey=18512804&IntKey=18512894&StrLayoutCode=HIERARCHIC&IntCurrentPage=1 Indicators collected are : Business indicators per country Number of persons employed and number of employees in full time equivalent units per NUTS 3 unit of the Atlantic Area Overall passenger traffic per main Atlantic port
-
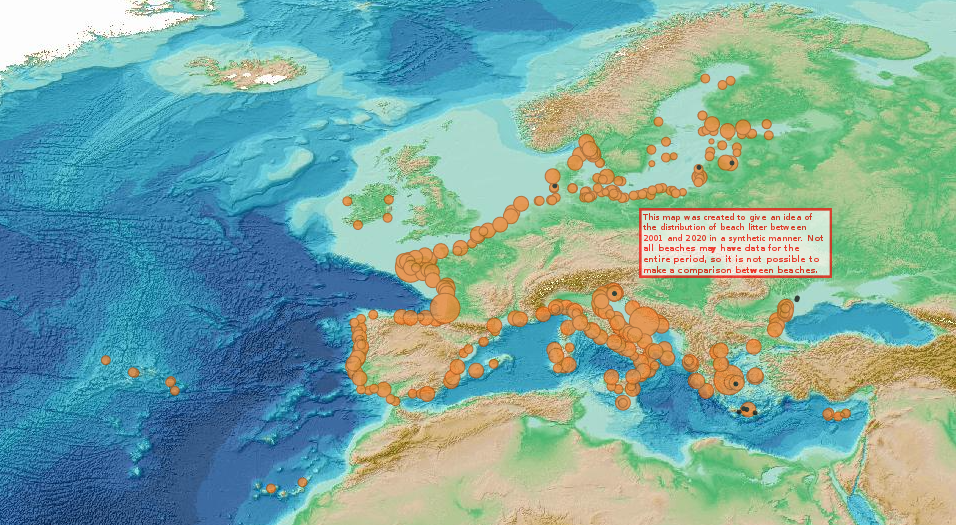
This visualization product displays the total abundance of marine macro-litter (> 2.5cm) per beach, per 100m & to 1 survey aggregated over the period 2001 to 2020 from Marine Strategy Framework Directive (MSFD) monitoring surveys. EMODnet Chemistry included the collection of marine litter in its 3rd phase. Since the beginning of 2018, data of beach litter have been gathered and processed in the EMODnet Chemistry Marine Litter Database (MLDB). The harmonization of all the data has been the most challenging task considering the heterogeneity of the data sources, sampling protocols and reference lists used on a European scale. Preliminary processing were necessary to harmonize all the data: - Exclusion of OSPAR 1000 protocol: in order to follow the approach of OSPAR that it is not including these data anymore in the monitoring; - Selection of MSFD surveys only (exclusion of other monitoring, cleaning and research operations); - Exclusion of beaches without coordinates; - Some categories & some litter types like organic litter, small fragments (paraffin and wax; items > 2.5cm) and pollutants have been removed. The list of selected items is attached to this metadata (total abundance list). This list was created using EU Marine Beach Litter Baselines and EU Threshold Value for Macro Litter on Coastlines from JRC (these two documents are attached to this metadata); - Normalization of survey lengths to 100m & 1 survey / year: in some cases, the survey length was not exactly 100m, so in order to be able to compare the abundance of litter from different beaches a normalization is applied using this formula: Number of items (normalized by 100 m) = Number of litter per items x (100 / survey length) Then, this normalized number of items is summed to obtain the total normalized number of litter for each survey. Finally, a median is calculated over the entire period among all these total numbers of litter per 100m calculated for each survey. Sometimes the survey length was null or equal to 0. Assuming that the MSFD protocol has been applied, the length has been set at 100m in these cases. The size of each circle on this map increases with the calculated median number of marine litter per beach, per 100m & to 1 survey. The median litter abundance values displayed in the legend correspond to the 50 and 99 percentiles and the maximum value. More information is available in the attached documents. Warning: - the absence of data on the map doesn't necessarily mean that they don't exist, but that no information has been entered in the Marine Litter Database for this area. - This map was created to give an idea of the distribution of beach litter between 2001 and 2021 in a synthetic manner. NOT ALL BEACHES MAY HAVE DATA FOR THE ENTIRE PERIOD, SO IT IS NOT POSSIBLE TO MAKE A COMPARISON BETWEEN BEACHES.
-
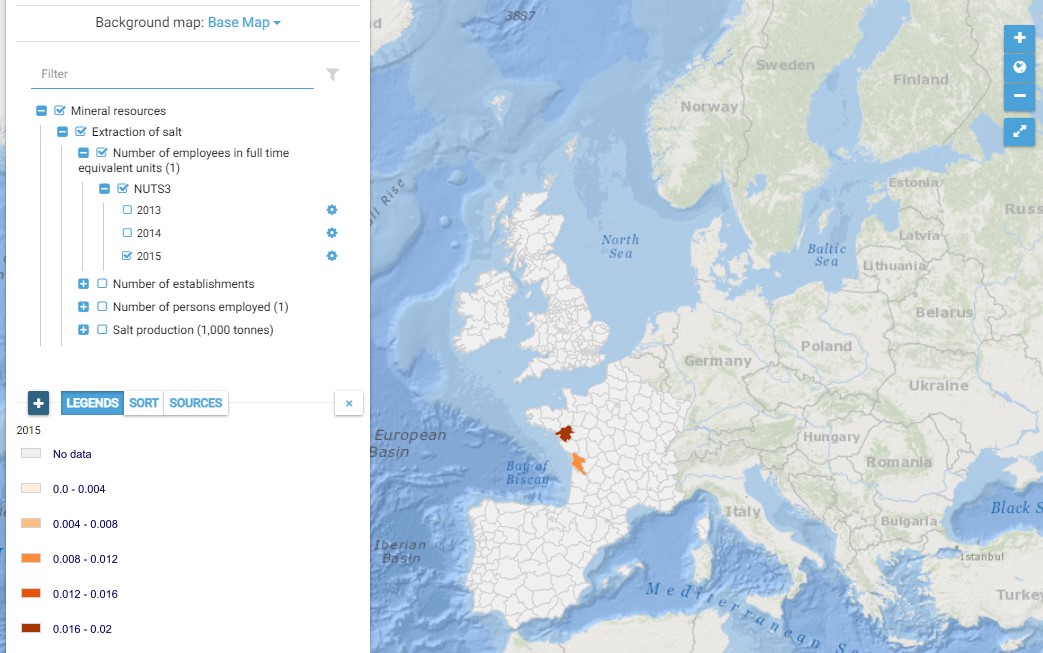
This map presents all layers corresponding to "Extraction of salt" activities in the Atlantic area. For more information about this NACE code : https://ec.europa.eu/eurostat/ramon/nomenclatures/index.cfm?TargetUrl=DSP_NOM_DTL_VIEW&StrNom=NACE_REV2&StrLanguageCode=EN&IntPcKey=18496034&IntKey=18496124&StrLayoutCode=HIERARCHIC&IntCurrentPage=1 Indicators collected are : Number of persons employed and number of employees in full time equivalent units per NUTS 3 unit of the Atlantic Area Salt production per Atlantic NUTS3
-
This map presents all layers corresponding to "Marine fishing" activities in the Atlantic area. For more information about this NACE code : https://ec.europa.eu/eurostat/ramon/nomenclatures/index.cfm?TargetUrl=DSP_NOM_DTL_VIEW&StrNom=NACE_REV2&StrLanguageCode=EN&IntPcKey=18508244&IntKey=18508274&StrLayoutCode=HIERARCHIC&IntCurrentPage=1 Indicators collected are : Business indicators per country
-
Water body phosphate - Monthly Climatology for the European Seas for the period 1960-2020 on the domain from longitude -45.0 to 70.0 degrees East and latitude 24.0 to 83.0 degrees North. Data Sources: observational data from SeaDataNet/EMODnet Chemistry Data Network. Description of DIVA analysis: The computation was done with the DIVAnd (Data-Interpolating Variational Analysis in n dimensions), version 2.7.2, using GEBCO 30sec topography for the spatial connectivity of water masses. Horizontal correlation length and vertical correlation length vary spatially depending on the topography and domain. Depth range: 0.0, 5.0, 10.0, 15.0, 20.0, 25.0, 30.0, 35.0, 40.0, 45.0, 50.0, 55.0, 60.0, 65.0, 70.0, 75.0, 80.0, 85.0, 90.0, 95.0, 100.0, 125.0, 150.0, 175.0, 200.0, 225.0, 250.0, 275.0, 300.0, 325.0, 350.0, 375.0, 400.0, 425.0, 450.0, 475.0, 500.0, 550.0, 600.0, 650.0, 700.0, 750.0, 800.0, 850.0, 900.0, 950.0, 1000.0, 1050.0, 1100.0, 1150.0, 1200.0, 1250.0, 1300.0, 1350.0, 1400.0, 1450.0, 1500.0, 1550.0, 1600.0, 1650.0, 1700.0, 1750.0, 1800.0, 1850.0, 1900.0, 1950.0, 2000.0, 2100.0, 2200.0, 2300.0, 2400.0, 2500.0, 2600.0, 2700.0, 2800.0, 2900.0, 3000.0, 3100.0, 3200.0, 3300.0, 3400.0, 3500.0, 3600.0, 3700.0, 3800.0, 3900.0, 4000.0, 4100.0, 4200.0, 4300.0, 4400.0, 4500.0, 4600.0, 4700.0, 4800.0, 4900.0, 5000.0, 5100.0, 5200.0, 5300.0, 5400.0, 5500.0 m. Units: umol/l. The horizontal resolution of the produced DIVAnd analysis is 0.25 degrees.
-
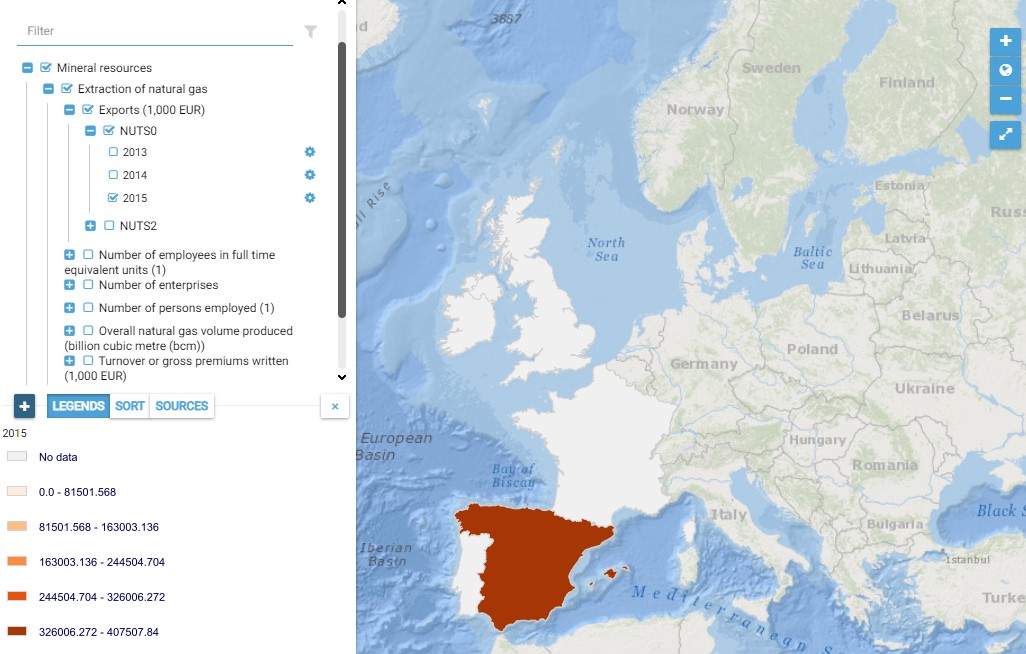
This map presents all layers corresponding to "Marine fishing" activities in the Atlantic area. For more information about this NACE code : https://ec.europa.eu/eurostat/ramon/nomenclatures/index.cfm?TargetUrl=DSP_NOM_DTL_VIEW&StrNom=NACE_REV2&StrLanguageCode=EN&IntPcKey=18495674&IntKey=18495704&StrLayoutCode=HIERARCHIC&IntCurrentPage=1 Indicators collected are : Business indicators per country Number of persons employed on Atlantic pits and rigs Overall gas volume produced Overall volume produced from Atlantic gas terminals