 Catalogue PIGMA
2022
Type of resources
Available actions
Topics
Keywords
Contact for the resource
Provided by
Years
Formats
Representation types
Update frequencies
status
Service types
Scale
Resolution
-
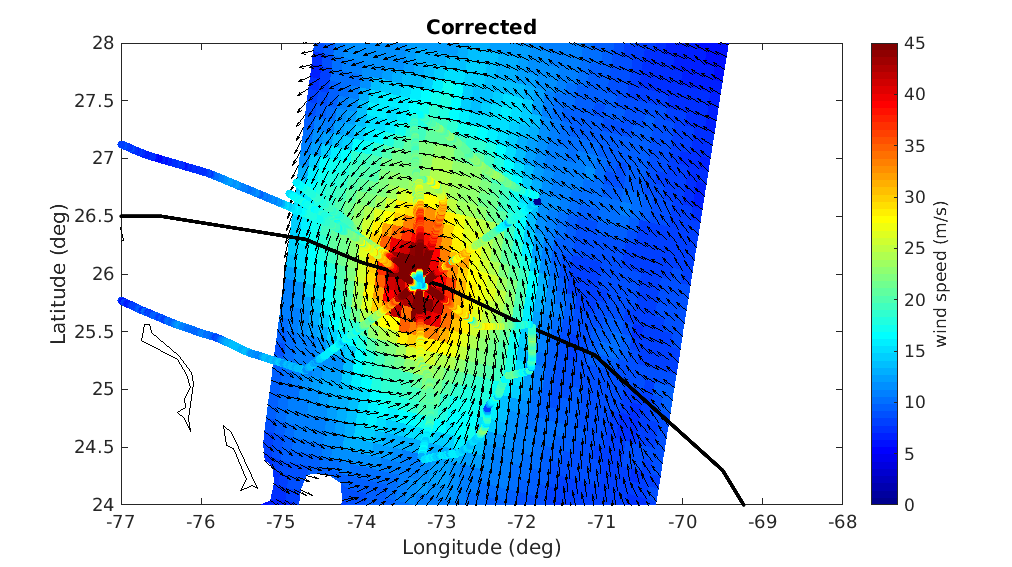
A prerequisite for a successful development of a multi-mission wind dataset is to ensure good inter-calibration of the different extreme wind datasets to be integrated in the product. Since the operational hurricane community is working with the in-situ dropsondes as wind speed reference, which are in turn used to calibrate the NOAA Hurricane Hunter Stepped Frequency Microwave Radiometer (SFMR) wind data, MAXSS has used the latter to ensure extreme-wind inter-calibration among the following scatterometer and radiometer systems: the Advanced Scatterometers onboard the Metop series (i.e., ASCAT-A, -B, and -C), the scatterometers onboard Oceansat-2 (OSCAT) and ScatSat-1 (OSCAT-2), and onboard the HY-2 series (HSCAT-A, -B); the Advanced Microwave Scanning Radiometer 2 onboard GCOM-W1(AMSR-2), the multi-frequency polarimetric radiometer (Windsat), and the L-band radiometers onboard the Soil Moisture and Ocean Salinity (SMOS) and the Soil Moisture Active Passive (SMAP) missions. In summary, a two-step strategy has been followed to adjust the high and extreme wind speeds derived from the mentioned scatterometer and radiometer systems, available in the period 2009-2020. First, the C-band ASCATs have been adjusted against collocated storm-motion centric SFMR wind data. Then, both SFMR winds and ASCAT adjusted winds have been used to adjust all the other satellite wind systems. In doing so, a good inter-calibration between all the systems is ensured not only under tropical cyclone (TC) conditions, but also elsewhere. This dataset was produced in the frame of the ESA funded Marine Atmosphere eXtreme Satellite Synergy (MAXSS) project. The primary objective of the ESA Marine Atmosphere eXtreme Satellite Synergy (MAXSS) project is to provide guidance and innovative methodologies to maximize the synergetic use of available Earth Observation data (satellite, in situ) to improve understanding about the multi-scale dynamical characteristics of extreme air-sea interaction.
-
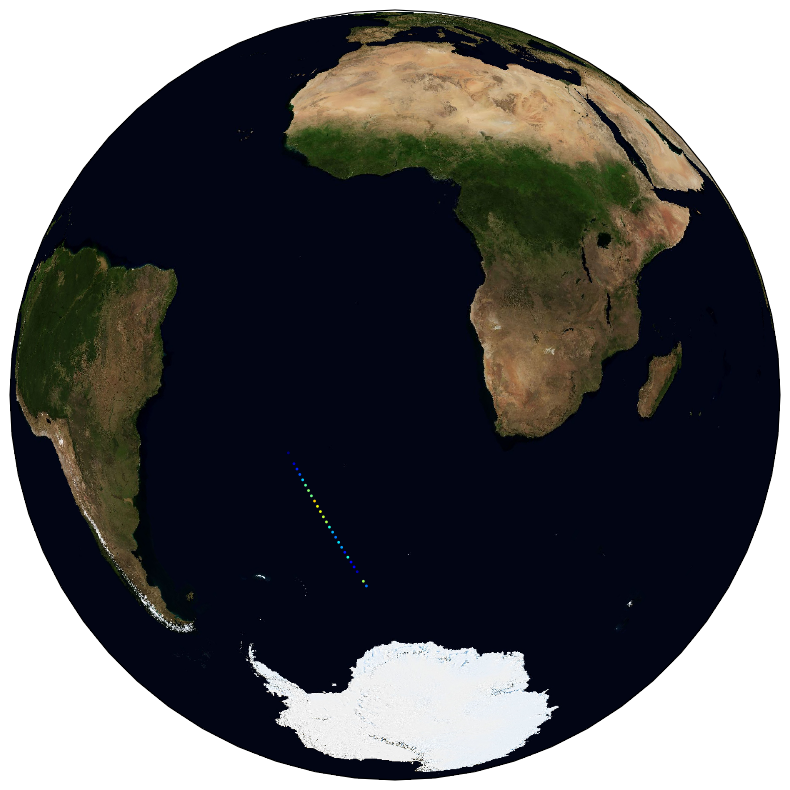
The ESA Sea State Climate Change Initiative (CCI) project has produced global multi-sensor time-series of along-track satellite synthetic aperture radar (SAR) integrated sea state parameters (ISSP) data from ENVISAT (referred to as SAR Wave Mode onboard ENVISAT Level 2P (L2P) ISSP data) with a particular focus for use in climate studies. This dataset contains the ENVISAT Remote Sensing Integrated Sea State Parameter product (version 1.1), which forms part of the ESA Sea State CCI version 3.0 release. This product provides along-track significant wave height (SWH) measurements at 5km resolution every 100km, processed using the Li et al., 2020 empirical model, separated per satellite and pass, including all measurements with flags and uncertainty estimates. These are expert products with rich content and no data loss. The SAR Wave Mode data used in the Sea State CCI SAR WV onboard ENVISAT Level 2P (L2P) ISSP v3 dataset come from the ENVISAT satellite mission spanning from 2002 to 2012.
-
Understanding the dynamics of species interactions for food (prey-predator, competition for resources) and the functioning of trophic networks (dependence on trophic pathways, food chain flows, etc.) has become a thriving ecological research field in recent decades. This empirical knowledge is then used to develop population and ecosystem modelling approaches to support ecosystem-based management. The TrophicCS data set offers spatialized trophic information on a large spatial scale (the entire Celtic Sea continental shelf and upper slope) for a wide range of species. It combines ingested prey (gut content analysis) and a more integrated indicator of food sources (stable isotope analysis). A total of 1337 samples of large epifaunal invertebrates (bivalve mollusks and decapod crustaceans), zooplankton, fish and cephalopods, corresponding to 114 species, were collected and analyzed for stable isotope analysis of their carbon and nitrogen content. Sample size varied between taxa (from 1 to 52), with an average of 11.72 individuals sampled per species, and water depths ranged from 57 to 516 m. The gut contents of 1026 fish belonging to ten commercially important species: black anglerfish (Lophius budegassa), white anglerfish (Lophius piscatorius), blue whiting (Micromesistius poutassou), cod (Gadus morhua), haddock (Melanogrammus aeglefinus), hake (Merluccius merluccius), megrim (Lepidorhombus whiffiagonis), plaice (Pleuronectes platessa), sole (Solea solea) and whiting (Merlangius merlangus) were analyzed. The stomach content data set contains the occurrence of prey in stomach, identified to the lowest taxonomic level possible. To consider potential ontogenetic diet changes, a large size range was sampled. The TrophicCS data set was used to improve understanding of trophic relationships and ecosystem functioning in the Celtic Sea. When you use the data in your publication, we request that you cite this data paper. If you use the present data set (TrophicCS) for the majority of the data analyzed in your study, you may wish to consider inviting at least one author of the core team of this data paper to become a collaborator /coauthor of your paper.
-
The GEBCO_2022 Grid is a global continuous terrain model for ocean and land with a spatial resolution of 15 arc seconds. In regions outside of the Arctic Ocean area, the grid uses as a base Version 2.4 of the SRTM15_plus data set (Tozer, B. et al, 2019). This data set is a fusion of land topography with measured and estimated seafloor topography. Included on top of this base grid are gridded bathymetric data sets developed by the four Regional Centers of The Nippon Foundation-GEBCO Seabed 2030 Project. The GEBCO_2022 Grid represents all data within the 2022 compilation. The compilation of the GEBCO_2022 Grid was carried out at the Seabed 2030 Global Center, hosted at the National Oceanography Centre, UK, with the aim of producing a seamless global terrain model. Outside of Polar regions, the Regional Centers provide their data sets as sparse grids i.e. only grid cells that contain data are populated. These data sets were included on to the base using a remove-restore blending procedure. This is a two-stage process of computing the difference between the new data and the base grid and then gridding the difference and adding the difference back to the existing base grid. The aim is to achieve a smooth transition between the new and base data sets with the minimum of perturbation of the existing base data set. The data sets supplied in the form of complete grids (primarily areas north of 60N and south of 50S) were included using feather blending techniques from GlobalMapper software. The GEBCO_2022 Grid has been developed through the Nippon Foundation-GEBCO Seabed 2030 Project. This is a collaborative project between the Nippon Foundation of Japan and the General Bathymetric Chart of the Oceans (GEBCO). It aims to bring together all available bathymetric data to produce the definitive map of the world ocean floor by 2030 and make it available to all. Funded by the Nippon Foundation, the four Seabed 2030 Regional Centers include the Southern Ocean - hosted at the Alfred Wegener Institute, Germany; South and West Pacific Ocean - hosted at the National Institute of Water and Atmospheric Research, New Zealand; Atlantic and Indian Oceans - hosted at the Lamont-Doherty Earth Observatory, Columbia University, USA; Arctic and North Pacific Oceans - hosted at Stockholm University, Sweden and the Center for Coastal and Ocean Mapping at the University of New Hampshire, USA.
-
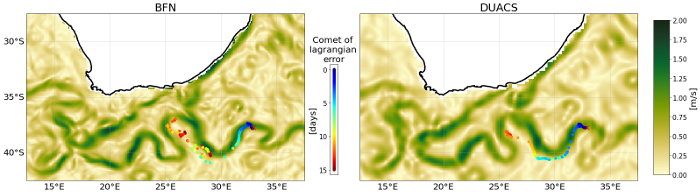
This dataset provides Level 4 total current including geostrophy and a data-driven approach for Ekman and near-inertial current, based on a convolution between drifter observation and wind history, to fit empirically a complex and time-lag dependant transfert function between ERA5 wind stress and current The data are available through HTTP and FTP; access to the data is free and open. In order to be informed about changes and to help us keep track of data usage, we encourage users to register at: https://forms.ifremer.fr/lops-siam/access-to-esa-world-ocean-circulation-project-data/ This dataset was generated by Datlas and is distributed by Ifremer / CERSAT in the frame of the World Ocean Circulation (WOC) project funded by the European Space Agency (ESA).
-
This dataset consists of metatranscriptomic sequencing reads corresponding to coastal micro-eukaryote communities sampled in Western Europe in 2018 and 2019.
-

Raw reads for the assembly of Gambusia holbrooki genome.
-
The ESA Sea State Climate Change Initiative (CCI) project has produced global multi-sensor time-series of along-track satellite synthetic aperture radar (SAR) integrated sea state parameters (ISSP) data from Sentinel-1 (referred to as SAR WV onboard Sentinel-1 Level 2P (L2P) ISSP data) with a particular focus for use in climate studies. This dataset contains the Sentinel-1 SAR Remote Sensing Integrated Sea State Parameter product (v1.0), which forms part of the ESA Sea State CCI version 3.0 release. This product provides along-track primary significant wave height measurements and secondary sea state parameters, calibrated with CMEMS model data and reference in situ measurements at 20km resolution every 100km, processed using the Pleskachevsky et. al., 2021 emprical model, separated per satellite and pass, including all measurements with flags and uncertainty estimates. These are expert products with rich content and no data loss. The SAR Wave Mode data used in the Sea State CCI SAR WV onboard Sentinel-1 Level 2P (L2P) ISSP v3 dataset come from the Sentinel-1 satellite missions spanning from 2014 to 2021 (Sentinel-1 A, Sentinel-1 B).
-
The SARWAVE project is developing a new sea state processor from SAR images to be applied over open ocean, sea ice, and coastal areas, and exploring potential synergy with other microwave and optical EO products.
-
The ClimateFish database collates abundance data of 15 fish species proposed as candidate indicators of climate change in the Mediterranean Sea. An initial group of eight Mediterranean indigenous species (Epinephelus marginatus, Thalassoma pavo, Sparisoma cretense, Coris julis, Sarpa salpa, Serranus scriba, Serranus cabrilla and Caranx crysos) with wide distribution, responsiveness to temperature conditions and easy identification were selected by a network of Mediterranean scientists joined under the CIESM programme ‘Tropical Signals’ (https://www.ciesm.org/marine/programs/tropicalization.htm; Azzurro et al. 2010). Soon after, and thanks to the discussion with other expert groups and projects, C. crysos was no longer considered, and Lessepsian fishes (Red Sea species entering the Mediterranean through the Suez Canal) were included, namely: Fistularia commersonii, Siganus luridus, Siganus rivulatus, Pterois miles, Stephanolopis diaspros, Parupeneus forskali, Pempheris rhomboidea and Torquigener flavimaculosus. Considering the trend of increase of these species in the Mediterranean Sea (Golani et al. 2021) and their projected distribution according to climate change scenarios (D’Amen and Azzurro, 2020), more data on these tropical invaders are expected to come in the future implementation of the study. Data were collected according to a simplified visual census methodology (Garrabou et al. 2019) along standard transects of five minutes performed at a constant speed of 10m/min, corresponding approximately to an area of 50x5m. Four different depth layers were surveyed: 0-3m, 5-10 m, 11-20 m, 21-30 m. So far, the ClimateFish database includes fish counts collected along 3142 transects carried out in seven Mediterranean countries between 2009 and 2021, for a total number of 101'771 observed individuals belonging to the 15 fish species. Data were collected by a large team of researchers which joined in a common monitoring strategy supported by different international projects, which are acknowledged below. This database, when associated with climate data, offers new opportunities to investigate spatio-temporal effects of climate change in the Mediterranean Sea and test the effectiveness of each species as a possible climate change indicator. Contacts: ernesto.azzurro(at)cnr.it References: Azzurro E., Maynou F., Moschella P. (2010). A simplified visual census methodology to detect variability trends of coastal mediterranean fishes under climate change scenarios. Rapp. Comm. int. Mer Médit., 39. D’Amen, M. and Azzurro, E. (2020). Lessepsian fish invasion in Mediterranean marine protected areas: a risk assessment under climate change scenarios. ICES Journal of Marine Science, 77(1), pp.388-397. Garrabou, J., Bensoussan, N., Azzurro, E. (2019). Monitoring climate-related responses in Mediterranean marine protected areas and beyond: five standard protocols. Golani D., Azzurro E., Dulčić J., Massutí E., Orsi-Relini L. (2021). Atlas of Exotic Fishes in the Mediterranean Sea. 2nd edition [F. Briand, Ed.] 365 pages. CIESM Publishers, Paris, Monaco. ISBN number 978-92-990003-5-9