 Catalogue PIGMA
100000
Type of resources
Available actions
Topics
Keywords
Contact for the resource
Provided by
Years
Formats
Representation types
Update frequencies
status
Scale
Resolution
-

Il s'agit du diagnostic du SCOT et de l’état initial de l'environnement validé en 2014.
-
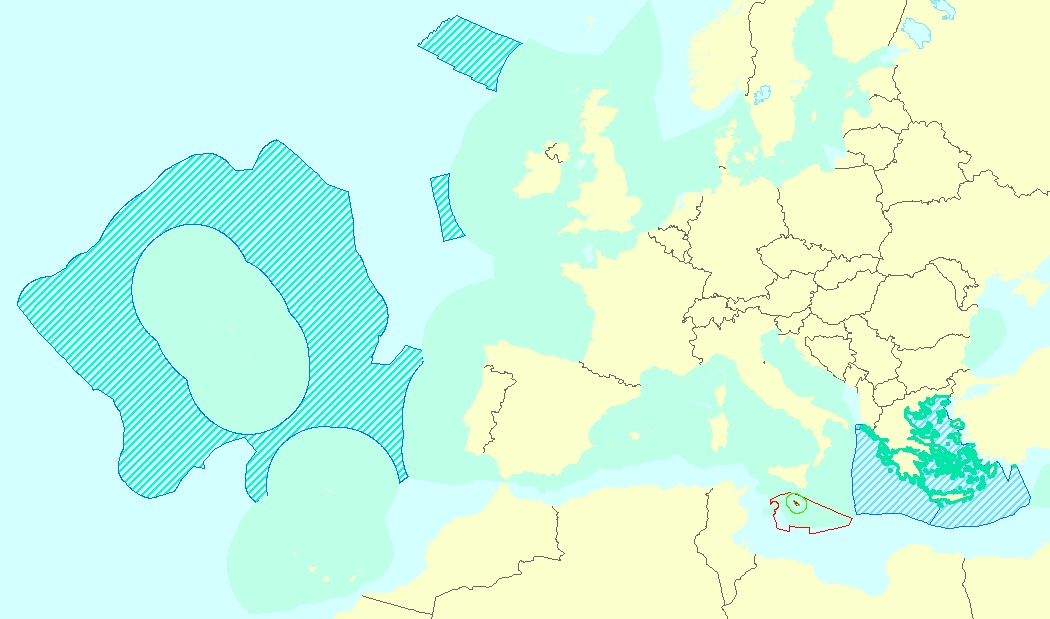
This vector data set is the first public version released of the EU marine waters used for the implementation of the Marine Strategy Framework Directive (MSFD), submitted by the Member States to the European Commission. The Marine Strategy Framework Directive (MSFD) applies to all marine waters of EU Member States, which in Article 3 are defined as follows: (a) waters, the seabed and subsoil on the seaward side of the baseline from which the extent of territorial waters is measured extending to the outmost reach of the area where a Member State has and/or exercises jurisdictional rights, in accordance with the UNCLOS, with the exception of waters adjacent to the countries and territories mentioned in Annex II to the Treaty and the French Overseas Departments and Collectivities; and (b) coastal waters as defined by Directive 2000/60/EC, their seabed and their subsoil, in so far as particular aspects of the environmental status of the marine environment are not already addressed through that Directive or other Community legislation.
-
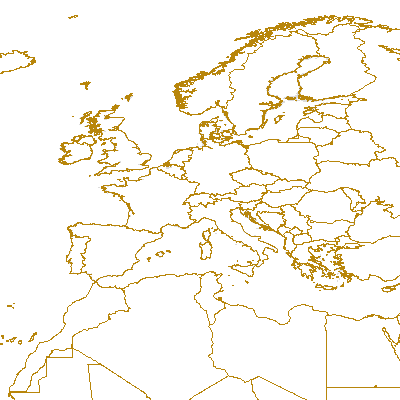
Complete Coastline Features for all the countries that produced Corine Land Cover 2000 and have a coastline, with detailed descriptions on the environment and type of coastal areas. Each coast segment has inherited CLC 2000 class, and also the attributes from Eurosion Coastline version 2.1 2004, regarding geomorphology, type of coast and erosion trends.
-

L’objectif général de ce projet de thèse est d’analyser et d’évaluer les données sources (actuelles et potentielles) des matrices de changements d’occupation du sol afin d’améliorer la robustesse de l’inventaire. Il s’agit d’expertiser par une démarche scientifique la pertinence des travaux réalisés annuellement pour l’inventaire UTCATF. En particulier, il s’agit de comprendre les causes des incertitudes des données sources ; compiler les données disponibles et leurs métadonnées ; étudier qualitativement les dynamiques paysagères décrites ; et redéfinir un cadre méthodologique permettant d’estimer des taux de changements plus pertinent.
-

The EEA coastline dataset is created for detailed analysis with a Minimum Mapping Unit of e.g. 1:100000, for geographical Europe. The coastline is a hybrid product obtained from satellite imagery from two projects: 1) EUHYDRO (Pan-European hydrographic and drainage database) [https://land.copernicus.eu/pan-european/satellite-derived-products/eu-hydro/view] and 2) GSHHG (A Global Self-consistent, Hierarchical, High-resolution Geography Database) [http://www.soest.hawaii.edu/pwessel/gshhg/]. The defining criteria was altitude level = 0 from EUDEM [https://land.copernicus.eu/pan-european/satellite-derived-products/eu-dem/view]. Outside the coverage of the EUDEM, the coastline from GSHHG was used without modifications. A few manual amendments to the dataset were necessary to meet requirements from EU Nature Directives, Water Framework Directive and Marine Strategy Framework Directive. In 2015, several corrections were made in the Kalogeroi Islands (coordinates 38.169, 25.287) and two other Greek little islets (coordinates 36.766264, 23.604318), as well as in the peninsula of Porkkala (around coordinates 59.99, 24.42). In this revision (v3, 2017), 2 big lagoons have been removed from Baltic region, because, according to HELCOM, are freshwater lagoons. This dataset is a polygon usable as a water-land mask.
-
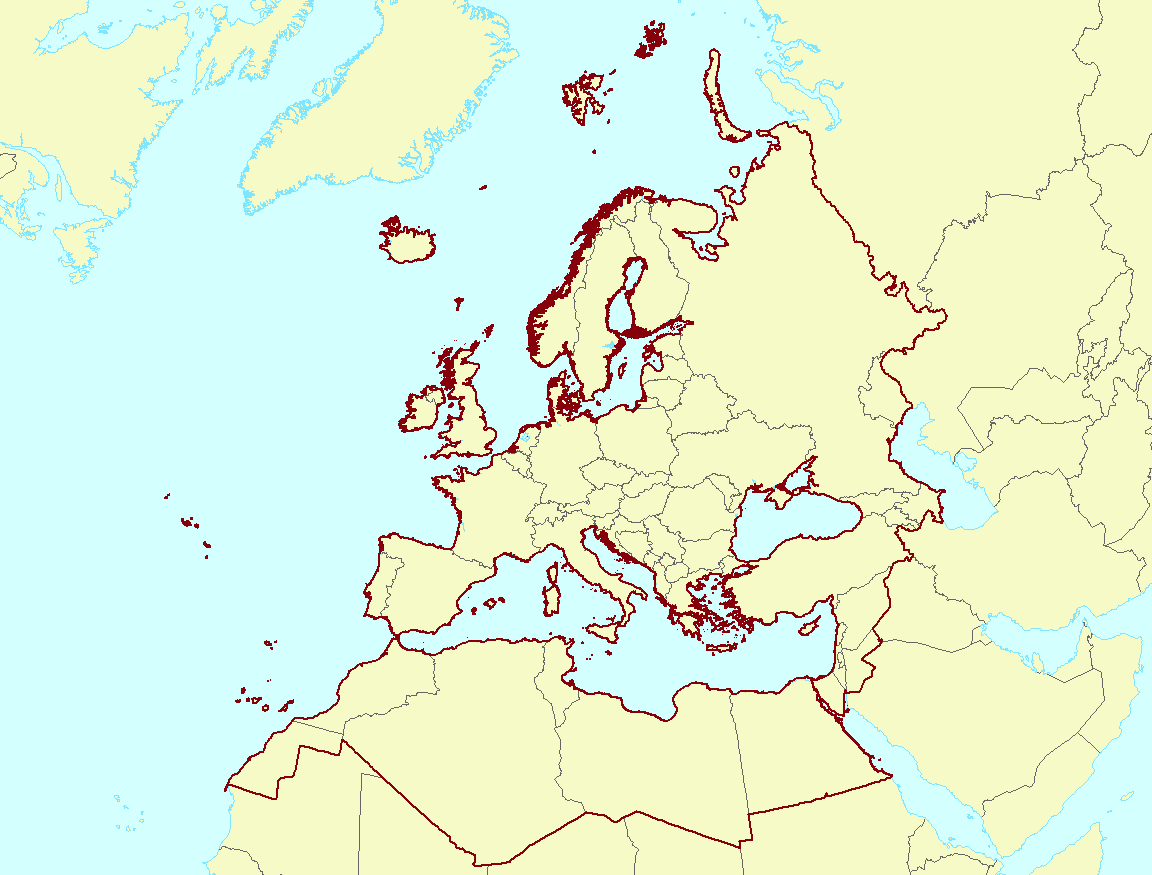
The EEA coastline for analysis is created for highly detailed analysis, e.g. 1:100 000, for geographical Europe. The coastline is a hybrid product obtained from projects using satellite imagery as data source: EUHYDRO (https://land.copernicus.eu/imagery-in-situ/eu-hydro) and GSHHG (http://www.soest.hawaii.edu/pwessel/gshhg/). The defining criteria was altitude level = 0 from EUDEM (https://land.copernicus.eu/pan-european/satellite-derived-products/eu-dem/view). Outside the coverage of the EUDEM, the coastline from GSHHG was used without modifications. A few manual amendments to the dataset were necessary to meet requirements from EU Nature Directives, Water Framework Directive and Marine Strategy Framework Directive. In 2015, several corrections were made in the Kalogeroi Islands (coordinates 38.169, 25.287) and two other Greek little islets (coordinates 36.766264, 23.604318), as well as in the peninsula of Porkkala (around coordinates 59.99, 24.42). In this revision (v3, 2017), 2 big lagoons have been removed from Baltic region, because, according to HELCOM, are freshwater lagoons.
-
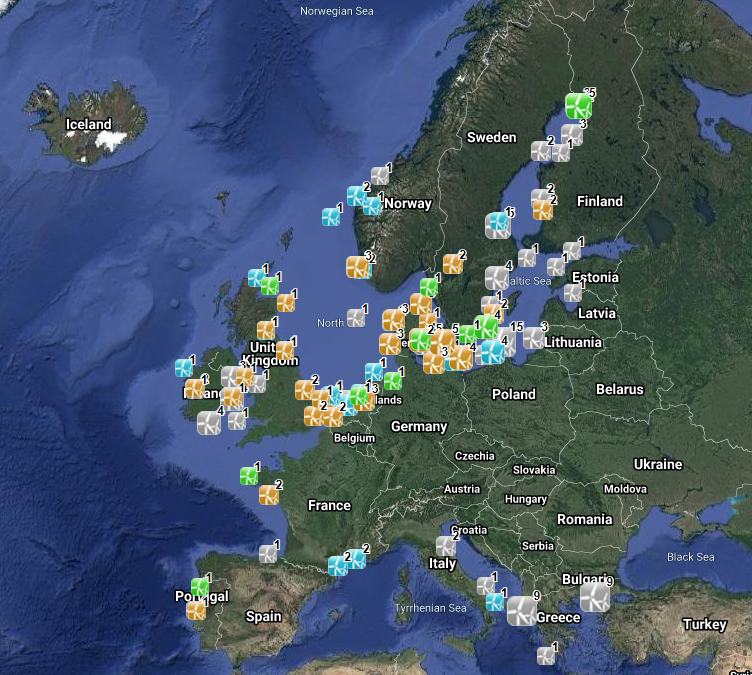
The database on offshore wind farms in the EU was created in 2014 by CETMAR for the European Marine Observation and Data Network (EMODnet). It is the result of the aggregation and harmonization of datasets provided by several sources. It is updated every year and is available for viewing and download on EMODnet Human Activities web portal (www.emodnet-humanactivities.eu). The database contains points and/or (where available) polygons representing offshore wind farms in the following countries: Belgium, Denmark, Estonia, Finland, France, Germany, Greece, Ireland, Italy, Latvia, Lithuania, Netherlands, Norway, Poland, Portugal, Spain, Sweden and United Kingdom. Each point has the following attributes (where available): Name, Nº of turbines, Status (Approved, Planned, Dismantled, Construction, Production, Test site), Country, Year, Power (MW), Distance to coast (metres) and Area (square kilometres). The distance to coast (EEA coastline shapefile) has been calculated using the UTM WGS84 Zone projected coordinate system where data fall in.
-

The dataset shows the percentage of cities' administrative area (core city based on the Urban Morphological Zones dataset) inundated by the sea level rise of 1 metre, without any coastal flooding defences present for a series of individual coastal European cities (included in Urban Audit). The dataset has been computed using the CReSIS (Centre for Remote Sensing of Ice Sheets) dataset for 2018.
-
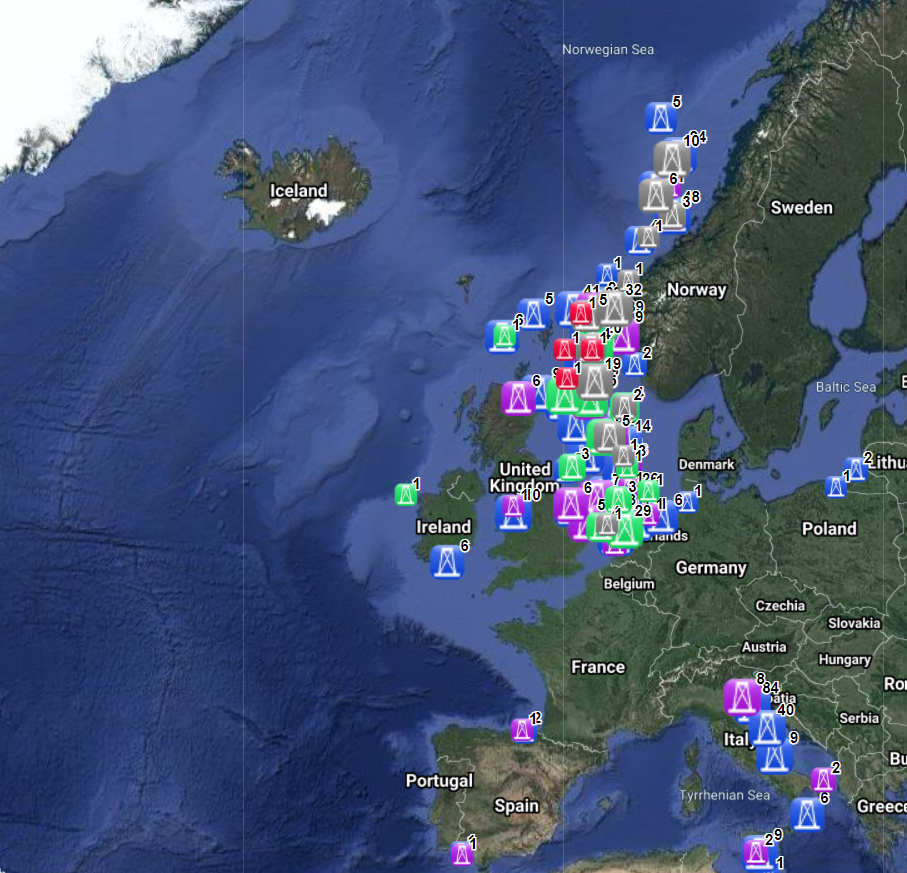
The dataset on offshore installations for Oil and Gas exploitation and exploration activities was created in 2015 by Cogea for the European Marine Observation and Data Network (EMODnet). It is the result of the aggregation and harmonization of datasets provided by several EU and non-EU sources. It is updated every year, and is available for viewing and download on EMODnet - Human Activities web portal (www.emodnet-humanactivities.eu). The dataset contains points representing offshore installations and where available each point has the following attributes: ID, name, country, location block, operator, production start year, primary production, current status, category and function of the installation, sub-structure and topside weights (tonnes), water depth (metres), distance to coast (metres) and remarks. The OSPAR commission source covers data for Germany, Ireland, Spain and the United Kingdom, while for Italy data have been collected and harmonized from the Italian Ministry of Economic Development, for Norway from the Norwegian Petroleum Directorate, for Denmark from the Danish Energy Agency, for the Netherlands from the TNO - Geological Survey of the Netherlands, for Croatia from the Croatian Hydrocarbon Agency, from Marine Traffic and Helcom data on Polish and Russian installations in the Baltic Sea, from Marine Traffic data on Bulgarian, Russian and Ukrainian installations in the Black Sea, Lybian and Spanish installations in the Mediterranean Sea. Compared with the previous version this new version has been updated for all countries.
-

List of fish stocks referenced for the year 2018. The repository includes 477 stocks. Each stock is identified by a unique key in accordance with the ICES codification in use. Each record contains a stock identifier, a species or group of species identifier according to the ASFIS/FAO classification, the English stock name, the Latin name of the species, the assessment area according to the FAO codification of fishing sectors. When the stock assessment area groups a series of sectors, the first and last sectors in the series are separated by a dash.