 Catalogue PIGMA
2000
Type of resources
Available actions
Topics
Keywords
Provided by
Years
Formats
Representation types
Update frequencies
status
Scale
Resolution
-
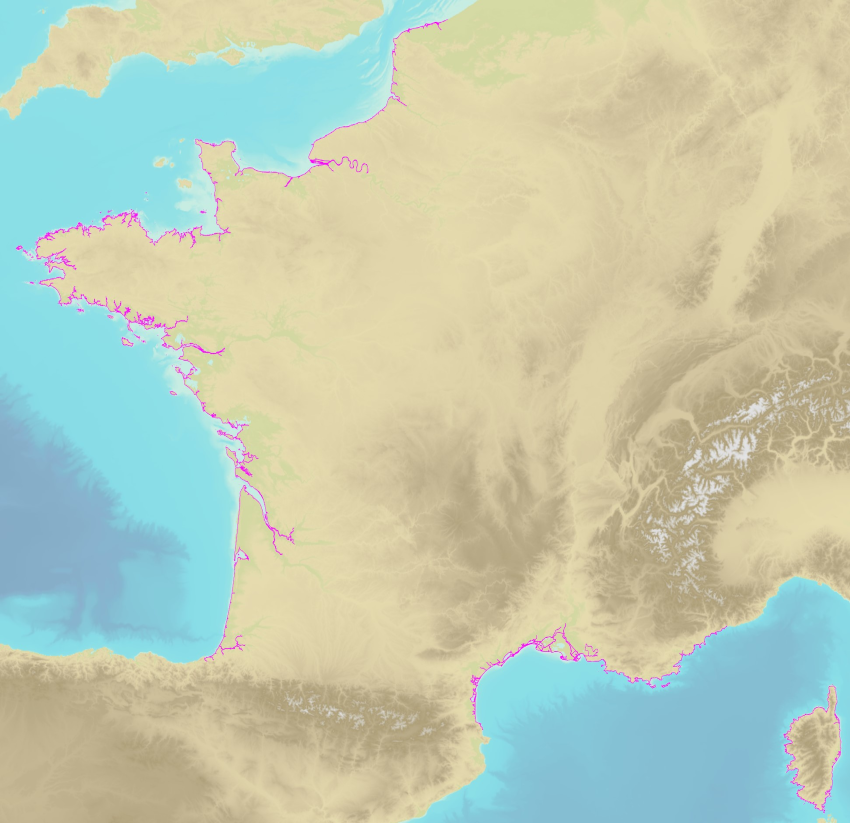
The land-sea limit corresponds to the Highest Astronomical Tide (HAT) in the case of a tide of coefficient 120 and under normal meteorological conditions (no offshore wind and mean atmospheric pressure of 1013 hPa). This geometric line is naturally defined as the intersection of a HAT model (extended to the coast and the top end of the upper estuary) based on the available Bathyelli surfaces, and a high-resolution digital terrain model of the coastal area. It corresponds to the highest limit of the intertidal area and takes into account, when they exist, the 3 administrative maritime limits which are: the transversal limit of the sea (LTM), the salt water limit (LSE) and the limit of maritime jurisdiction (LAM). This limit is measured (quoted) in relation to the local hydrographic chart datum and to the levels of reference for France (IGN69 and IGN78 for Corsica). Relations to other levels of reference (mean sea level and ellipsoid) are known. The land-sea limit product, mainly results from the exploitation of the two products Litto3D®/RGEALTI® and Bathyelli, and represents, with a metric resolution (1 to 5 metres), this theoretical entity by a set of 2D polylines describing the nature of the coast (artificial or natural, rocky or sandy, steep or flat, etc.). The method used for calculating the land-sea limit makes it possible to produce a continuous, homogeneous and spatially coherent limit on the entire French metropolitan coastal area.
-
The land-sea limit corresponds to the Highest Astronomical Tide (HAT) in the case of a tide of coefficient 120 and under normal meteorological conditions (no offshore wind and mean atmospheric pressure of 1013 hPa). This geometric line is naturally defined as the intersection of a HAT model (extended to the coast and the top end of the upper estuary) based on the available Bathyelli surfaces, and a high-resolution digital terrain model of the coastal area. It corresponds to the highest limit of the intertidal area and takes into account, when they exist, the 3 administrative maritime limits which are: the transversal limit of the sea (LTM), the salt water limit (LSE) and the limit of maritime jurisdiction (LAM). This limit is measured (quoted) in relation to the local hydrographic chart datum and to the levels of reference for France (IGN69 and IGN78 for Corsica). Relations to other levels of reference (mean sea level and ellipsoid) are known. The land-sea limit product, mainly results from the exploitation of the two products Litto3D®/RGEALTI® and Bathyelli, and represents, with a metric resolution (1 to 5 metres), this theoretical entity by a set of 2D polylines describing the nature of the coast (artificial or natural, rocky or sandy, steep or flat, etc.). The method used for calculating the land-sea limit makes it possible to produce a continuous, homogeneous and spatially coherent limit on the entire French metropolitan coastal area.
-

Réalisation de la photo-interprétation assistée par ordinateur (PIAO) de l'occupation du sol du territoire du littoral Aquitain couvrant 9 SCOT. Le SCOT de Bayonne fait l'objet d'une interprétation plus fine. Évolution entre 2000 et 2009 Une nomenclature repondant aux exigences européennnes et nationale Une nomenclature emboitée à 4 niveaux et 56 postes a été définie. Elle est basée sur la nomenclature européenne CORINE LAND COVER. Cette nomenclature a été adaptée au territoire aquitain après analyse et remontée des besoins par les partenaires.
-
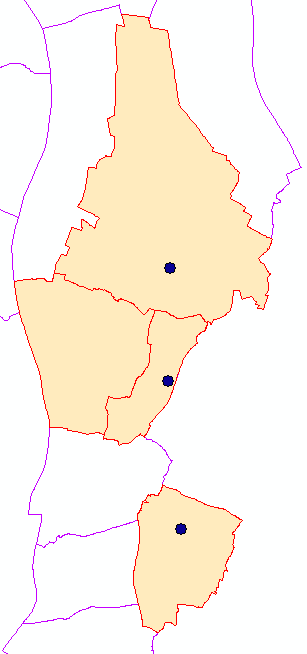
Ce jeu de données représente sous forme de ponctuels les ouvrages de traitement de l'eau de Bordeaux Métropole. Les ouvrages de type chloration, déferrisation, ou filtration, regroupés dans ce jeu de données participent aux traitements permettant de garantir une eau satisfaisant aux critères de qualité nécessaires à sa consommation.
-
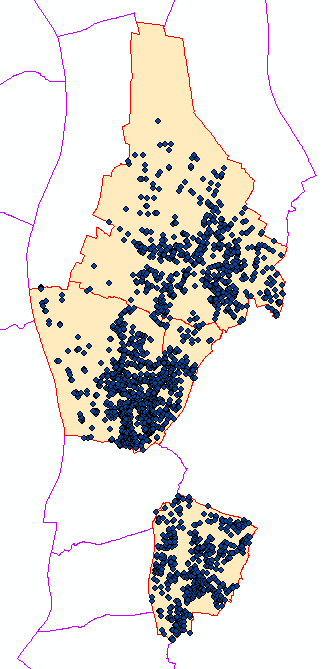
Ce jeu de données représente sous forme de ponctuels les raccords entre deux conduites d'eau potable (raccord de type bouchon, cône, croix, manchon, plaque de réduction, plaque pleine, ou Té.)
-
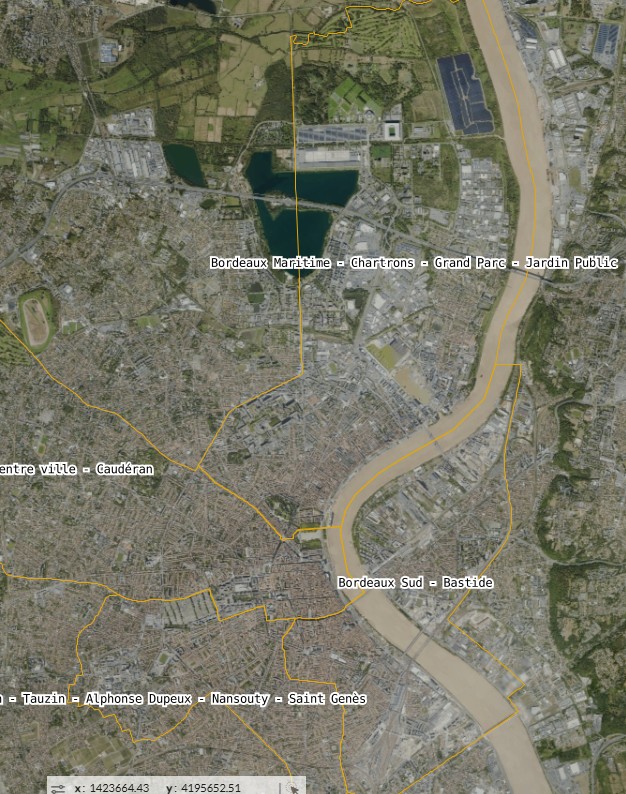
Ce jeu de données représente sous forme surfacique la sectorisation petite enfance du territoire de la ville de Bordeaux
-
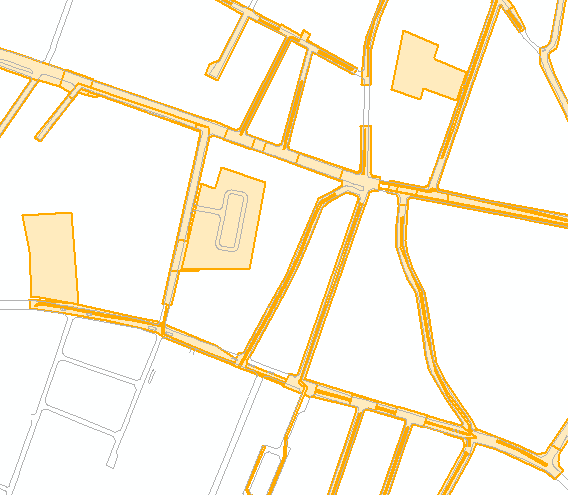
Ce jeu de données représente sous forme de polygones orange les emprises de plans de récolement d'ouvrages d'assainissement.
-
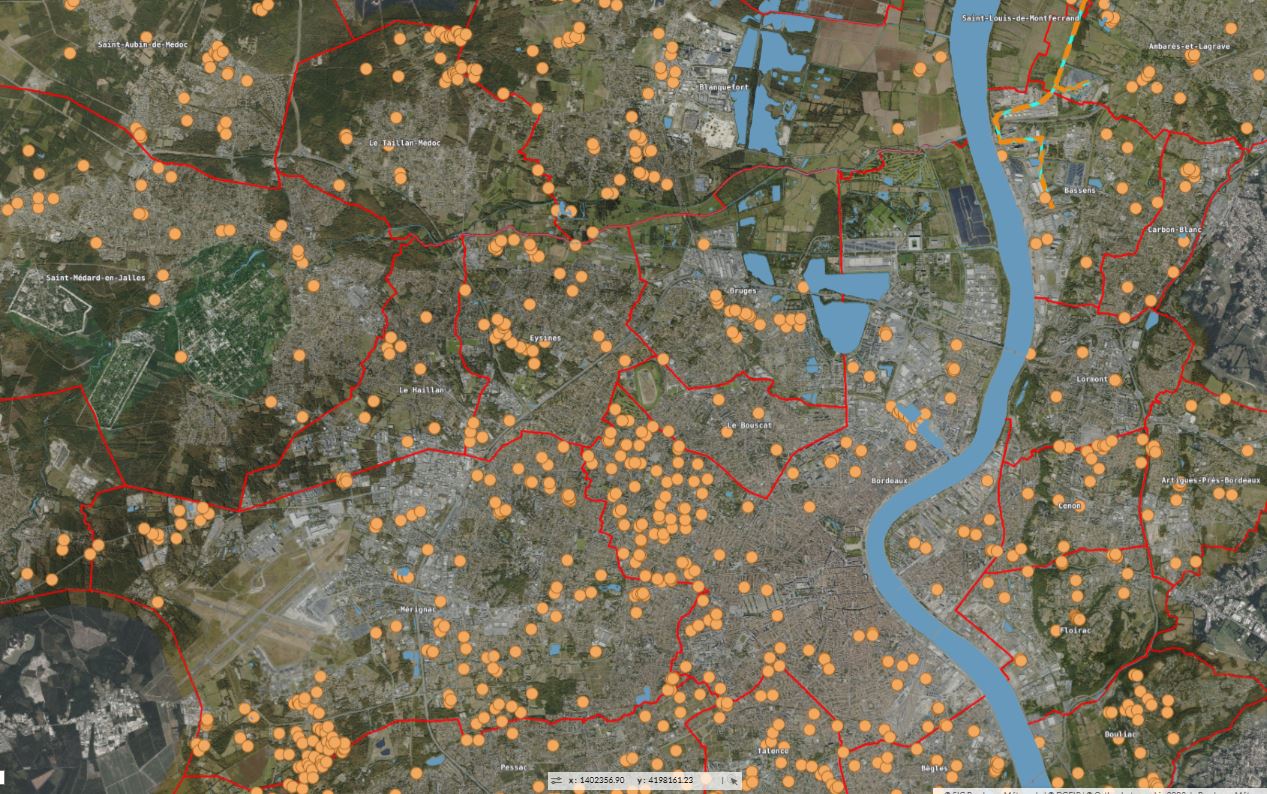
Ce jeu de données ponctuels caractérise la capacité du sol à infiltrer. Ce jeu de données résulte de l'agrégat de différentes sources qui répertorient les ouvrages souterrains sur le territoire de Bordeaux Métropole. Il donne à voir les grandes tendances des facteurs d'infiltration à l'échelle de la Métropole. Il n'engage en rien la responsabilité de Bordeaux Métropole.
-

Réalisation de la photo-interprétation assistée par ordinateur (PIAO) de l'occupation du sol du territoire du littoral Aquitain couvrant 9 SCOT. Le SCOT de Bayonne fait l'objet d'une interprétation plus fine. Une nomenclature repondant aux exigences européennnes et nationale Une nomenclature emboitée à 4 niveaux et 56 postes a été définie. Elle est basée sur la nomenclature européenne CORINE LAND COVER. Cette nomenclature a été adaptée au territoire aquitain après analyse et remontée des besoins par les partenaires.
-
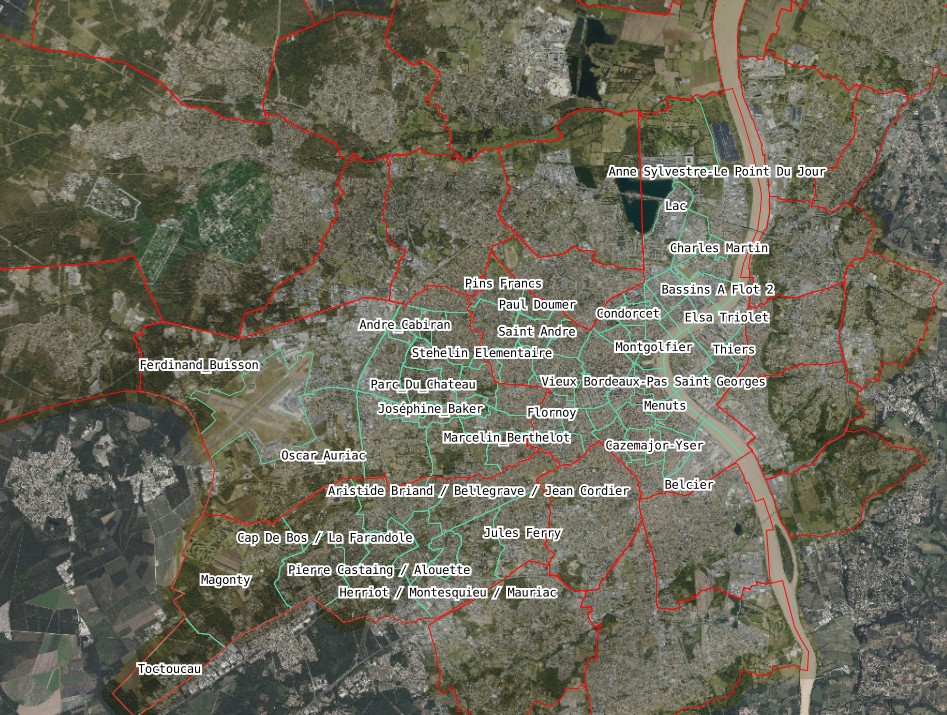
Ce jeu de données représente sous forme surfacique la sectorisation scolaire du territoire de la ville de Bordeaux