 Catalogue PIGMA
*
Type of resources
Available actions
Topics
Keywords
Contact for the resource
Provided by
Years
Formats
Representation types
Update frequencies
status
Service types
Scale
Resolution
-
Monthly time series of Total Nitrogen [mg/l] from model data
-

'''DEFINITION''' The global yearly ocean CO2 sink represents the ocean uptake of CO2 from the atmosphere computed over the whole ocean. It is expressed in PgC per year. The ocean monitoring index is presented for the period 1985 to year-1. The yearly estimate of the ocean CO2 sink corresponds to the mean of a 100-member ensemble of CO2 flux estimates (Chau et al. 2022). The range of an estimate with the associated uncertainty is then defined by the empirical 68% interval computed from the ensemble. '''CONTEXT''' Since the onset of the industrial era in 1750, the atmospheric CO2 concentration has increased from about 277±3 ppm (Joos and Spahni, 2008) to 412.44±0.1 ppm in 2020 (Dlugokencky and Tans, 2020). By 2011, the ocean had absorbed approximately 28 ± 5% of all anthropogenic CO2 emissions, thus providing negative feedback to global warming and climate change (Ciais et al., 2013). The ocean CO2 sink is evaluated every year as part of the Global Carbon Budget (Friedlingstein et al. 2022). The uptake of CO2 occurs primarily in response to increasing atmospheric levels. The global flux is characterized by a significant variability on interannual to decadal time scales largely in response to natural climate variability (e.g., ENSO) (Friedlingstein et al. 2022, Chau et al. 2022). '''CMEMS KEY FINDINGS''' The rate of change of the integrated yearly surface downward flux has increased by 0.04±0.01e-1 PgC/yr2 over the period 1985 to year-1. The yearly flux time series shows a plateau in the 90s followed by an increase since 2000 with a growth rate of 0.06±0.04e-1 PgC/yr2. In 2021 (resp. 2020), the global ocean CO2 sink was 2.41±0.13 (resp. 2.50±0.12) PgC/yr. The average over the full period is 1.61±0.10 PgC/yr with an interannual variability (temporal standard deviation) of 0.46 PgC/yr. In order to compare these fluxes to Friedlingstein et al. (2022), the estimate of preindustrial outgassing of riverine carbon of 0.61 PgC/yr, which is in between the estimate by Jacobson et al. (2007) (0.45±0.18 PgC/yr) and the one by Resplandy et al. (2018) (0.78±0.41 PgC/yr) needs to be added. A full discussion regarding this OMI can be found in section 2.10 of the Ocean State Report 4 (Gehlen et al., 2020) and in Chau et al. (2022). '''DOI (product):''' https://doi.org/10.48670/moi-00223
-

As part of the European Horizon Europe FOCCUS project (https://foccus-project.eu/), the metadata inventory of European coastal platforms has been extracted. The inventory was based on the following History and Latest products, downloaded from the CMEMS website (https://marine.copernicus.eu/fr/acces-donnees) at: 1) Global Ocean-In-Situ Near-Real-Time Observation, 2) Atlantic Iberian Biscay Irish Ocean-In-Situ Near Real Time Observations, 3) Mediterranean Sea-In-Situ Near Real Time Observations, 4) Atlantic-European North West Shelf-Ocean In-Situ Near Real Time Observations. To carry out this inventory, it was decided to target only coastal platforms, located less than 200km from the coast and at a depth of less than 400m. For mobile platforms, it was also decided to focus only on the first position in the file. This data must be located within 200 km of the coast and at a depth of less than 400 m. In this inventory, FerryBox platforms have all been considered as coastal platforms. The following platforms were extracted from the products: BO (Bottles), CT (CTD), DB (Drifting Buoys), FB (Ferry Box), GL (Gliders), HF (High Frequency Radar), MO (Mooring), PF (Profiling Float), TG (Tide Gauge) and XB (XBT). Once the metadata had been extracted from the files, duplicates were removed (files with the same names). Duplicate platforms of type _TS_ and _WS_ were merged (date and parameters). Latest‘ files have been merged with ’History" files. Missing metadata have been replaced in the Excel file by ‘Missing Data’. Some old dates were also revised by hand because they had been badly extracted, as well as some institution names that included special characters. Platforms located on estuaries/rivers/lakes/ponds have also been removed by hand. This inventory identified a total of 10,479 coastal platforms.
-

'''This product has been archived''' For operationnal and online products, please visit https://marine.copernicus.eu '''DEFINITION''' Oligotrophic subtropical gyres are regions of the ocean with low levels of nutrients required for phytoplankton growth and low levels of surface chlorophyll-a whose concentration can be quantified through satellite observations. The gyre boundary has been defined using a threshold value of 0.15 mg m-3 chlorophyll for the Atlantic gyres (Aiken et al. 2016), and 0.07 mg m-3 for the Pacific gyres (Polovina et al. 2008). The area inside the gyres for each month is computed using monthly chlorophyll data from which the monthly climatology is subtracted to compute anomalies. A gap filling algorithm has been utilized to account for missing data. Trends in the area anomaly are then calculated for the entire study period (September 1997 to December 2020). '''CONTEXT''' Oligotrophic gyres of the oceans have been referred to as ocean deserts (Polovina et al. 2008). They are vast, covering approximately 50% of the Earth’s surface (Aiken et al. 2016). Despite low productivity, these regions contribute significantly to global productivity due to their immense size (McClain et al. 2004). Even modest changes in their size can have large impacts on a variety of global biogeochemical cycles and on trends in chlorophyll (Signorini et al. 2015). Based on satellite data, Polovina et al. (2008) showed that the areas of subtropical gyres were expanding. The Ocean State Report (Sathyendranath et al. 2018) showed that the trends had reversed in the Pacific for the time segment from January 2007 to December 2016. '''CMEMS KEY FINDINGS''' The trend in the North Atlantic gyre area for the 1997 Sept – 2020 December period was positive, with a 0.39% year-1 increase in area relative to 2000-01-01 values. This trend has decreased compared with the 1997-2019 trend of 0.45%, and is statistically significant (p<0.05). During the 1997 Sept – 2020 December period, the trend in chlorophyll concentration was positive (0.24% year-1) inside the North Atlantic gyre relative to 2000-01-01 values. This time series extension has resulted in a reversal in the rate of change, compared with the -0.18% trend for the 1997-209 period and is statistically significant (p<0.05). Note: The key findings will be updated annually in November, in line with OMI evolutions. '''DOI (product):''' https://doi.org/10.48670/moi-00226
-
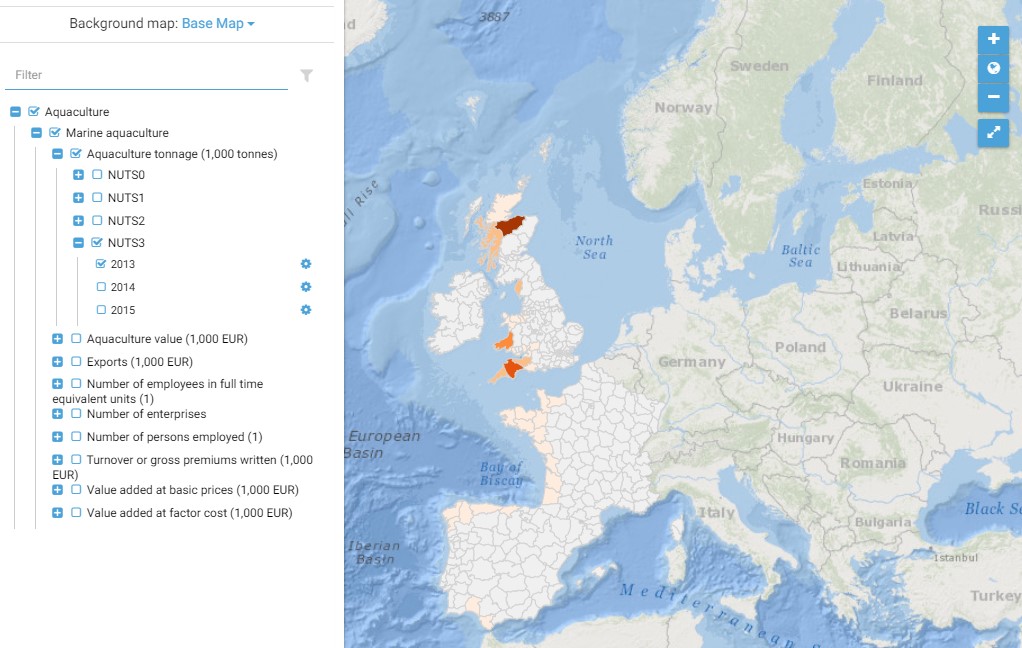
This map presents all layers corresponding to "Marine aquculture" activities in the Atlantic area. For more information about this NACE code : https://ec.europa.eu/eurostat/ramon/nomenclatures/index.cfm?TargetUrl=DSP_NOM_DTL_VIEW&StrNom=NACE_REV2&StrLanguageCode=FR&IntPcKey=18495314&IntKey=18495344&StrLayoutCode=HIERARCHIC&IntCurrentPage=1 Indicators collected are : - Business indicators per country - Number of persons employed and number of employees in full time equivalent units per NUTS 3 unit of the Atlantic Area - Tonnage produced per Atlantic NUTS3 unit - Value produced per Atlantic NUTS 3 unit
-

'''DEFINITION''' The OMI_EXTREME_WAVE_NORTHWESTSHELF_swh_mean_and_anomaly_obs indicator is based on the computation of the 99th and the 1st percentiles from in situ data (observations). It is computed for the variable significant wave height (swh) measured by in situ buoys. The use of percentiles instead of annual maximum and minimum values, makes this extremes study less affected by individual data measurement errors. The percentiles are temporally averaged, and the spatial evolution is displayed, jointly with the anomaly in the target year. This study of extreme variability was first applied to sea level variable (Pérez Gómez et al 2016) and then extended to other essential variables, sea surface temperature and significant wave height (Pérez Gómez et al 2018). '''CONTEXT''' Projections on Climate Change foresee a future with a greater frequency of extreme sea states (Stott, 2016; Mitchell, 2006). The damages caused by severe wave storms can be considerable not only in infrastructure and buildings but also in the natural habitat, crops and ecosystems affected by erosion and flooding aggravated by the extreme wave heights. In addition, wave storms strongly hamper the maritime activities, especially in harbours. These extreme phenomena drive complex hydrodynamic processes, whose understanding is paramount for proper infrastructure management, design and maintenance (Goda, 2010). In recent years, there have been several studies searching possible trends in wave conditions focusing on both mean and extreme values of significant wave height using a multi-source approach with model reanalysis information with high variability in the time coverage, satellite altimeter records covering the last 30 years and in situ buoy measured data since the 1980s decade but with sparse information and gaps in the time series (e.g. Dodet et al., 2020; Timmermans et al., 2020; Young & Ribal, 2019). These studies highlight a remarkable interannual, seasonal and spatial variability of wave conditions and suggest that the possible observed trends are not clearly associated with anthropogenic forcing (Hochet et al. 2021, 2023). In the North Atlantic, the mean wave height shows some weak trends not very statistically significant. Young & Ribal (2019) found a mostly positive weak trend in the European Coasts while Timmermans et al. (2020) showed a weak negative trend in high latitudes, including the North Sea and even more intense in the Norwegian Sea. For extreme values, some authors have found a clearer positive trend in high percentiles (90th-99th) (Young et al., 2011; Young & Ribal, 2019). '''COPERNICUS MARINE SERVICE KEY FINDINGS''' The mean 99th percentiles showed in the area present a wide range from 2.5 meters in the English Channel with 0.3m of standard deviation (std), 3-5m in the southern and central North Sea with 0.3-0.6m of std, 4 meters in the Skagerrak Strait with 0.6m of std, 6-7m in the northern North Sea with 0.4-0.5m of std to 8 meters in the NorthWest of the British Isles with 0.8-1.0m of std. Results for this year show either low positive or negative anomalies between -0.3m and +0.4m, inside the margin of the standard deviation, in the English Channel, the Skagerrak Strait and the southern and central North Sea except in the station 6200046 with a positive anomaly of 0.8m and a slight negative anomaly (-0.1/-0.5m) inside the margin of the std in the NorthWest of the British Isles and the northern North Sea. '''DOI (product):''' https://doi.org/10.48670/moi-00270
-
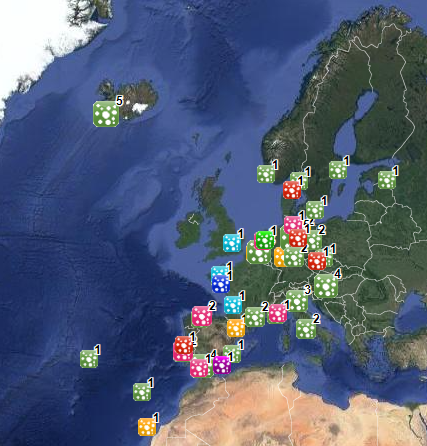
This dataset stems from the Joint Research Centre (JRC) Biomass Mandate (https://knowledge4policy.ec.europa.eu/projects-activities/jrc-biomass-mandate_en) and it is available for viewing and download on EMODnet - Human Activities web portal (www.emodnet-humanactivities.eu) and on the platform from the European Commission’s Knowledge Centre for Bioeconomy (https://knowledge4policy.ec.europa.eu/visualisation/bioeconomy-different-countries_en#algae_prod_plants). Its aim is to build a reliable database to characterize the algae sector and to support informed European policies on Blue Growth and Bioeconomy. More detailed information on the Status of the Algae Production Industry in Europe can be found in a JRC-led study published in Frontiers in Marine Science (https://publications.jrc.ec.europa.eu/repository/handle/JRC122250). Information on the location (geographic coordinates) of the production facilities, group of produced organism (macroalgae, microalgae and spirulina), production method (Fermenters, Harvesting , Photobioreactors, Open ponds, Semi Open ponds, land-based or at sea Aquaculture, Integrated multi-trophic or not) and species (see dataset) have been collected in the following countries: Austria, Belgium, Bulgaria, Croatia, Czech Republic, Denmark, Estonia, Faroe Islands, France, Germany, Greece, Greenland, Hungary, Iceland, Ireland, Italy, Latvia, the Netherlands, Norway, Portugal, Spain, Sweden, Switzerland and the UK. In November 2021, the JRC has updated the database with the latest information on the production units operational at the time.
-
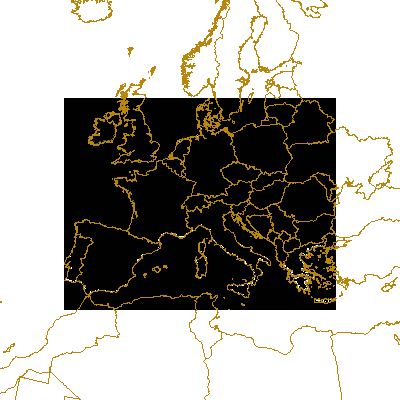
LaCoast is a research project undertaken in the mid 1990 under the lead of the Joint Research Centre (JRC) and aimed at quantifying the changes of land cover types in a 10 km land strip from the coastline. LaCoast uses CORINE Land Cover version 1990 as its reference dataset and track differences of land cover changes using LANDSAT satellite images from the mid-1970's.
-
North Atlantic Ocean Colour Plankton, Reflectance, Transparency and Optics L3 NRT daily observations

'''Short description: ''' For the '''Atlantic''' Ocean '''Satellite Observations''', ACRI-ST company (Sophia Antipolis, France) is providing '''Bio-Geo-Chemical (BGC)''' products based on the '''Copernicus-GlobColour''' processor. * Upstreams: SeaWiFS, MODIS, MERIS, VIIRS-SNPP & JPSS1, OLCI-S3A & S3B for the '''multi''' products, and S3A & S3B only for the '''olci''' products. * Variables: Chlorophyll-a ('''CHL'''), Gradient of Chlorophyll-a ('''CHL_gradient'''), Phytoplankton Functional types and sizes ('''PFT'''), Suspended Matter ('''SPM'''), Secchi Transparency Depth ('''ZSD'''), Diffuse Attenuation ('''KD490'''), Particulate Backscattering ('''BBP'''), Absorption Coef. ('''CDM''') and Reflectance ('''RRS'''). * Temporal resolutions: '''daily'''. * Spatial resolutions: '''1 km''' and a finer resolution based on olci '''300 meters''' inputs. * Recent products are organized in datasets called Near Real Time ('''NRT''') and long time-series (from 1997) in datasets called Multi-Years ('''MY'''). To find the '''Copernicus-GlobColour''' products in the catalogue, use the search keyword '''GlobColour'''. '''DOI (product) :''' https://doi.org/10.48670/moi-00284
-
'''This product has been archived''' For operationnal and online products, please visit https://marine.copernicus.eu '''Short description:''' For the '''Global''' Ocean '''Satellite Observations''', ACRI-ST company (Sophia Antipolis, France) is providing '''Chlorophyll-a''' and '''Optics''' products [1997 - present] based on the '''Copernicus-GlobColour''' processor. * '''Chlorophyll and Bio''' products refer to Chlorophyll-a, Primary Production (PP) and Phytoplankton Functional types (PFT). Products are based on a multi sensors/algorithms approach to provide to end-users the best estimate. Two dailies Chlorophyll-a products are distributed: ** one limited to the daily observations (called L3), ** the other based on a space-time interpolation: the '''Cloud Free''' (called L4). * '''Optics''' products refer to Reflectance (RRS), Suspended Matter (SPM), Particulate Backscattering (BBP), Secchi Transparency Depth (ZSD), Diffuse Attenuation (KD490) and Absorption Coef. (ADG/CDM). * The spatial resolution is 4 km. For Chlorophyll, a 1 km over the Atlantic (46°W-13°E , 20°N-66°N) is also available for the '''Cloud Free''' product, plus a 300m Global coastal product (OLCI S3A & S3B merged). *Products (Daily, Monthly and Climatology) are based on the merging of the sensors SeaWiFS, MODIS, MERIS, VIIRS-SNPP&JPSS1, OLCI-S3A&S3B. Additional products using only OLCI upstreams are also delivered. * Recent products are organized in datasets called NRT (Near Real Time) and long time-series in datasets called REP/MY (Multi-Year). The NRT products are provided one day after satellite acquisition and updated a few days after in Delayed Time (DT) to provide a better quality. An uncertainty is given at pixel level for all products. To find the '''Copernicus-GlobColour''' products in the catalogue, use the search keyword '''GlobColour'''. See [http://catalogue.marine.copernicus.eu/documents/QUID/CMEMS-OC-QUID-009-030-032-033-037-081-082-083-085-086-098.pdf QUID document] for a detailed description and assessment. '''DOI (product) :''' https://doi.org/10.48670/moi-00075