 Catalogue PIGMA
GeoTIFF
Type of resources
Available actions
Topics
Keywords
Contact for the resource
Provided by
Years
Formats
Representation types
Update frequencies
status
Scale
Resolution
-

Species distribution models (Maxent) predicting the distribution of two Vulnerable Marine Ecosystems (VME): the reef-forming Scleractinian coral Desmophyllum pertusum and the aggregations forming Hexactinellid sponge Pheronema carpenteri. Both of these species are VME indicator taxa and form habitat that enhance deep-sea diversity (Ross and Howell, 2013). Maps of the likely distribution of the habitat formed by these two species will enable efficient Marine Spatial planning to facilitate their conservation. This work was performed at the University of Plymouth in 2021. A GIS layer is provided for each species.
-
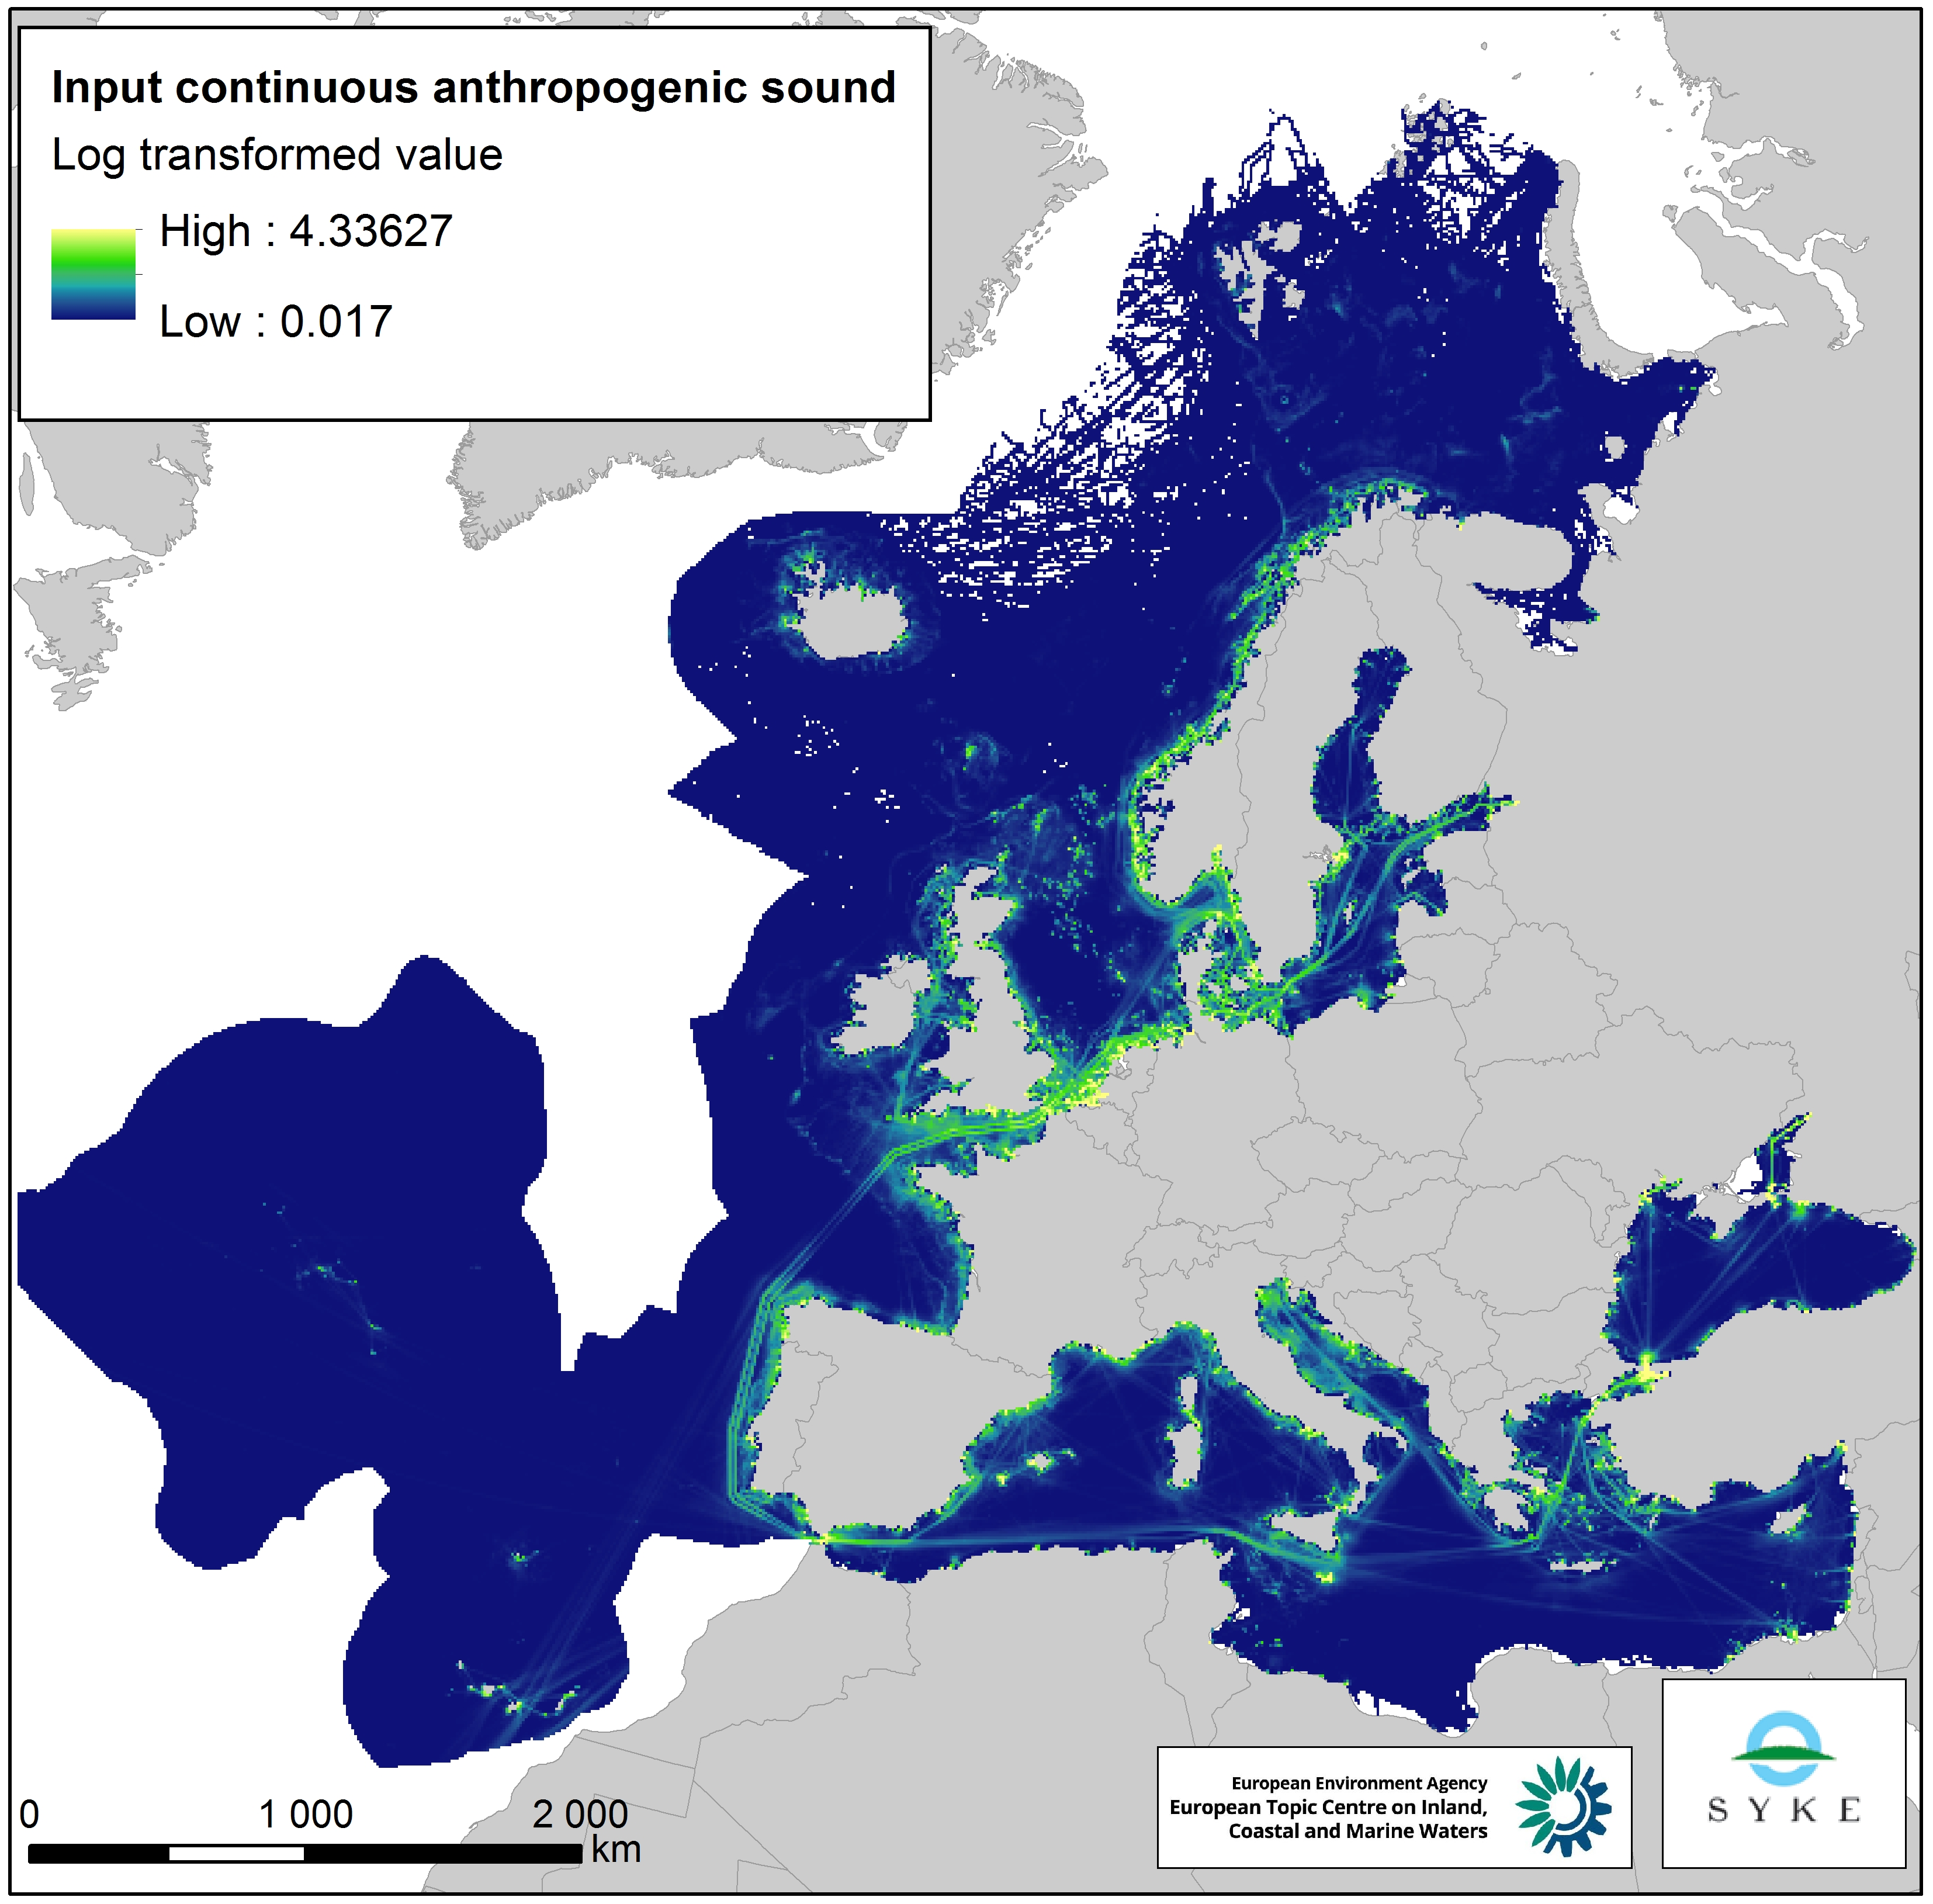
This raster dataset represents the input of continuous anthropogenic sound in the European Seas. Continuous anthropogenic underwater noise is found in the entire European marine area and is mainly produced by maritime traffic. As no thresholds for pressure have been agreed yet, even areas of low or infrequent maritime traffic are included as pressures. This dataset uses shipping density as a representation of distribution of continuous underwater noise. This dataset is based on a truncated version of the EMODnet (Automatic Identification System) AIS based vessel density dataset for 2017 (all ships, year average). The vessel density was rescaled from a 1 km to 10 km resolution (mean values) using the EEA 10 km grid. The dataset has been transformed to a logarithmic scale (ln1). This dataset has been prepared for the calculation of the combined effect index, produced for the ETC/ICM Report 4/2019 "Multiple pressures and their combined effects in Europe's seas" available on: https://www.eionet.europa.eu/etcs/etc-icm/etc-icm-report-4-2019-multiple-pressures-and-their-combined-effects-in-europes-seas-1.
-
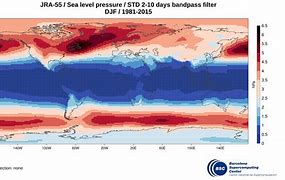
JRA55-do is a surface dataset for driving ocean-sea ice models and used in phase 2 of OMIP (OMIP-2). JRA55-do corrects the atmospheric reanalysis product JRA-55 (Kobayashi et al., 2015) using satellite and other atmospheric reanalysis products. The merits of JRA55-do are the high horizontal resolution (~55 km) and temporal interval (3 h). An assessment by Tsujino et al. (2020) implies that JRA55-do can suitably replace the current CORE/OMIP-1 dataset. This reanalysis of atmospheric variables is provided by the Japanese Meteorological Agency starting in the year 1958 and will be used to drive the coupled NEMO-ERSEM model in the hindcast configuration.
-
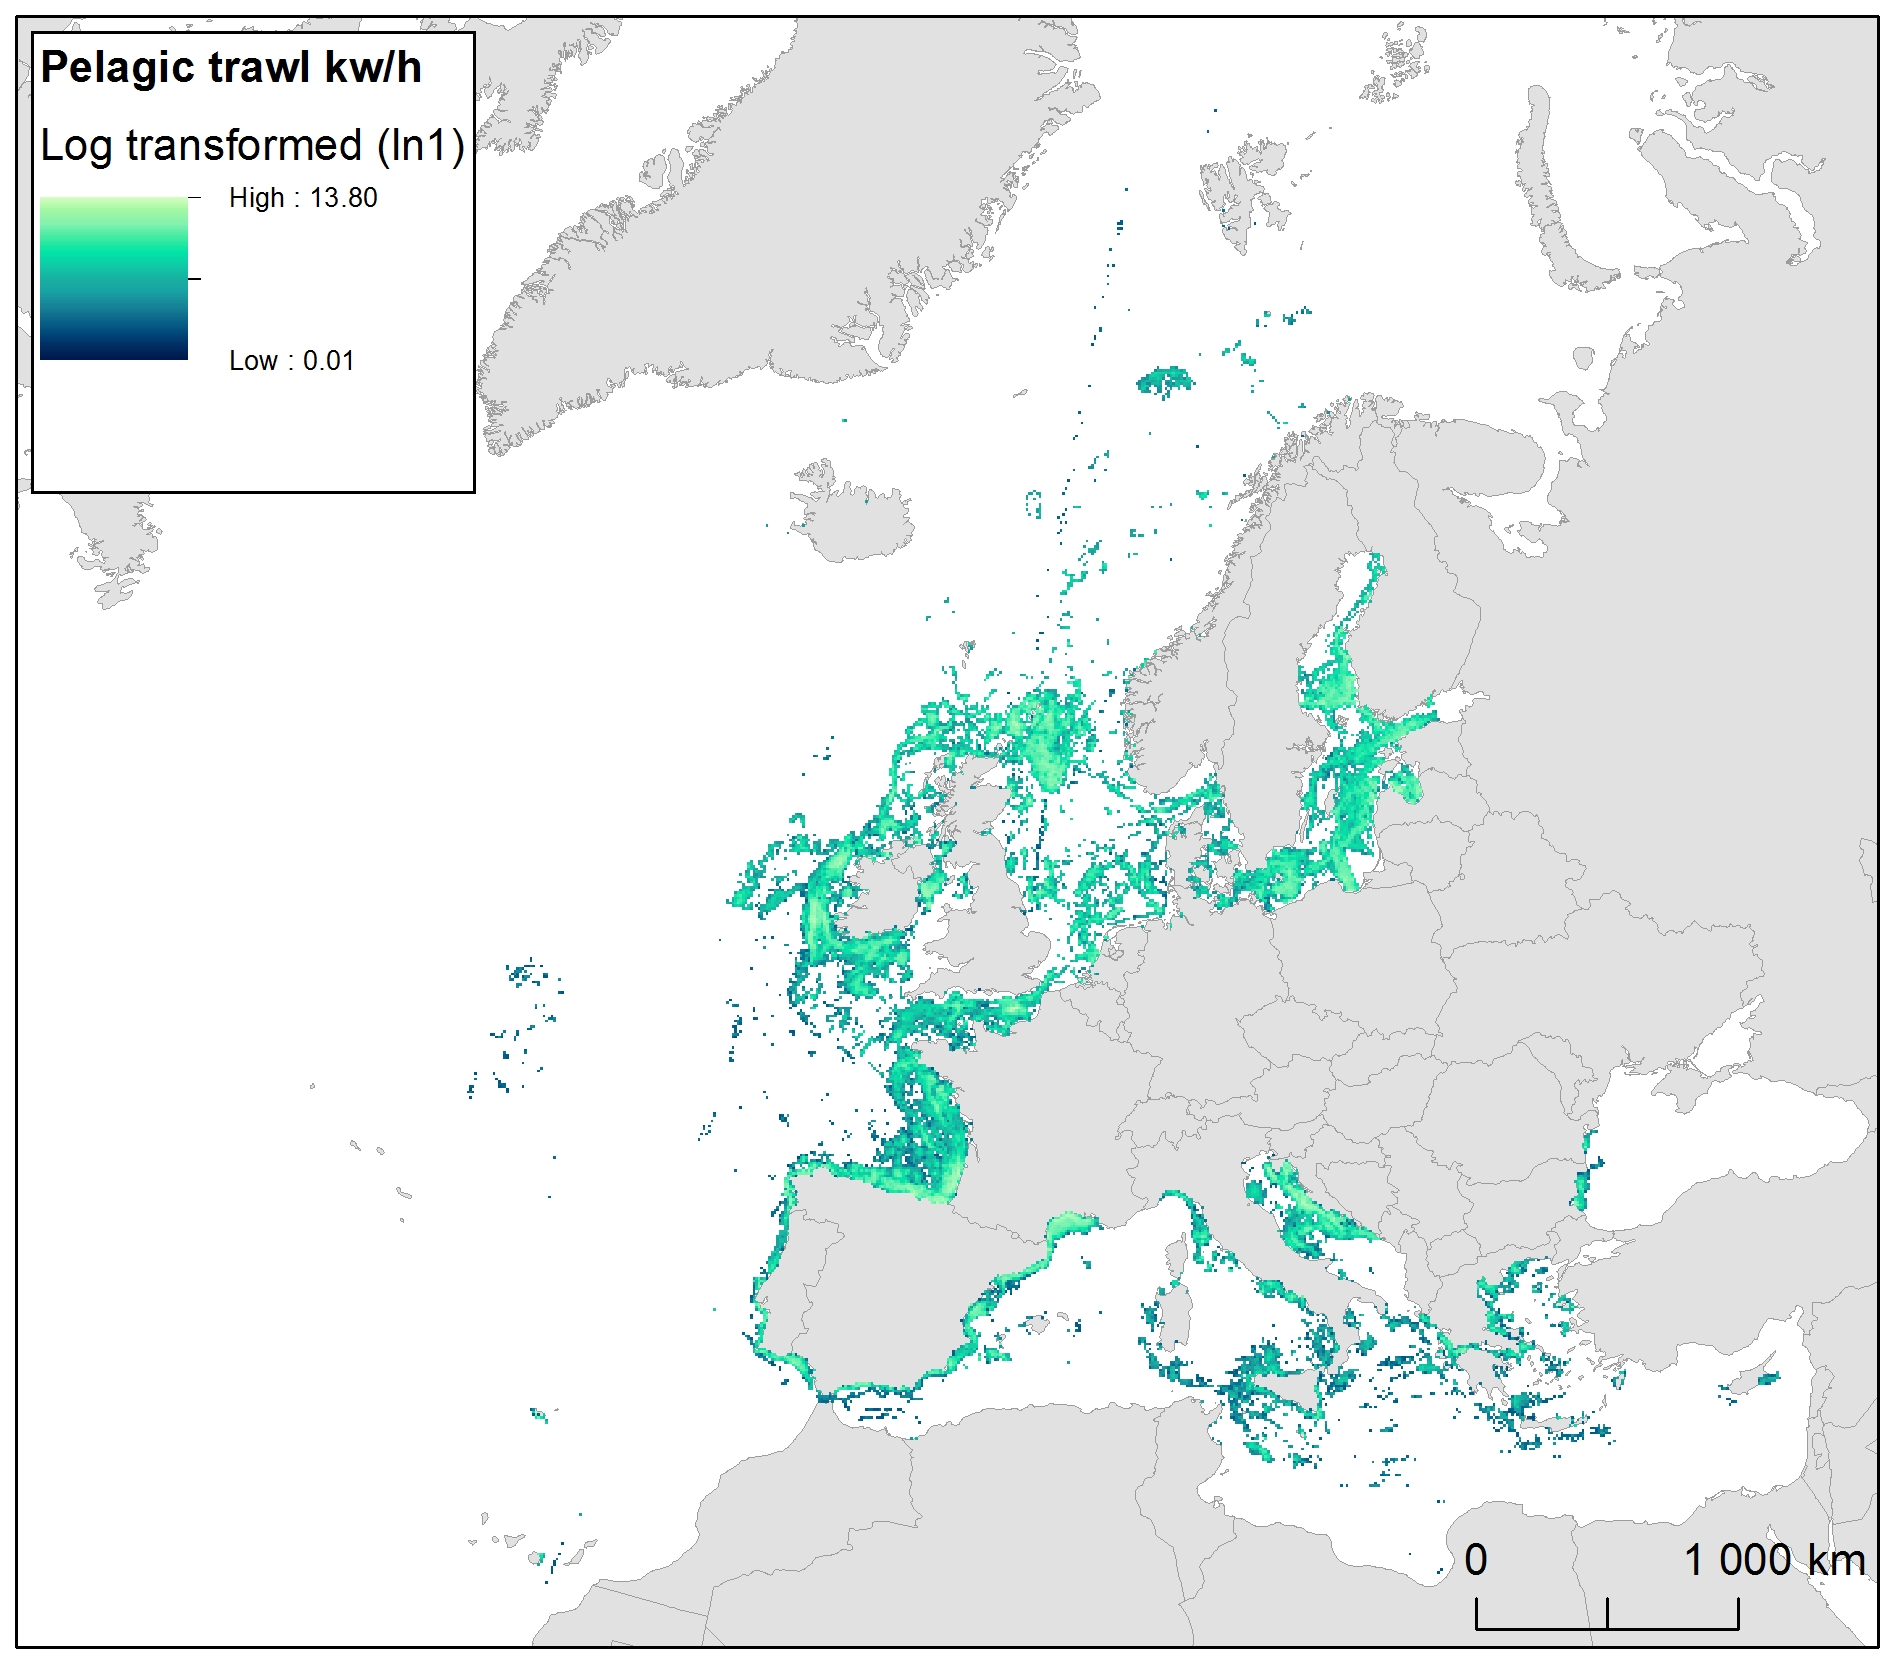
The raster dataset represents fishing intensity (kilowatt per fishing hour) by pelagic towed gears in the European seas. The dataset has been derived from Automatic Identification System (AIS) based pelagic fishing intensity data received from the European Commission’s Joint Research Centre - Independent experts of the Scientific, Technical and Economic Committee for Fisheries (JRC STECF), as well as from Vessel Monitoring System (VMS) and logbook based pelagic fishing effort data from HELCOM Commission. The temporal extent varies between the data sources (between 2013 and 2015). The dataset has been transformed to a logarithmic scale (ln1). This dataset has been prepared for the calculation of the combined effect index, produced for the ETC/ICM Report 4/2019 "Multiple pressures and their combined effects in Europe's seas" available on: https://www.eionet.europa.eu/etcs/etc-icm/etc-icm-report-4-2019-multiple-pressures-and-their-combined-effects-in-europes-seas-1.
-
-
-
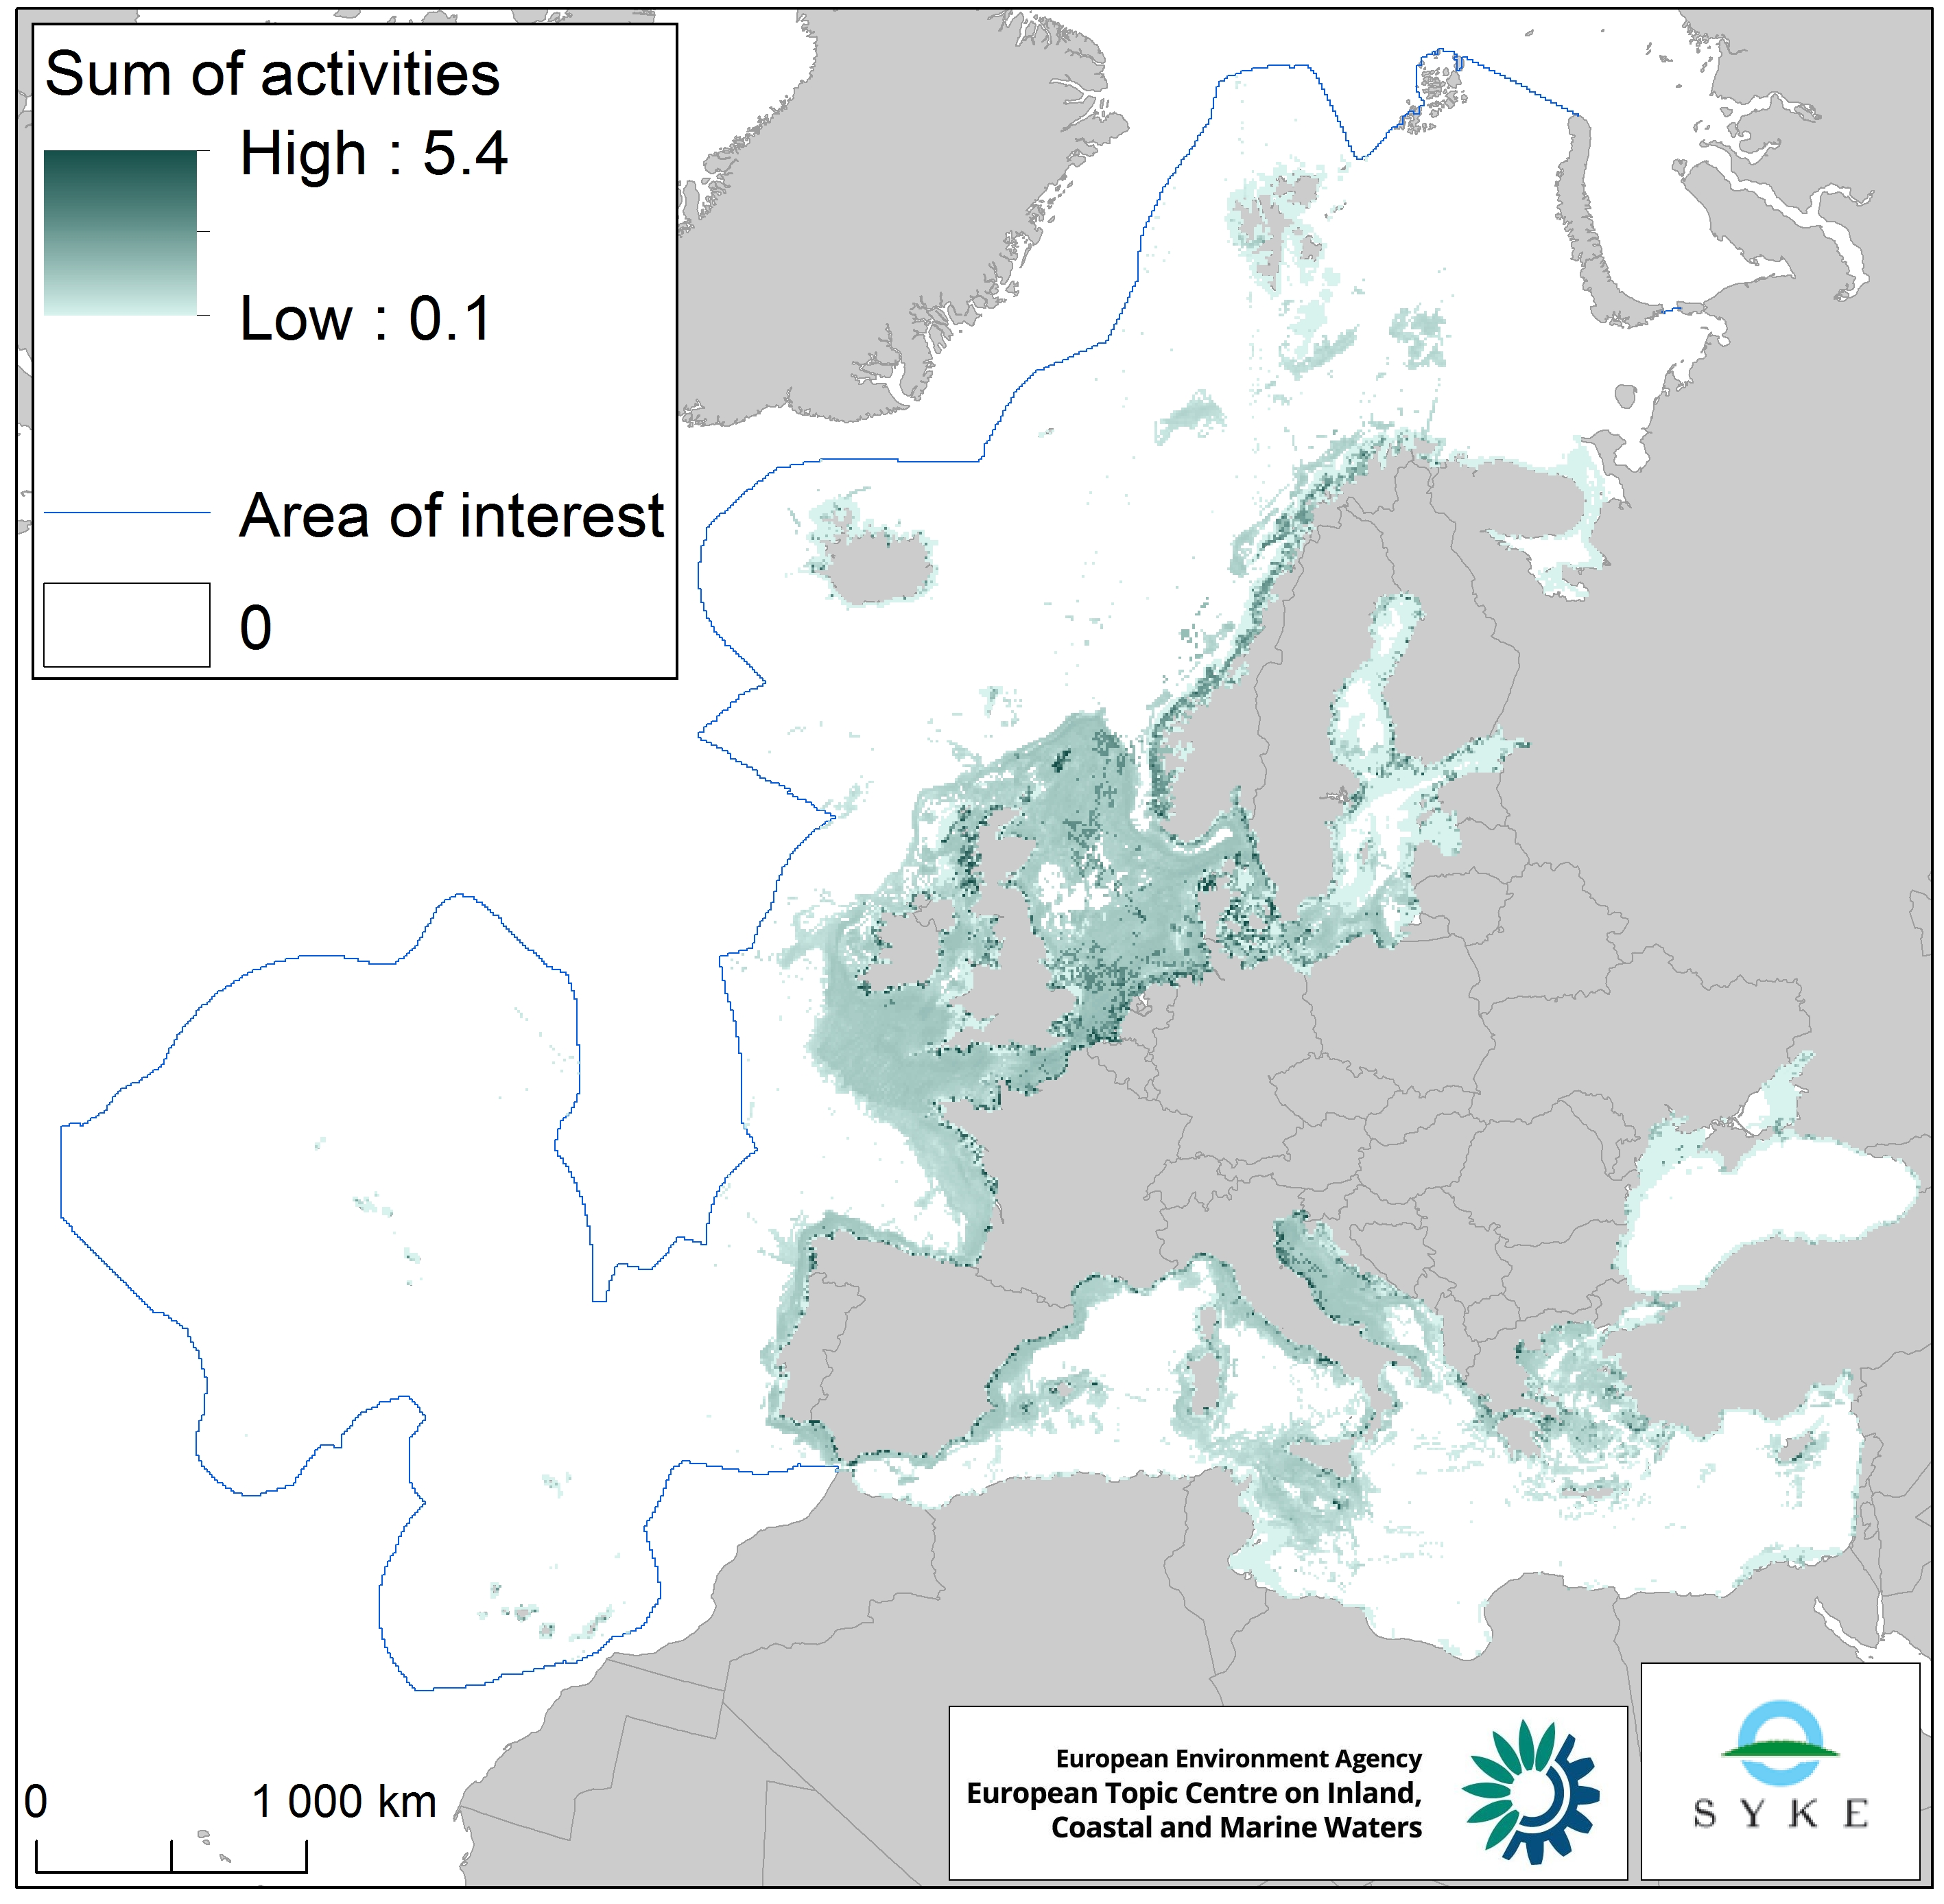
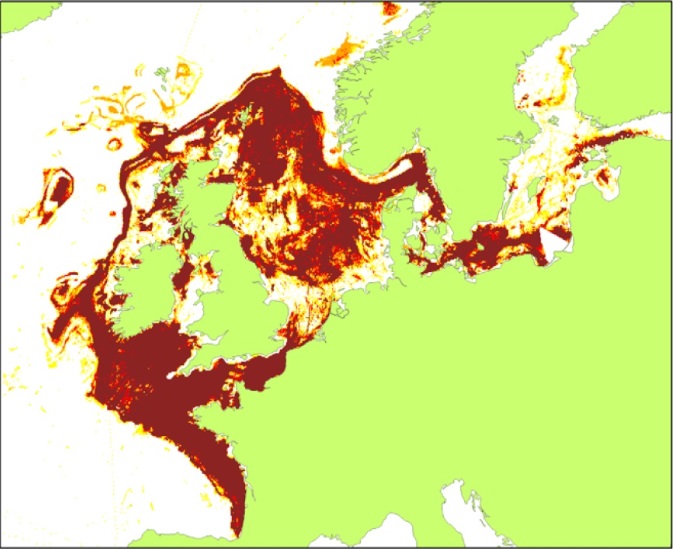
This raster dataset represents physical disturbance to the seabed in the European seas. Several human activities disturb the seabed either directly or indirectly. Alteration of benthic living conditions as a result of increased sedimentation or attenuation of light penetration, abrasion of the seabed and exploitation of benthic biota, temporarily disturb the benthic habitat quality. The dataset is an aggregation of several different human activities that cause physical disturbance to the seabed: aquaculture, demersal fishing, dredging and dumping of dredged material, oil and gas rigs, offshore installations, ports, sand and gravel extraction, shellfish mariculture, shipping in shallow waters and windfarms. The resulting dataset is a raster (10km grid cell) derived from EMODnet, MED-IAMER, JRC-STECF, OSPAR, HELCOM and 4C Offshore datasets, and with reference temporal coverage from 2012 to 2017. This dataset has been prepared for the calculation of the combined effect index, produced for the ETC/ICM Report 4/2019 "Multiple pressures and their combined effects in Europe's seas" available on: https://www.eionet.europa.eu/etcs/etc-icm/etc-icm-report-4-2019-multiple-pressures-and-their-combined-effects-in-europes-seas-1.
-
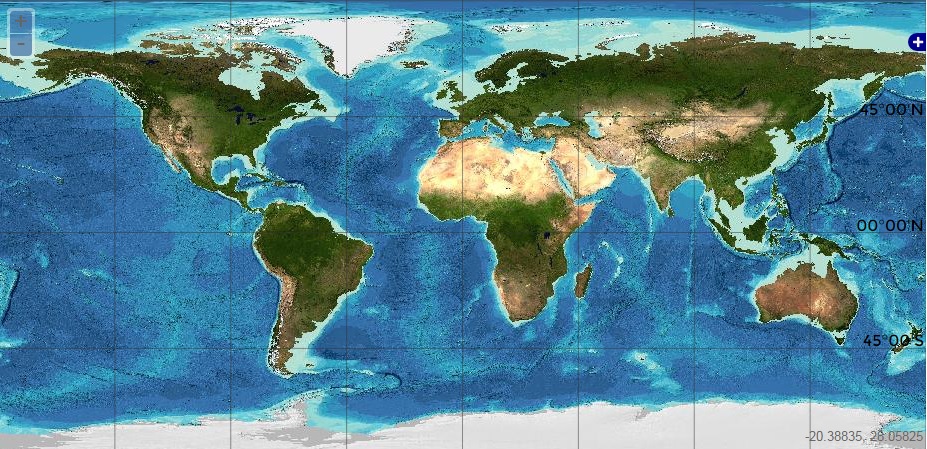
The GEBCO_2020 Grid was released in May 2020 and is the second global bathymetric product released by the General Bathymetric Chart of the Oceans (GEBCO) and has been developed through the Nippon Foundation-GEBCO Seabed 2030 Project. The GEBCO_2020 Grid provides global coverage of elevation data in meters on a 15 arc-second grid of 43200 rows x 86400 columns, giving 3,732,480,000 data points. Grid Development The GEBCO_2020 Grid is a continuous, global terrain model for ocean and land with a spatial resolution of 15 arc seconds. The grid uses as a ‘base’ Version 2 of the SRTM15+ data set (Tozer et al, 2019). This data set is a fusion of land topography with measured and estimated seafloor topography. It is augmented with the gridded bathymetric data sets developed by the four Seabed 2030 Regional Centers. The Regional Centers have compiled gridded bathymetric data sets, largely based on multibeam data, for their areas of responsibility. These regional grids were then provided to the Global Center. For areas outside of the polar regions (primarily south of 60°N and north of 50°S), these data sets are in the form of 'sparse grids', i.e. only grid cells that contain data were populated. For the polar regions, complete grids were provided due to the complexities of incorporating data held in polar coordinates. The compilation of the GEBCO_2020 Grid from these regional data grids was carried out at the Global Center, with the aim of producing a seamless global terrain model. In contrast to the development of the previous GEBCO grid, GEBCO_2019, the data sets provided as sparse grids by the Regional Centers were included on to the base grid without any blending, i.e. grid cells in the base grid were replaced with data from the sparse grids. This was with aim of avoiding creating edge effects, 'ridges and ripples', at the boundaries between the sparse grids and base grid during the blending process used previously. In addition, this allows a clear identification of the data source within the grid, with no cells being 'blended' values. Routines from Generic Mapping Tools (GMT) system were used to do the merging of the data sets. For the polar data sets, and the adjoining North Sea area, supplied in the form of complete grids these data sets were included using feather blending techniques from GlobalMapper software version 11.0, made available by Blue Marble Geographic. The GEBCO_2020 Grid includes data sets from a number of international and national data repositories and regional mapping initiatives. For information on the data sets included in the GEBCO_2020 Grid, please see the list of contributions included in this release of the grid (https://www.gebco.net/data_and_products/gridded_bathymetry_data/gebco_2020/#compilations).
-
-
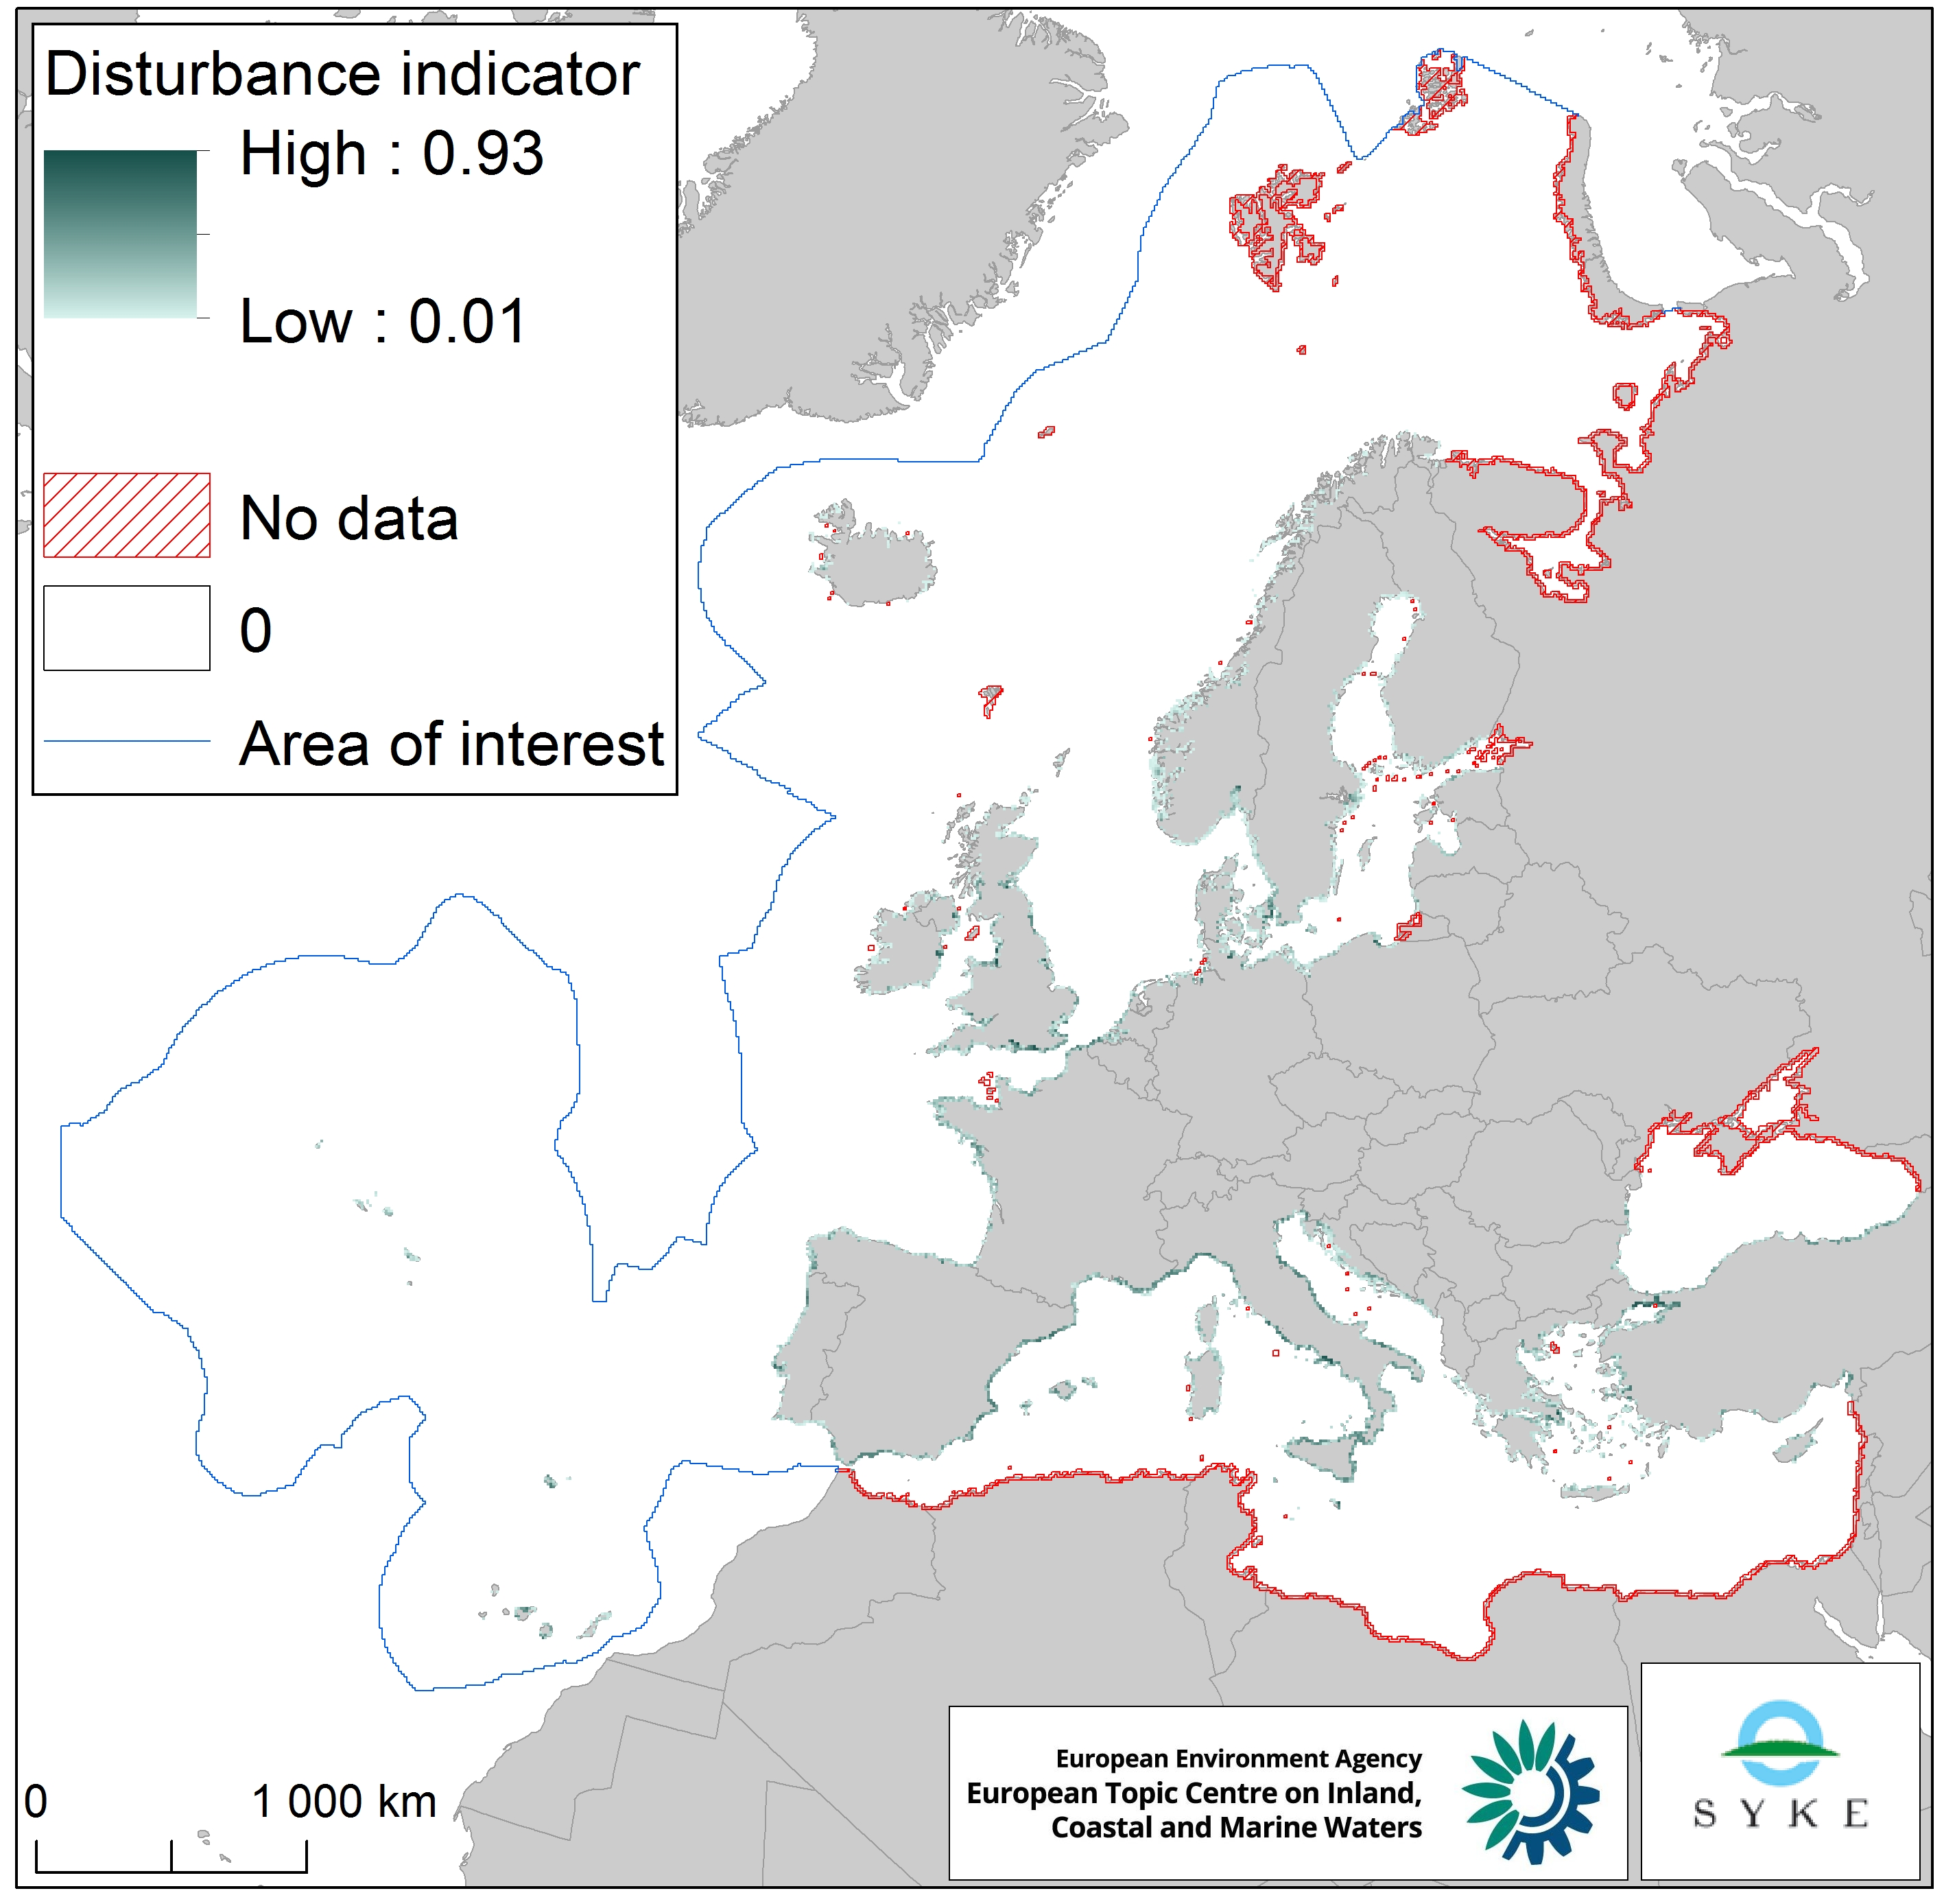
The raster dataset represents the intensity of species disturbance due to human presence along European coastlines. The dataset was created by combining the coastal urbanisation layer derived from Corine Land Cover 2012 (with the percentage of urbanised coastline per EEA 10 km grid cell) and the population density layer based on EUROSTAT NUTS 2016 data (with the population density in the NUTS 3 region corresponding to the coastal EEA 10 km grid cell). The dataset does not cover southern and western Mediterranean Sea, northern Black Sea and northernmost Atlantic Ocean. The dataset was prepared for the combined effect index produced for the ETC/ICM Report 4/2019 "Multiple pressures and their combined effects in Europe's seas" available on: https://www.eionet.europa.eu/etcs/etc-icm/etc-icm-report-4-2019-multiple-pressures-and-their-combined-effects-in-europes-seas-1.