 Catalogue PIGMA
SHP
Type of resources
Available actions
Topics
Keywords
Contact for the resource
Provided by
Years
Formats
Representation types
Update frequencies
status
Scale
Resolution
-
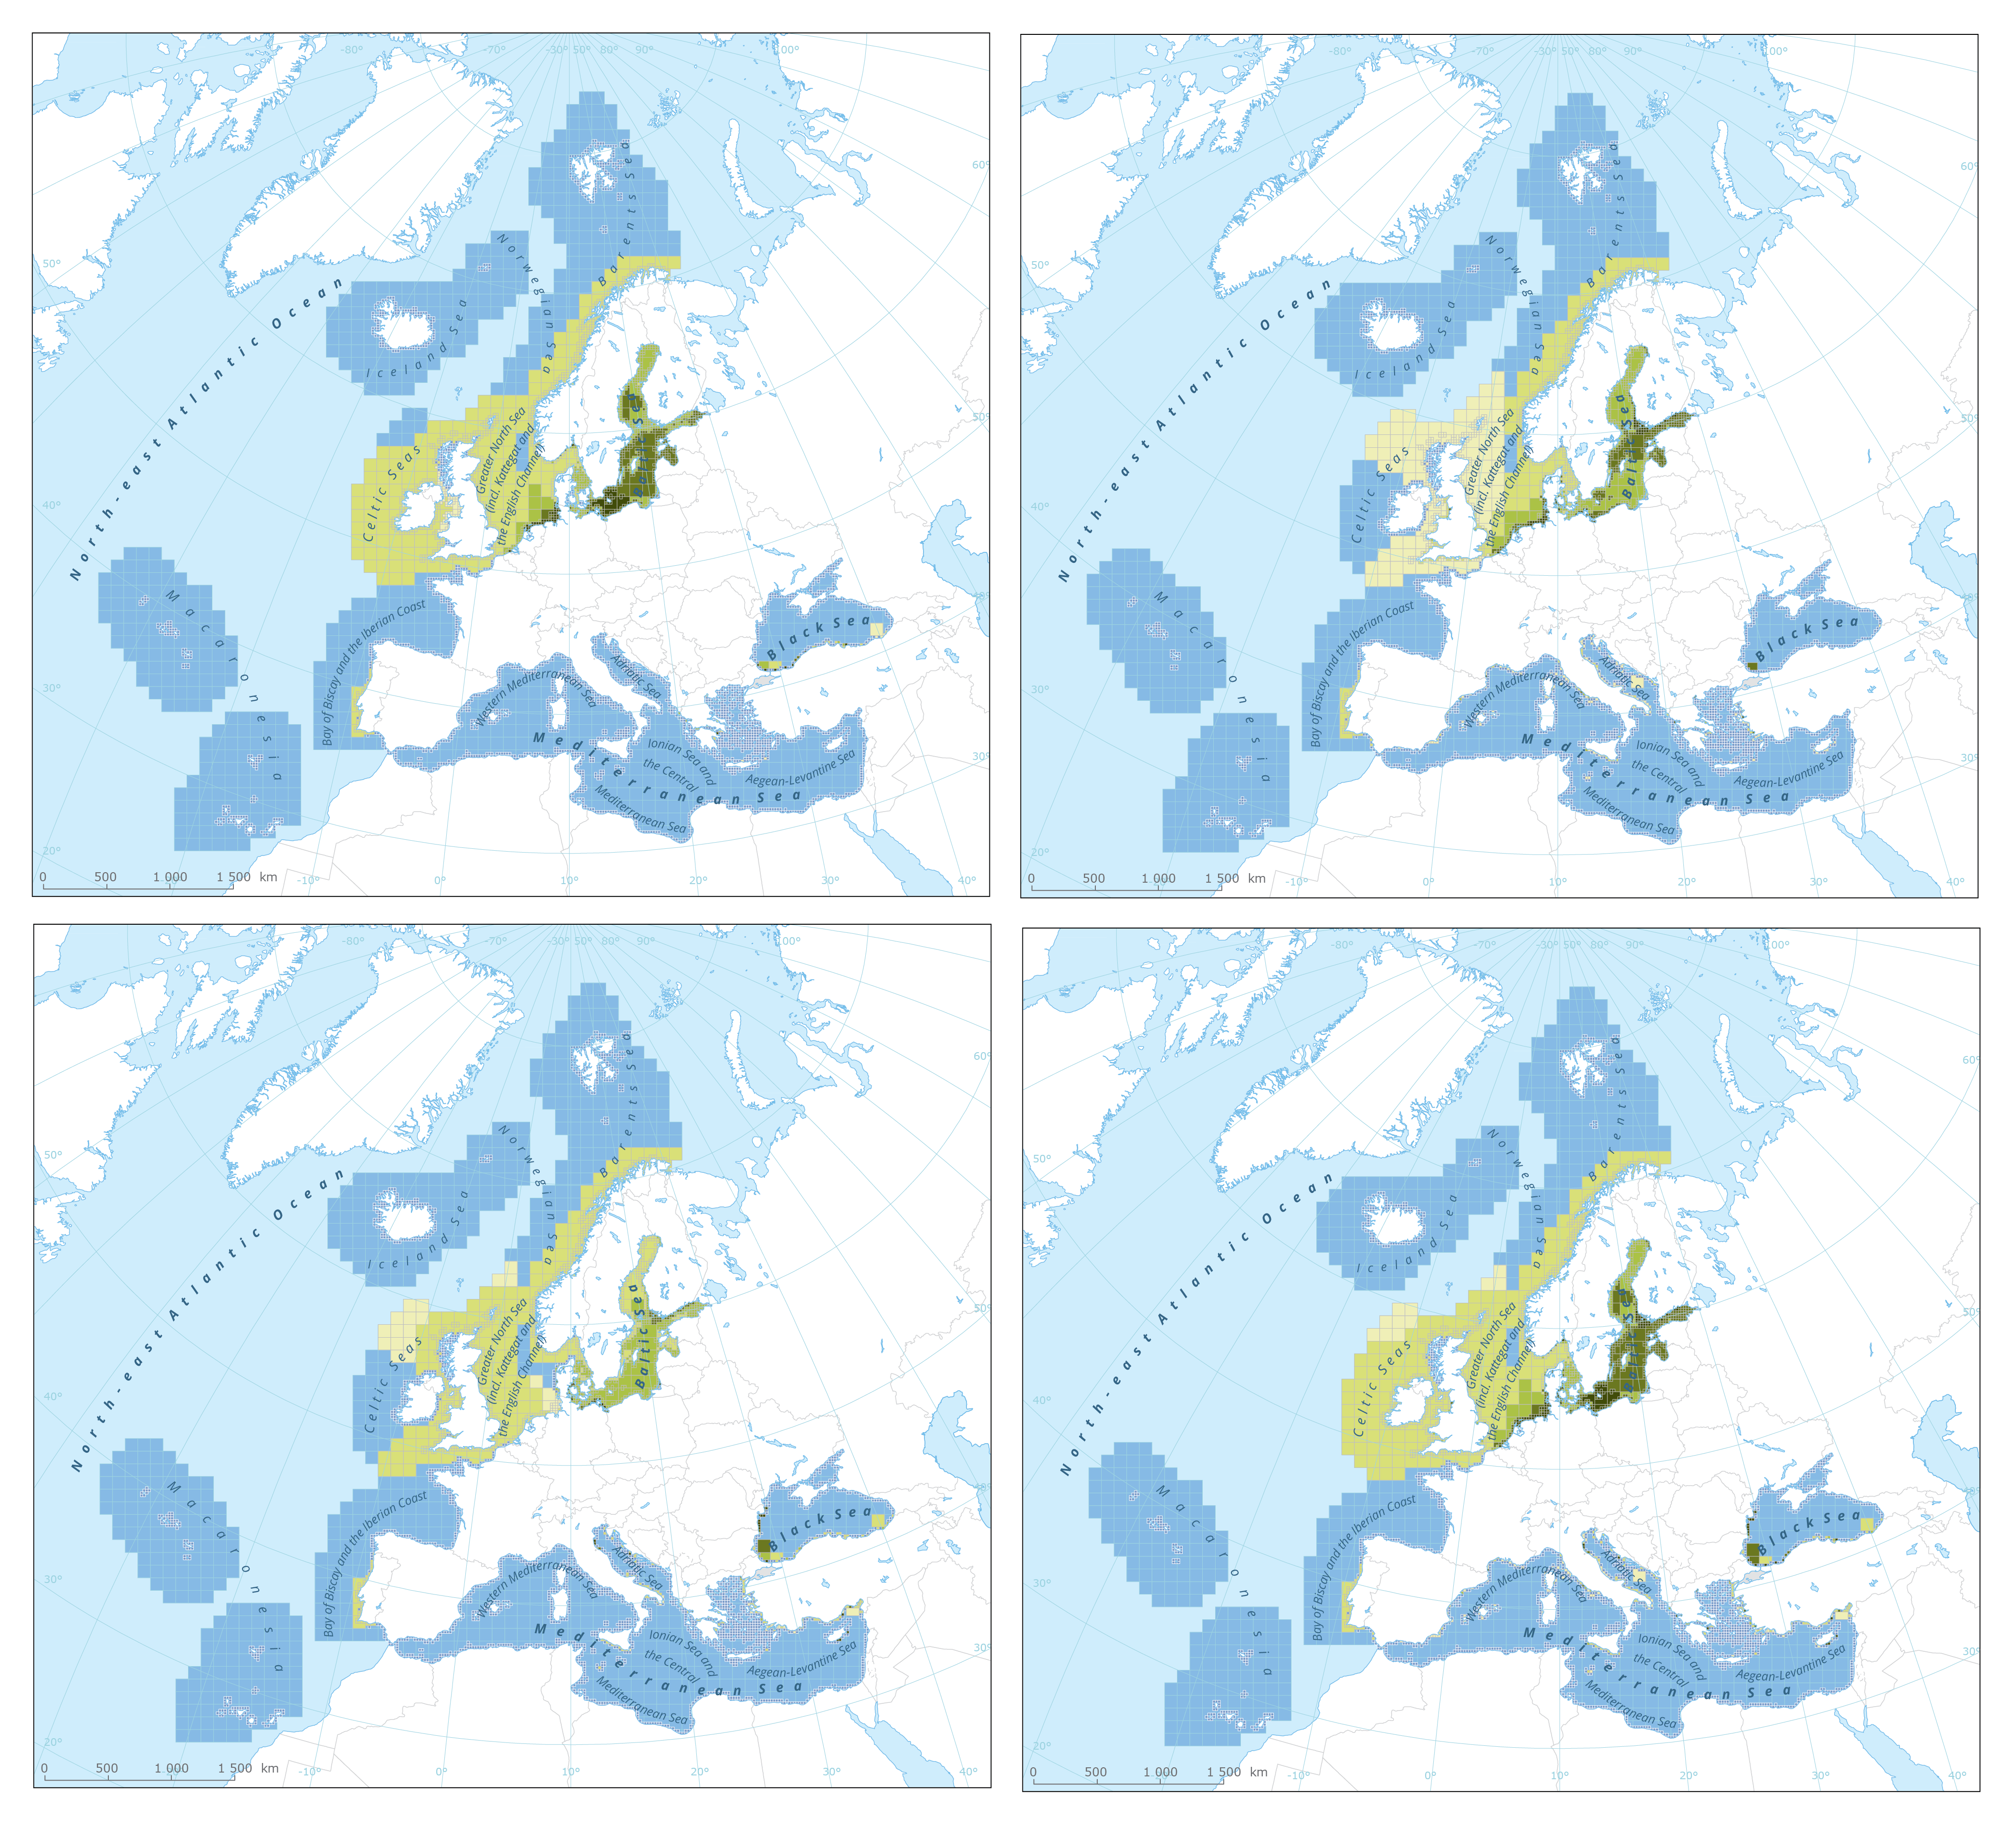
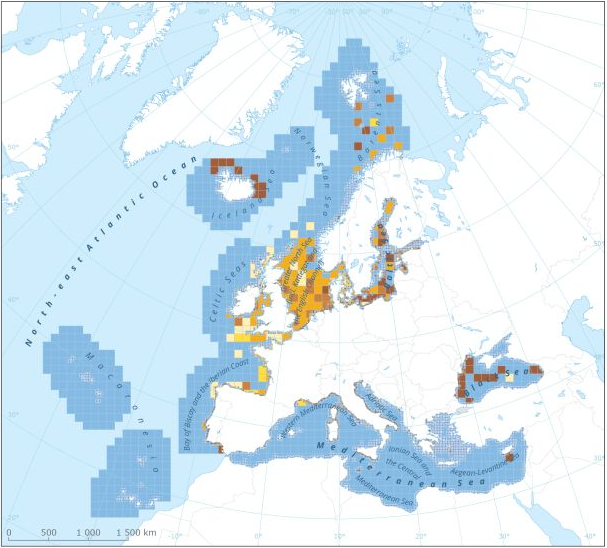
This dataset presents the resulting assessment grid (based on the EEA reference grid) with the classification of chemical status of the transitional, coastal and marine waters in the context of the Water Framework Directive (WFD) and the Marine Strategy Framework Directive (MSFD). This classification has been performed using the CHASE+ tool, with classifications of the matrices ‘water’, ‘sediment’ and ‘biota’ and indicators of ‘biological effects’, as well as an integrated classification of chemical status, combining results of all matrices. The chemical status is evaluated in five classes, where NPAhigh and NPAgood are recognised as ‘non-problem areas’ and PAmoderate, PApoor and PAbad are recognised as ‘problem areas’. This is the assessment made excluding concentrations of metals. The overall area of interest used is based on the marine regions and subregions under the Marine Strategy Framework Directive. Additionally, Norwegian (Barent Sea and Norwegian Sea) and Icelandic waters (’Iceland Sea’) have been added (see Surrounding seas of Europe). Note that within the North East Atlantic region only the subregions within EEZ boundaries (~200 nm) have been included. This dataset underpins the findings and cartographic representations published in the report "Contaminants in Europe's Seas" (EEA, 2019).
-
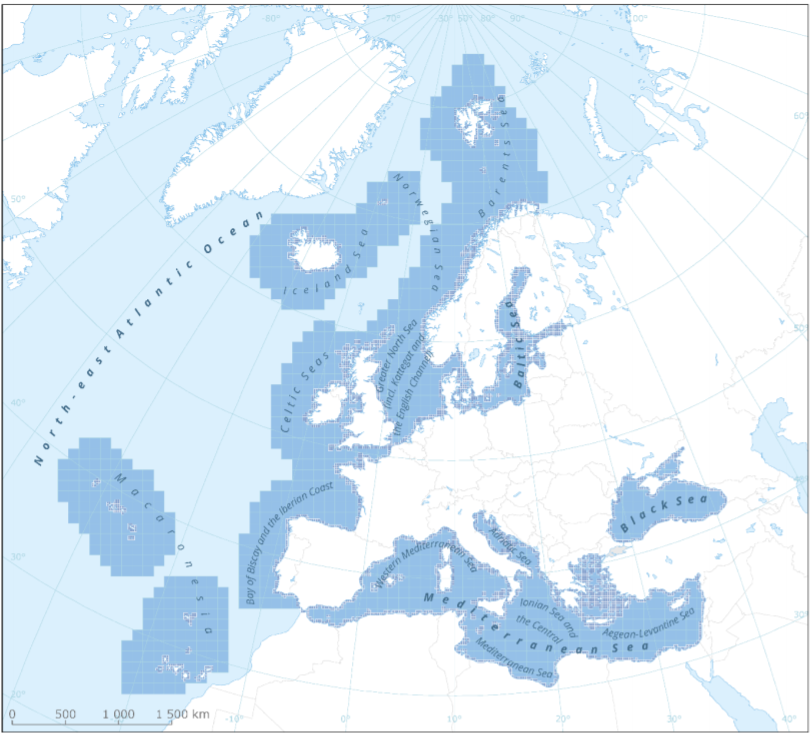
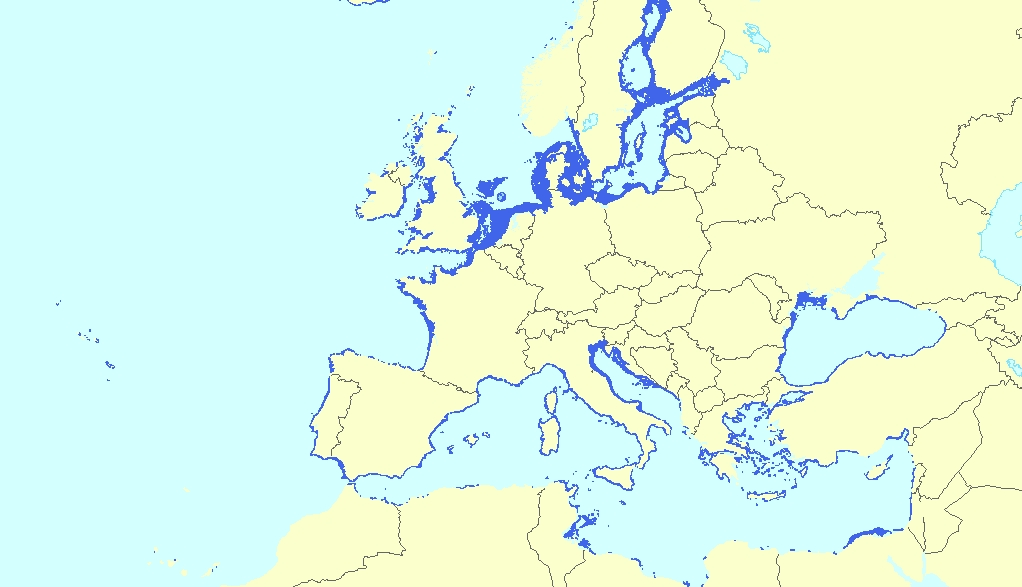
This metadata refers to the EEA marine assessment grid, to which all data and assessment results have been spatially mapped in order to ensure that data can be compared in a uniform way across the European regional seas. The marine assessment grid is based on the EEA reference grid system. The EEA reference grid is based on ERTS89 Lambert Azimuthal Equal Area projection with parameters: latitude of origin 52° N, longitude of origin 10° E, false northing 3 210 000.0 m, false easting 4 321 000.0 m. All grid cells are named with a unique identifier containing information on grid cell size and the distance from origin in meters (easting and northing). An important attribute of the EEA reference grid system is that by using an equal area projection all grid cells are having the same area for the same grid size. In this marine assessment grid, two grid sizes are used: * 100 x 100 km in offshore areas (> 20 km from the coastline) * 20 x 20 km in coastal areas (<= 20 km from the coastline) The grid sizes were choosen after an evaluation of data availability versus the need for sufficient detail in the resulting assessment. The resulting assessment grid is a combination of two grid sizes using the EEA reference grid system. The overall area of interest used in the grid is based on the marine regions and subregions under the Marine Strategy Framework Directive (MSFD). Additionally, Norwegian (Barent Sea and Norwegian Sea) and Icelandic waters (’Iceland Sea’) have been added (see Surrounding seas of Europe). Note that, within the North East Atlantic region, only the subregions within EEZ boundaries (~200 nm) have been included.
-
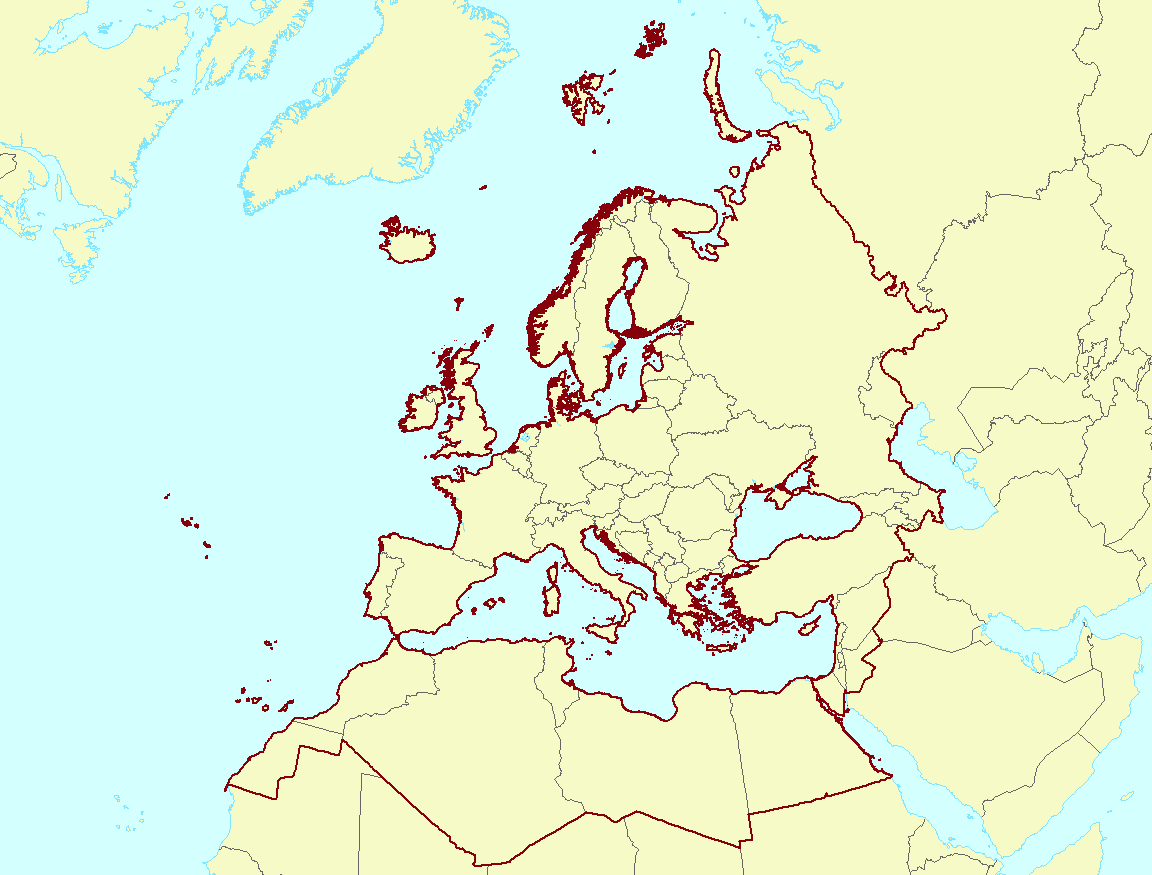
The EEA coastline for analysis is created for highly detailed analysis, e.g. 1:100 000, for geographical Europe. The coastline is a hybrid product obtained from projects using satellite imagery as data source: EUHYDRO (https://land.copernicus.eu/imagery-in-situ/eu-hydro) and GSHHG (http://www.soest.hawaii.edu/pwessel/gshhg/). The defining criteria was altitude level = 0 from EUDEM (https://land.copernicus.eu/pan-european/satellite-derived-products/eu-dem/view). Outside the coverage of the EUDEM, the coastline from GSHHG was used without modifications. A few manual amendments to the dataset were necessary to meet requirements from EU Nature Directives, Water Framework Directive and Marine Strategy Framework Directive. In 2015, several corrections were made in the Kalogeroi Islands (coordinates 38.169, 25.287) and two other Greek little islets (coordinates 36.766264, 23.604318), as well as in the peninsula of Porkkala (around coordinates 59.99, 24.42). In this revision (v3, 2017), 2 big lagoons have been removed from Baltic region, because, according to HELCOM, are freshwater lagoons.
-
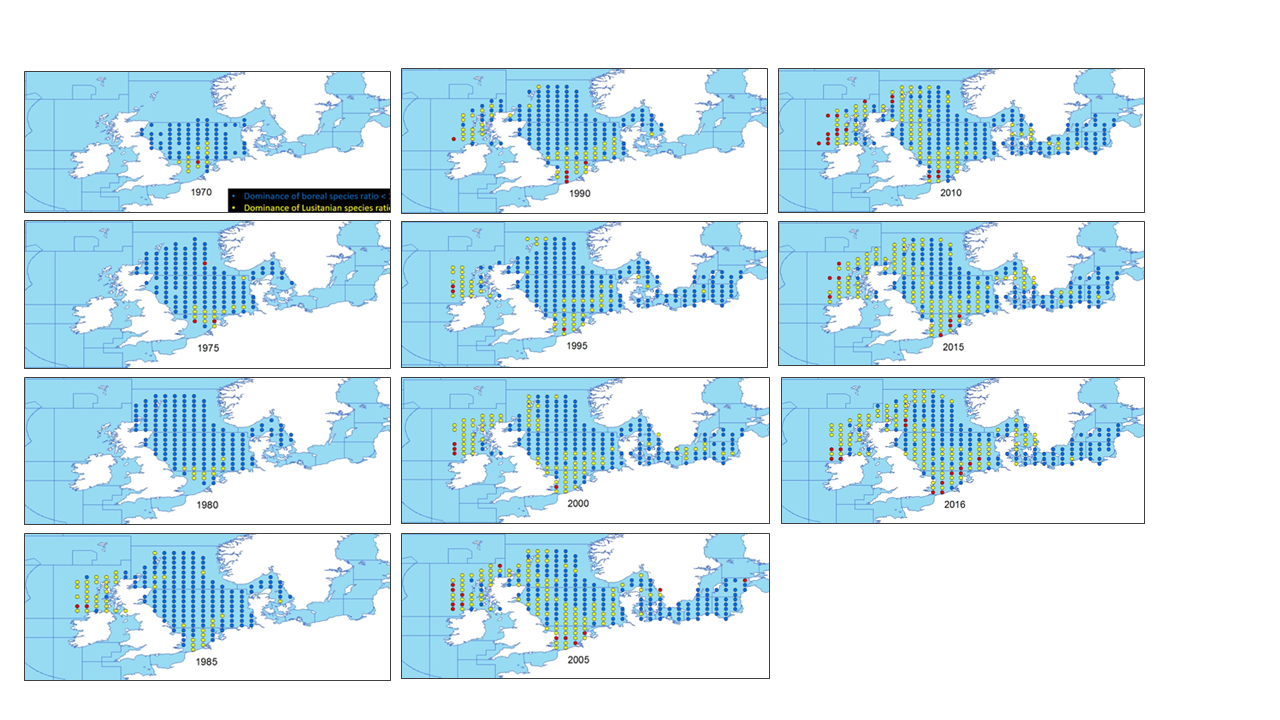
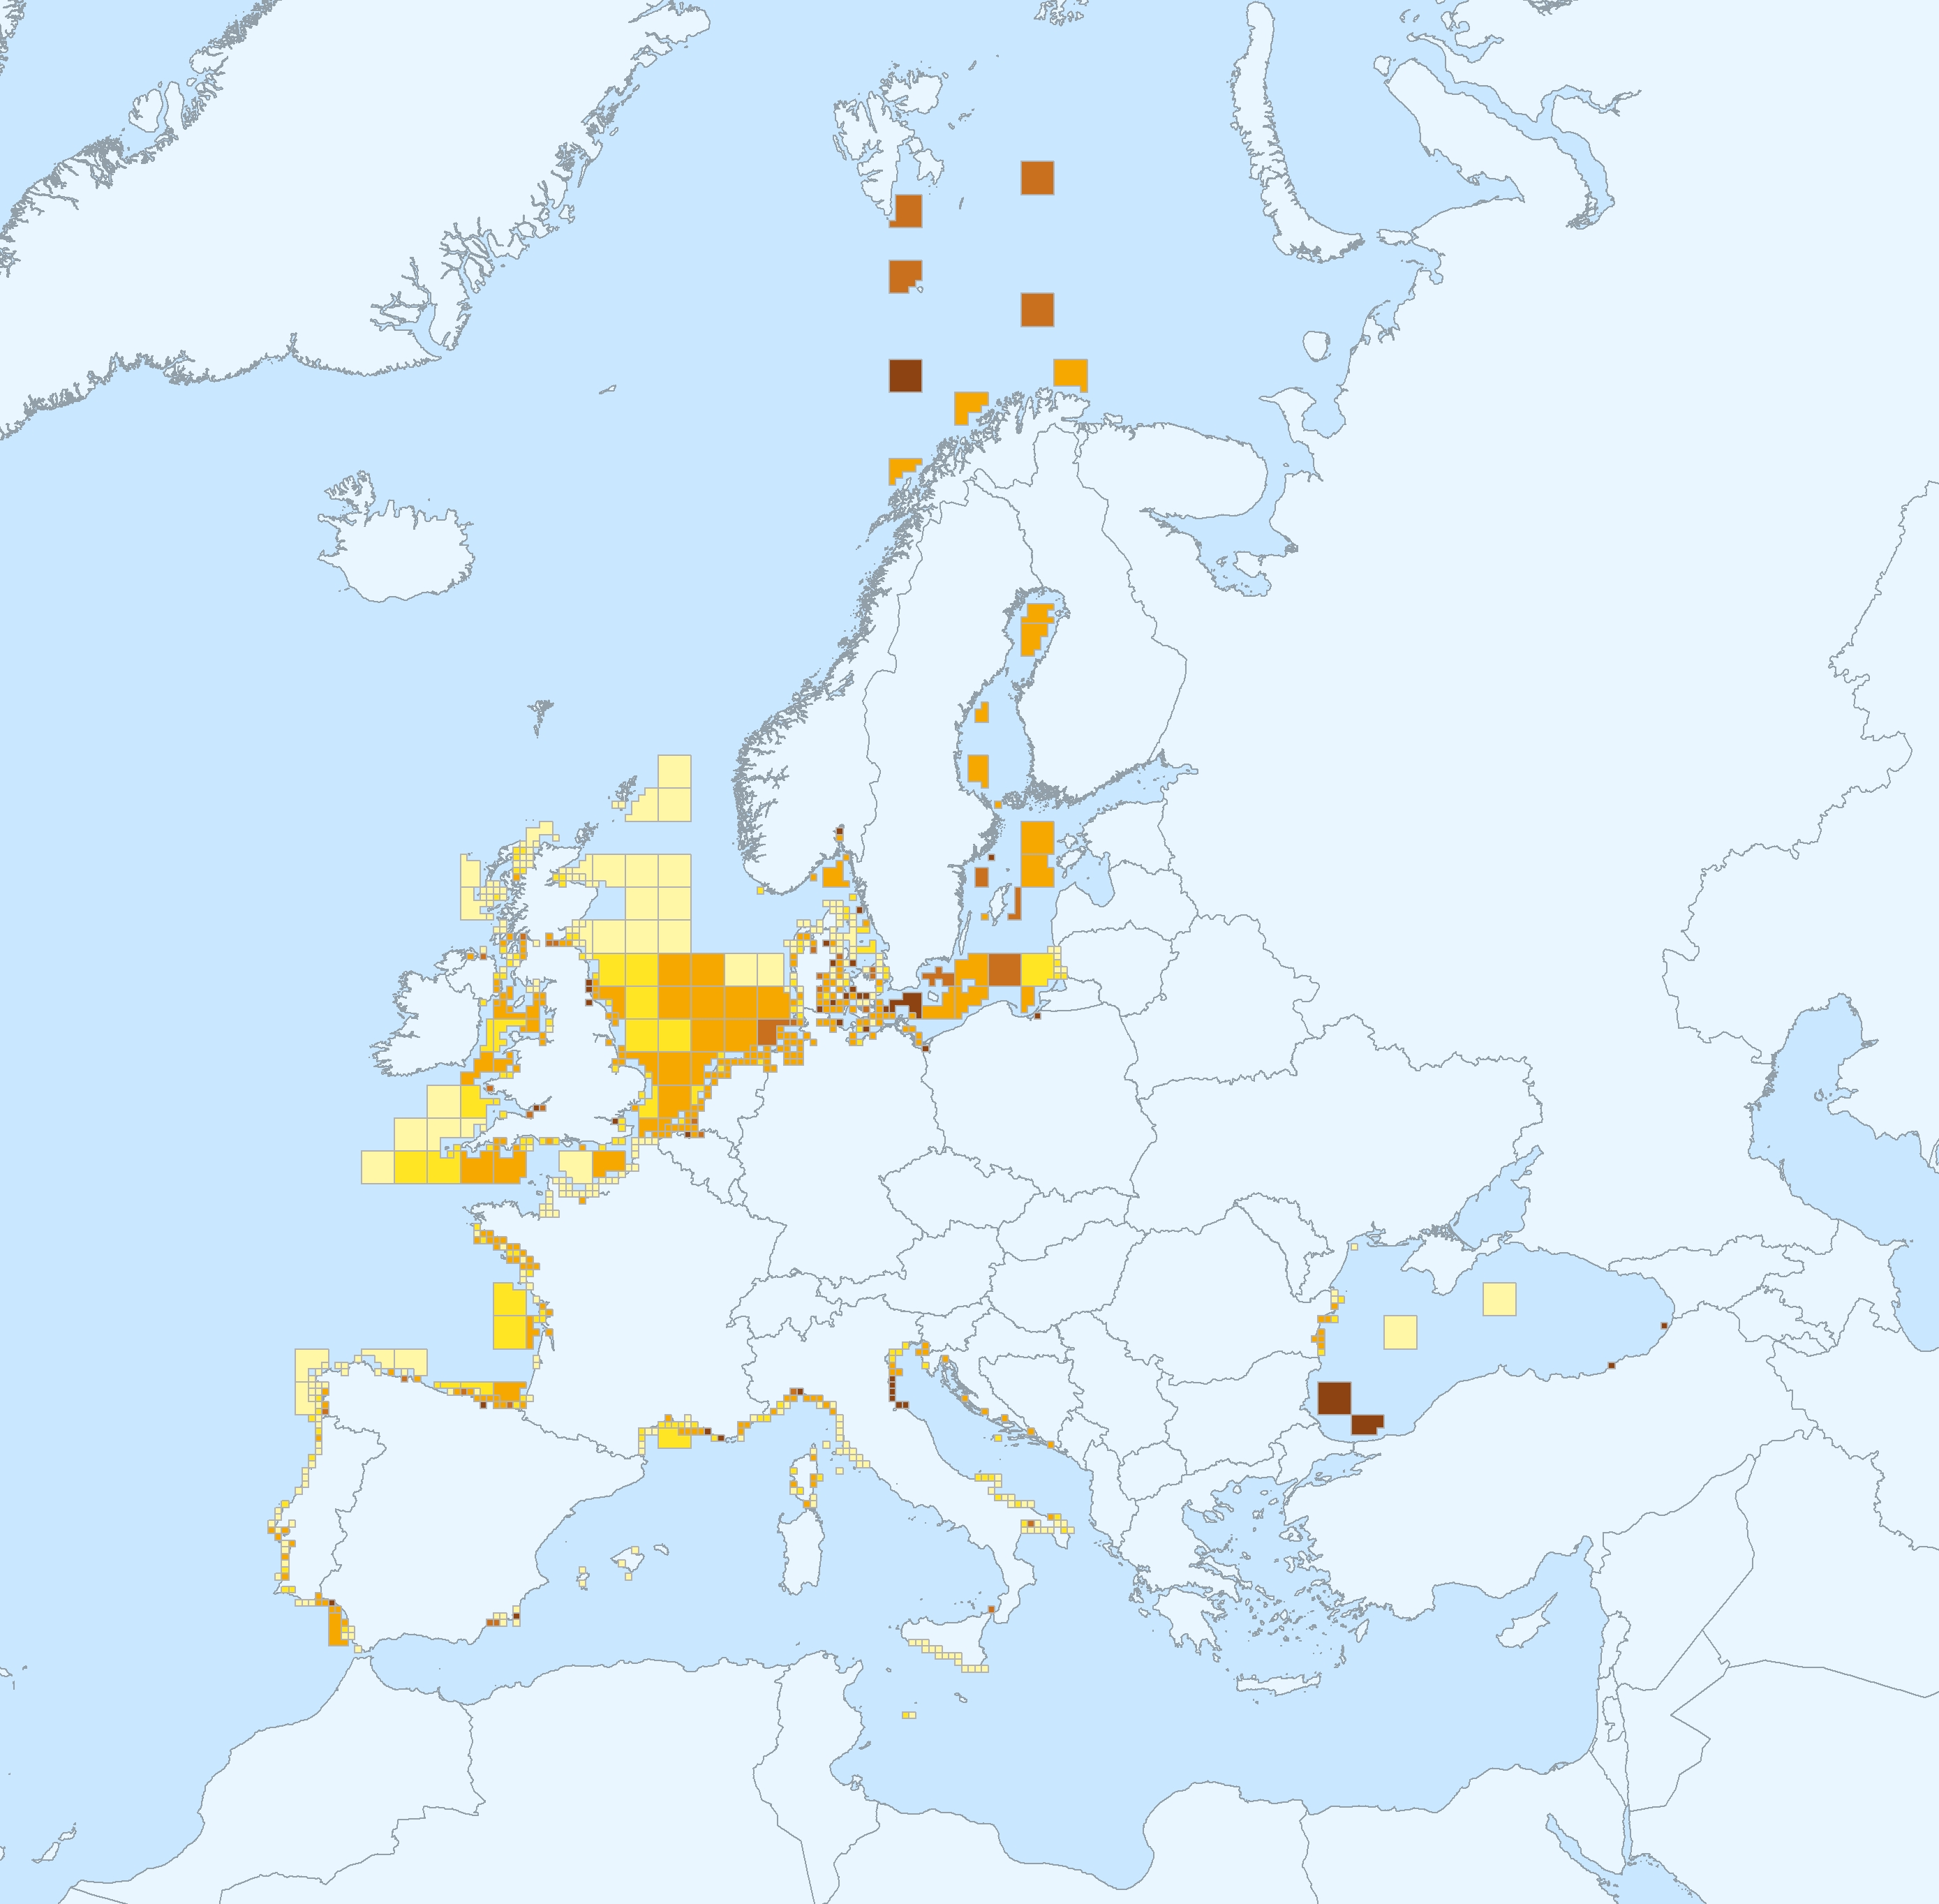
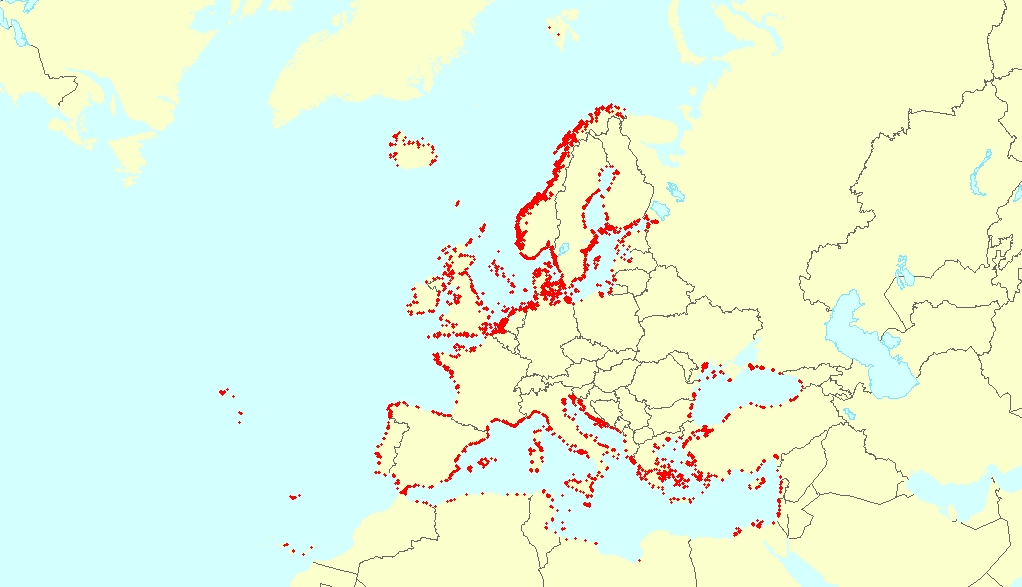
This metadata describes the ICES data on the temporal development of the Lusitanian/Boreal species ratio in the period from 19657 to 2016. Key message: The ratio between the number of Lusitanian (warm-favouring) and Boreal (cool-favouring) species are significantly increasing in several North-East Atlantic marine areas whereas there is no significant changes in all the southern areas. Changes in ratios are most apparent in the North Sea, Irish Sea and West of Scotland. Furthermore, it seems that Lusitanian species have not spread in all northward directions, but have followed two particular routes, through the English Channel and north around Scotland Blue dots indicates L/B ratios below 1 (dominance of Boreal species) Yellow dots indicates L/B ratios >=1 and <2 (dominance of Lusitanian species) Red dots indicates L/B ratios >=2 (high dominance of Lusitanian species) The dataset is derived from the ICES data portal 'DATRAS' (the Database of Trawl Surveys). DATRAS is an online database of trawl surveys with access to standard data products. DATRAS stores data collected primarily from bottom trawl fish surveys coordinated by ICES expert groups. The survey data are covering the Baltic Sea, Skagerrak, Kattegat, North Sea, English Channel, Celtic Sea, Irish Sea, Bay of Biscay and the eastern Atlantic from the Shetlands to Gibraltar. At present, there are more than 56 years of continuous time series data in DATRAS, and survey data are continuously updated by national institutions. The dataset has been used in the EEA Indicator "Changes in fish distribution in European seas" https://www.eea.europa.eu/data-and-maps/indicators/fish-distribution-shifts/assessment-1. The dataset has been used for this static map: https://www.eea.europa.eu/en/analysis/indicators/changes-in-fish-distribution-in/temporal-development-of-the-ratio
-
This vector dataset represents the benthic broad habitat types in Europe Seas potentially affected by the ship wakes. When navigating, the propellers of ships generate a turbulent mixing of the water that can produce sediment re-suspension in soft bottoms of shallow areas. This can increase the turbidity in those areas, affecting the seafloor organisms (especially those that are directly dependent on light, such as aquatic plants). It may also contribute to an increase of the the eutrophication level of the ecosystem (since the turbid waters may become warmer, which may turn into a reduction of dissolved oxygen in water). Finally, turbidity can produce an increase in the inputs of contaminants and microbial pathogens, since those can become attached to the suspended solids. The dataset has been prepared in the context of the development of the first European Maritime Transport Environmental Report (https://www.eea.europa.eu/publications/maritime-transport).
-
The dataset presents the results of classification of eutrophication status of the European seas using the HEAT+ tool. Eutrophication status is evaluated in five classes, where NPAhigh and NPAgood are recognised as ‘non-problem areas’ and PAmoderate, PApoor and PAbad are recognised as ‘problem areas’. Besides the overall Eutrophication status (HEAT+) are the results shown for three aspects of eutrophication: C1) Nutrient Concentrations C2) Direct Effects C3) Indirect Effects This dataset underpins the findings and cartographic representations published in the report "Nutrient enrichment and eutrophication in Europe's seas" (EEA, 2019): https://www.eea.europa.eu/publications/nutrient-enrichment-and-eutrophication-in.
-
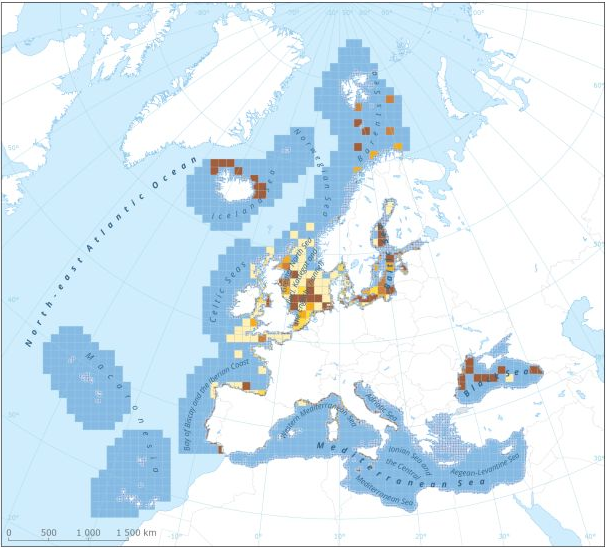
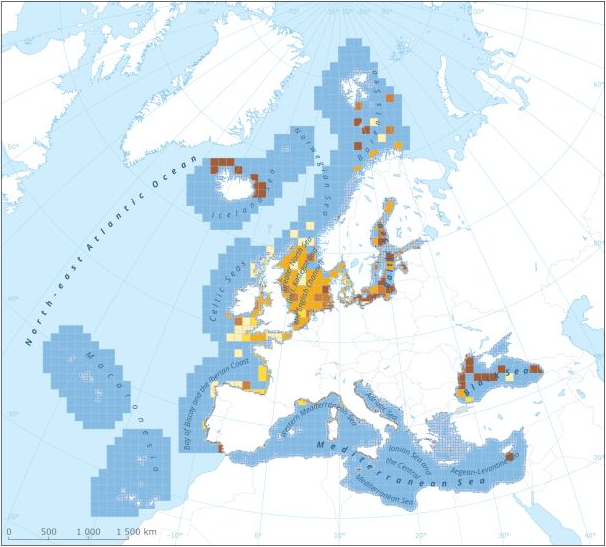
This data set presents the resulting assessment grid (based on the EEA reference grid) with the classification of chemical status of the transitional, coastal and marine waters in the context of the Water Framework Directive (WFD) and the Marine Strategy Framework Directive (MSFD), providing a mapping of contamination 'problem areas' and ‘non-problem areas’ based on measurements in the matrix "sediments". This classification has been performed using the CHASE+ tool, with classifications of the sediments matrix. The chemical status is evaluated in five classes, where NPAhigh and NPAgood are recognised as ‘non-problem areas’ and PAmoderate, PApoor and PAbad are recognised as ‘problem areas’. Most countries in Europe include marine sediments in long-term monitoring activities. Consequently, the data coverage is good, especially in southern parts of the Baltic Sea, the North Sea, the Celtic Sea, the Bay of Biscay, western parts of the Black Sea and the coastal waters of France, Italy and Portugal.The number of assessment units monitored and classified in the North-East Atlantic Ocean is 511. In the Mediterranean Sea, the number of assessment units is 153. Baltic Sea sediments are monitored on 97 assessment units while only 19 areas are assessed in the Black Sea. This data set underpins the findings and cartographic representations published in the EEA report “Contaminants in Europe’s seas” (No 25/2018). See the mentioned report for further information as well as examples of classification excluding specific groups of substances(e.g. metals, PBDEs).
-
This dataset presents the resulting assessment grid (based on the EEA reference grid) with the classification of chemical status of the transitional, coastal and marine waters in the context of the Water Framework Directive (WFD) and the Marine Strategy Framework Directive (MSFD). This classification has been performed using the CHASE+ tool, with classifications of the matrices ‘water’, ‘sediment’ and ‘biota’ and indicators of ‘biological effects’, as well as an integrated classification of chemical status, combining results of all matrices. The chemical status is evaluated in five classes, where NPAhigh and NPAgood are recognised as ‘non-problem areas’ and PAmoderate, PApoor and PAbad are recognised as ‘problem areas’. This is the assessment made excluding concentrations of mercury (Hg) and polybrominated diphenyl ethers (PBDEs) The overall area of interest used is based on the marine regions and subregions under the Marine Strategy Framework Directive. Additionally, Norwegian (Barent Sea and Norwegian Sea) and Icelandic waters (’Iceland Sea’) have been added (see Surrounding seas of Europe). Note that within the North East Atlantic region only the subregions within EEZ boundaries (~200 nm) have been included. This dataset underpins the findings and cartographic representations published in the report "Contaminants in Europe's Seas" (EEA, 2019): https://www.eea.europa.eu/publications/contaminants-in-europes-seas.
-
This dataset presents the resulting assessment grid (based on the EEA reference grid) with the classification of chemical status of the transitional, coastal and marine waters in the context of the Water Framework Directive (WFD) and the Marine Strategy Framework Directive (MSFD). This classification has been performed using the CHASE+ tool, with classifications of the matrices ‘water’, ‘sediment’ and ‘biota’ and indicators of ‘biological effects’, as well as an integrated classification of chemical status, combining results of all matrices. The chemical status is evaluated in five classes, where NPAhigh and NPAgood are recognised as ‘non-problem areas’ and PAmoderate, PApoor and PAbad are recognised as ‘problem areas’. This is the assessment made excluding concentrations of polybrominated diphenyl ethers (PBDEs) The overall area of interest used is based on the marine regions and subregions under the Marine Strategy Framework Directive. Additionally, Norwegian (Barent Sea and Norwegian Sea) and Icelandic waters (’Iceland Sea’) have been added (see Surrounding seas of Europe). Note that within the North East Atlantic region only the subregions within EEZ boundaries (~200 nm) have been included. This dataset underpins the findings and cartographic representations published in the report "Contaminants in Europe's Seas" (EEA, 2019): https://www.eea.europa.eu/publications/contaminants-in-europes-seas.
-
This vector dataset represents the benthic broad habitat types in Europe seas potentially affected by anchoring. The anchoring of vessels can produce damages to the seafloor and the loss of the habitat where it happens. It takes place in shallow waters, close to ports, where vessels have to wait for a spot in the port so they can load or offload (since ports have a limited amount of dockage). The anchoring areas allow vessels to safely anchor in protection from bad weather or other circumstances. The type of alterations to the habitats resulting from anchoring depend mainly on the dimensions and type of the anchor, as well as its movement resulting from the movement of the vessel due to currents or waves, which can increase the adverse effects. The dataset has been prepared in the context of the development of the first European Maritime Transport Environmental Report (to be published as an EMSA-EEA report in 2021).