Catalogue PIGMA
*
Type of resources
Available actions
Topics
Keywords
Contact for the resource
Provided by
Years
Formats
Representation types
Update frequencies
status
Service types
Scale
Resolution
-
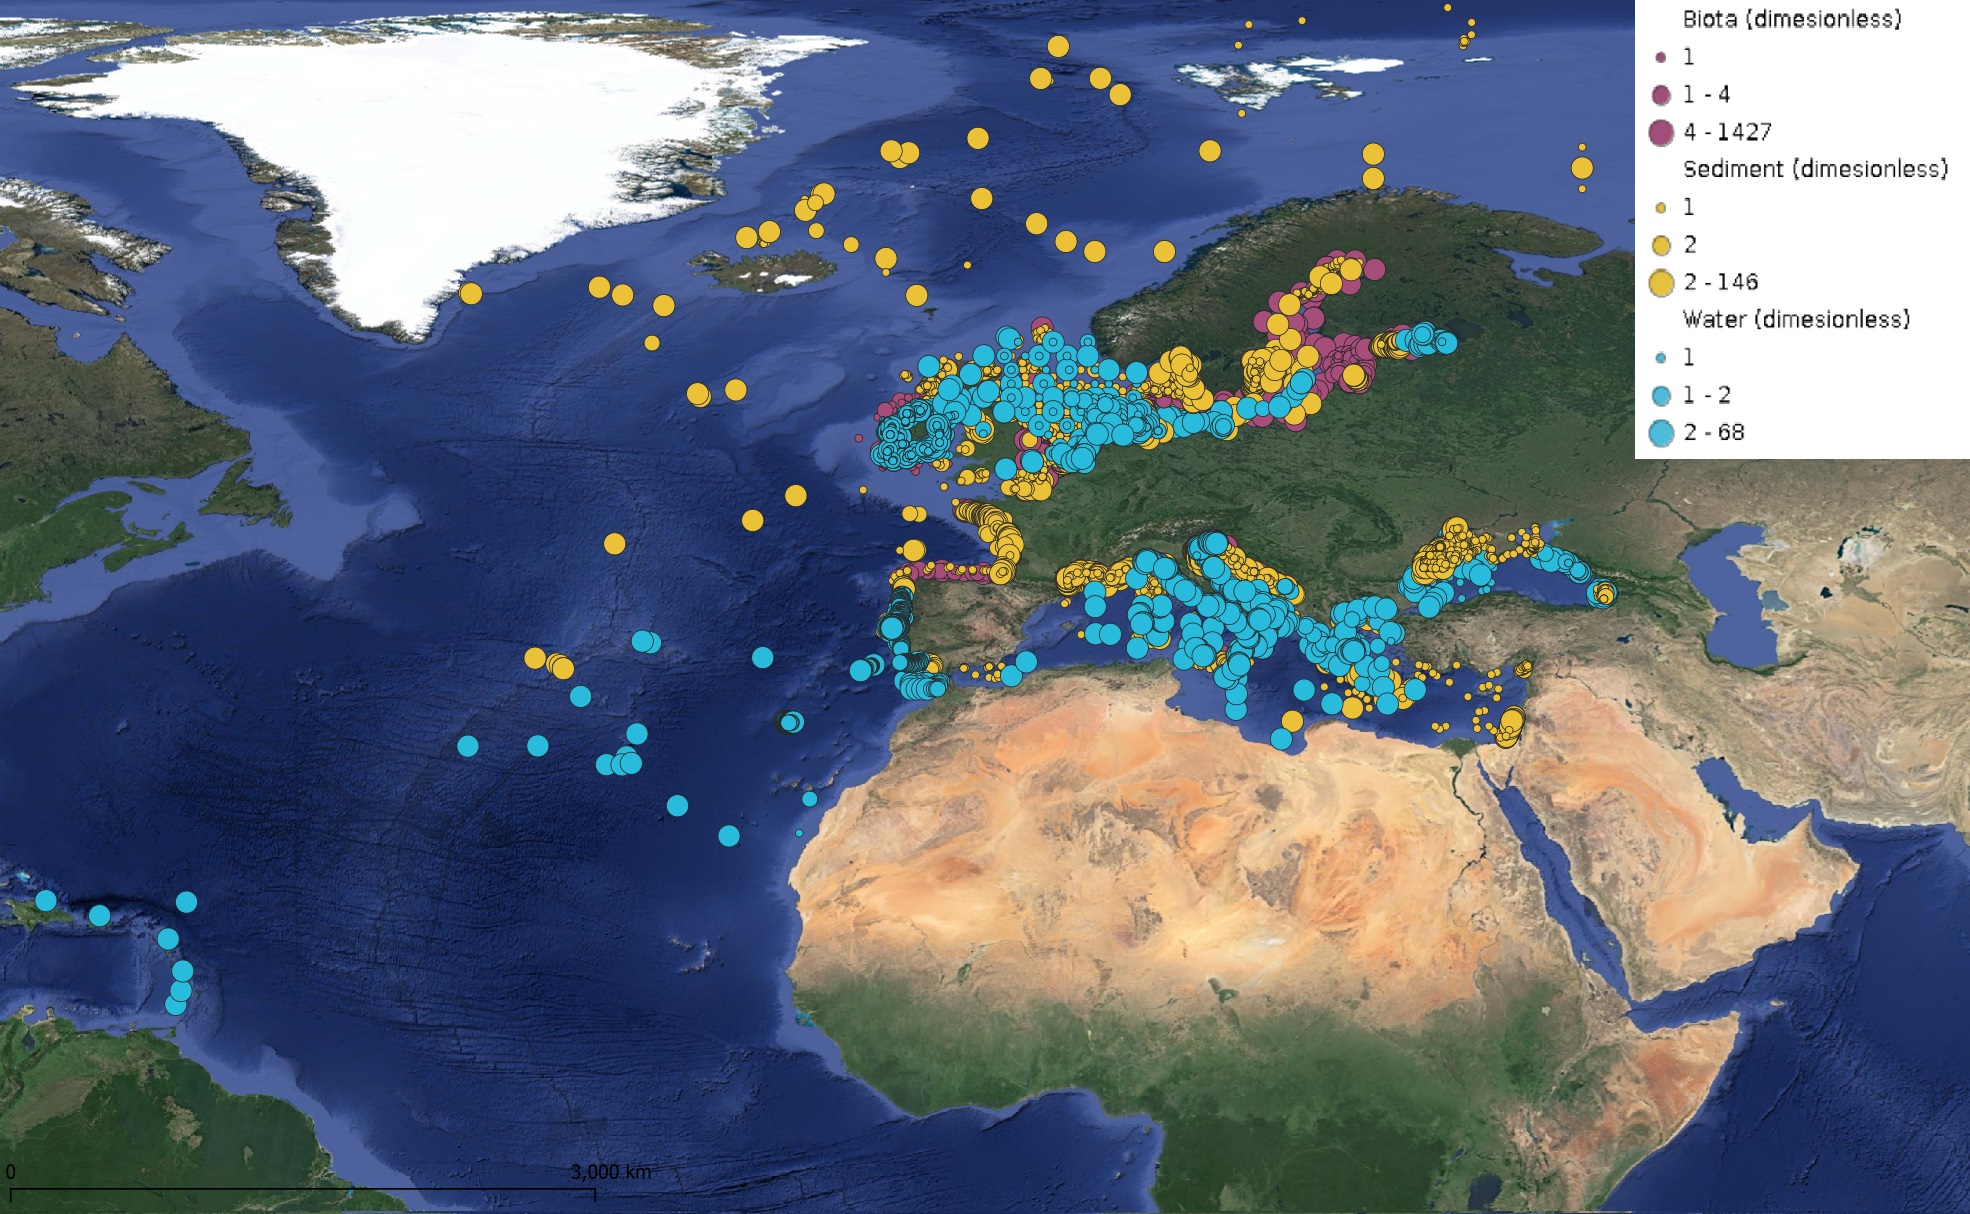
This product displays for Lead, positions with values counts that have been measured per matrix and are present in EMODnet regional contaminants aggregated datasets, v2024. The product displays positions for all available years.
-
This visualization product displays the cigarette related items abundance of marine macro-litter (> 2.5cm) per beach per year from non-MSFD monitoring surveys, research & cleaning operations without UNEP-MARLIN data. EMODnet Chemistry included the collection of marine litter in its 3rd phase. Since the beginning of 2018, data of beach litter have been gathered and processed in the EMODnet Chemistry Marine Litter Database (MLDB). The harmonization of all the data has been the most challenging task considering the heterogeneity of the data sources, sampling protocols and reference lists used on a European scale. Preliminary processings were necessary to harmonize all the data: - Exclusion of OSPAR 1000 protocol: in order to follow the approach of OSPAR that it is not including these data anymore in the monitoring; - Selection of surveys from non-MSFD monitoring, cleaning and research operations; - Exclusion of beaches without coordinates; - Selection of cigarette related items only. The list of selected items is attached to this metadata. This list was created using EU Marine Beach Litter Baselines, the European Threshold Value for Macro Litter on Coastlines and the Joint list of litter categories for marine macro-litter monitoring from JRC (these three documents are attached to this metadata); - Exclusion of surveys without associated length; - Exclusion of surveys referring to the UNEP-MARLIN list: the UNEP-MARLIN protocol differs from the other types of monitoring in that cigarette butts are surveyed in a 10m square. To avoid comparing abundances from very different protocols, the choice has been made to distinguish in two maps the cigarette related items results associated with the UNEP-MARLIN list from the others; - Normalization of survey lengths to 100m & 1 survey / year: in some case, the survey length was not 100m, so in order to be able to compare the abundance of litter from different beaches a normalization is applied using this formula: Number of cigarette related items of the survey (normalized by 100 m) = Number of cigarette related items of the survey x (100 / survey length) Then, this normalized number of cigarette related items is summed to obtain the total normalized number of cigarette related items for each survey. Finally, the median abundance of cigarette related items for each beach and year is calculated from these normalized abundances of cigarette related items per survey. Percentiles 50, 75, 95 & 99 have been calculated taking into account cigarette related items from other sources data (excluding UNEP-MARLIN protocol) for all years. More information is available in the attached documents. Warning: the absence of data on the map does not necessarily mean that they do not exist, but that no information has been entered in the Marine Litter Database for this area.
-

These documents present all the technical details of the tags, including the programming files of the tag, photos of the elctronic cricuits etc.
-
This L3U (Level 3 Uncollated) dataset contains global daily Sea Surface Temperature (SST) on a 0.02 degree grid resolution. It is produced by the National Oceanic and Atmospheric Administration (NOAA) Advanced Clear Sky Processor for Ocean (ACSPO) using L2P (Level 2 Preprocessed) product acquired from the Meteorological Operational satellite B (Metop-B) Advanced Very High Resolution Radiometer 3 (AVHRR/3) (https://podaac.jpl.nasa.gov/dataset/AVHRRF_MB-STAR-L2P-v2.80 ) in Full Resolution Area Coverage (FRAC) mode as input. It is distributed as 10-minute granules in netCDF-4 format, compliant with the Group for High Resolution Sea Surface Temperature (GHRSST) Data Specification version 2 (GDS2). There are 144 granules per 24-hour interval. Fill values are reported in all invalid pixels, including land pixels with >5 km inland. For each valid water pixel (defined as ocean, sea, lake or river), and up to 5 km inland, the following major layers are reported: SSTs and ACSPO clear-sky mask (ACSM; provided in each grid as part of l2p_flags, which also includes day/night, land, ice, twilight, and glint flags). Only input L2P SSTs with QL=5 were gridded, so all valid SSTs are recommended for the users. Per GDS2 specifications, two additional Sensor-Specific Error Statistics layers (SSES bias and standard deviation) are reported in each pixel with valid SST. Ancillary layers include wind speed and ACSPO minus reference Canadian Meteorological Centre (CMC) Level 4 (L4) SST. The ACSPO Metop-B AVHRR FRAC L3U product is monitored and validated against iQuam in situ data https://www.star.nesdis.noaa.gov/socd/sst/iquam in the NOAA SST Quality Monitor (SQUAM) system https://www.star.nesdis.noaa.gov/socd/sst/squam . SST imagery and clear-sky mask are evaluated, and checked for consistency with L2P and other satellites/sensors SST products, in the NOAA ACSPO Regional Monitor for SST (ARMS) system https://www.star.nesdis.noaa.gov/socd/sst/arms . More information about the dataset is found at AVHRRF_MB-STAR-L2P-v2.80 and in (Pryamitsyn et al., 2021).
-
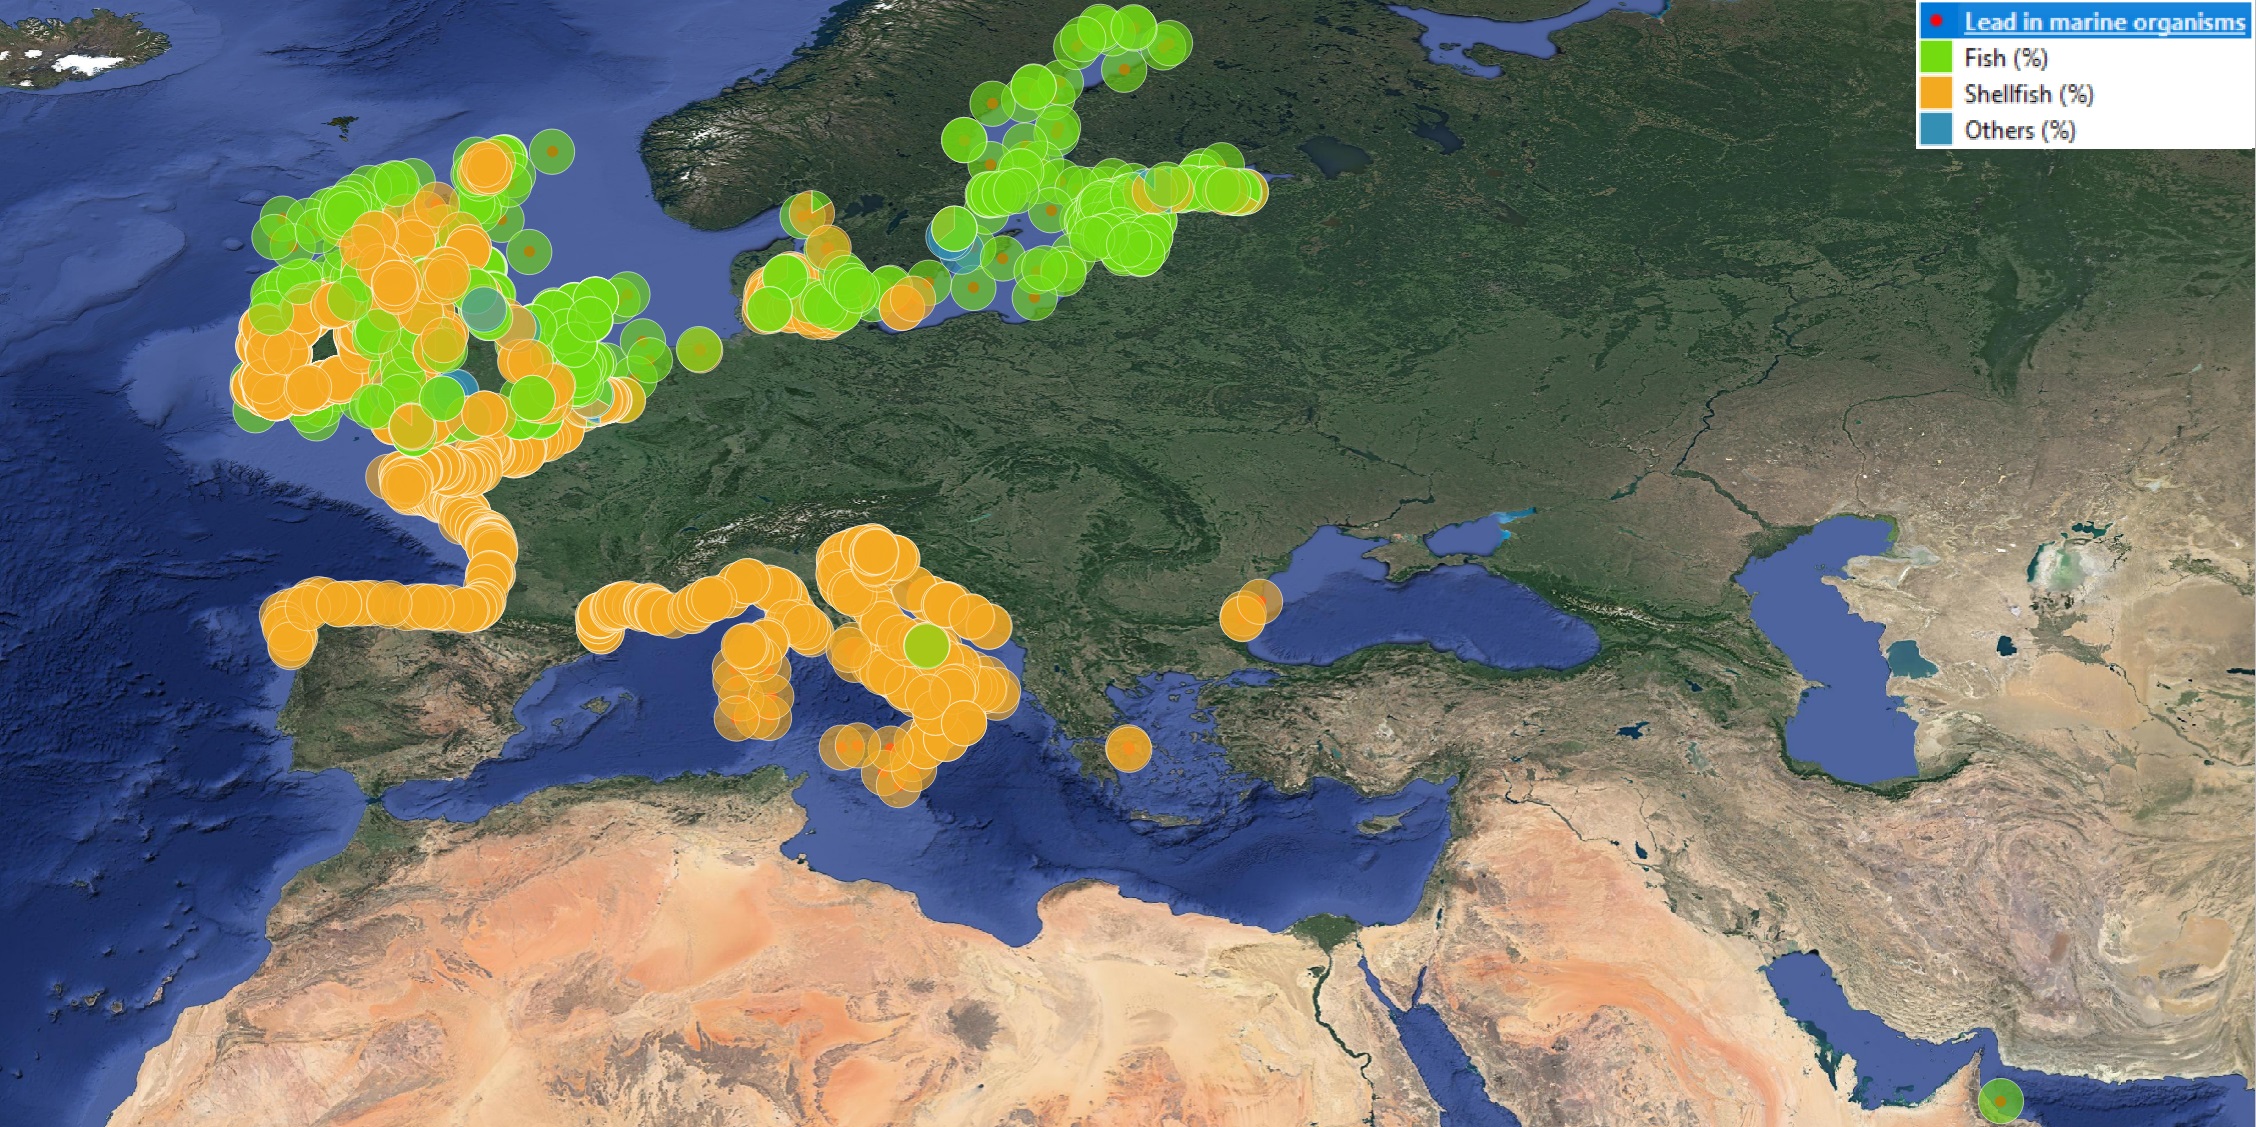
This product displays for Lead, positions with percentages of all available data values per group of animals that are present in EMODnet regional contaminants aggregated datasets, v2022. The product displays positions for all available years.
-

A 40-minute tutorial to use OGC webservices offered by the Mission Atlantic GeoNode in your data analysis. The workshop makes use of Python Notebooks and common GIS Software (ArcGIS and QGIS), basic knowledge of Python and/or GIS software is recommended. • Introduction to OGC services • Search through metadata using the OGC Catalogue Service (CSW) • Visualize data using OGC Web Mapping Service (WMS) • Subset and download data using OGC Web Feature and Coverage Services (WFS/WCS) • Use OGC services with QGIS and/or ArcGIS
-
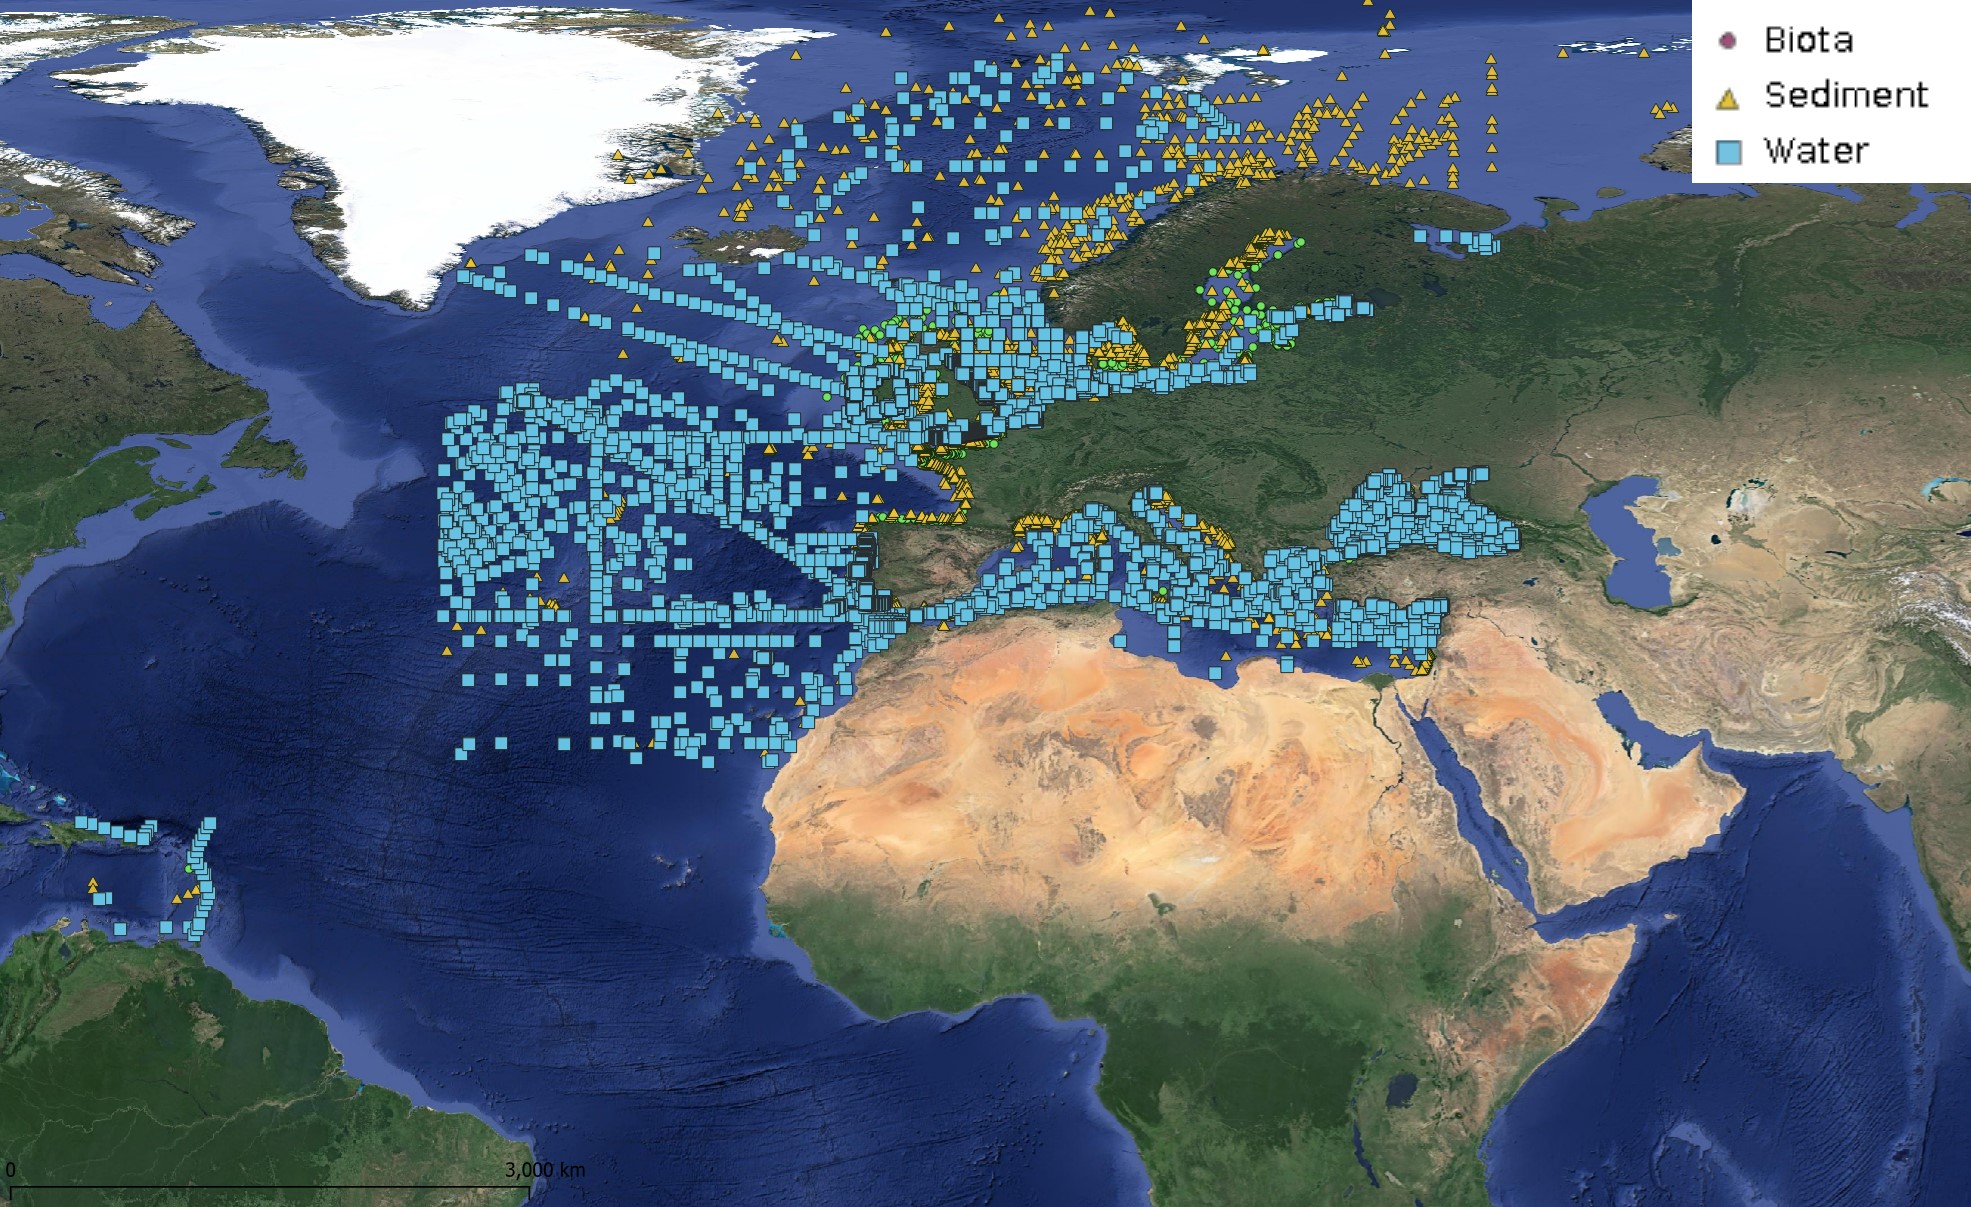
This product displays positions symbolized per matrix, for all available contaminants measurements for each year present in EMODnet regional contaminants aggregated datasets, v2024. The product displays positions for every available year.
-
This visualization product displays the transparency of litter in percent per net per year from research and monitoring protocols. EMODnet Chemistry included the collection of marine litter in its 3rd phase. Before 2021, there was no coordinated effort at the regional or European scale for micro-litter. Given this situation, EMODnet Chemistry proposed to adopt the data gathering and data management approach as generally applied for marine data, i.e., populating metadata and data in the CDI Data Discovery and Access service using dedicated SeaDataNet data transport formats. EMODnet Chemistry is currently the official EU collector of micro-litter data from Marine Strategy Framework Directive (MSFD) National Monitoring activities (descriptor 10). A series of specific standard vocabularies or standard terms related to micro-litter have been added to SeaDataNet NVS (NERC Vocabulary Server) Common Vocabularies to describe the micro-litter. European micro-litter data are collected by the National Oceanographic Data Centres (NODCs). Micro-litter map products are generated from NODCs data after a test of the aggregated collection including data and data format checks and data harmonization. A filter is applied to represent only micro-litter sampled according to research and monitoring protocols as MSFD monitoring. To calculate percentages for each transparency, formula applied is: Transparency (%) = (∑number of particles of each transparency)*100 / (∑number of particles of all transparency) When the number of microlitters was not filled or zero, the percentage could not be calculated. Standard vocabularies for microliter transparency are taken from Seadatanet's H06 library (https://vocab.seadatanet.org/v_bodc_vocab_v2/search.asp?lib=H06) Warning: the absence of data on the map does not necessarily mean that they do not exist, but that no information has been entered in the National Oceanographic Data Centre (NODC) for this area.
-

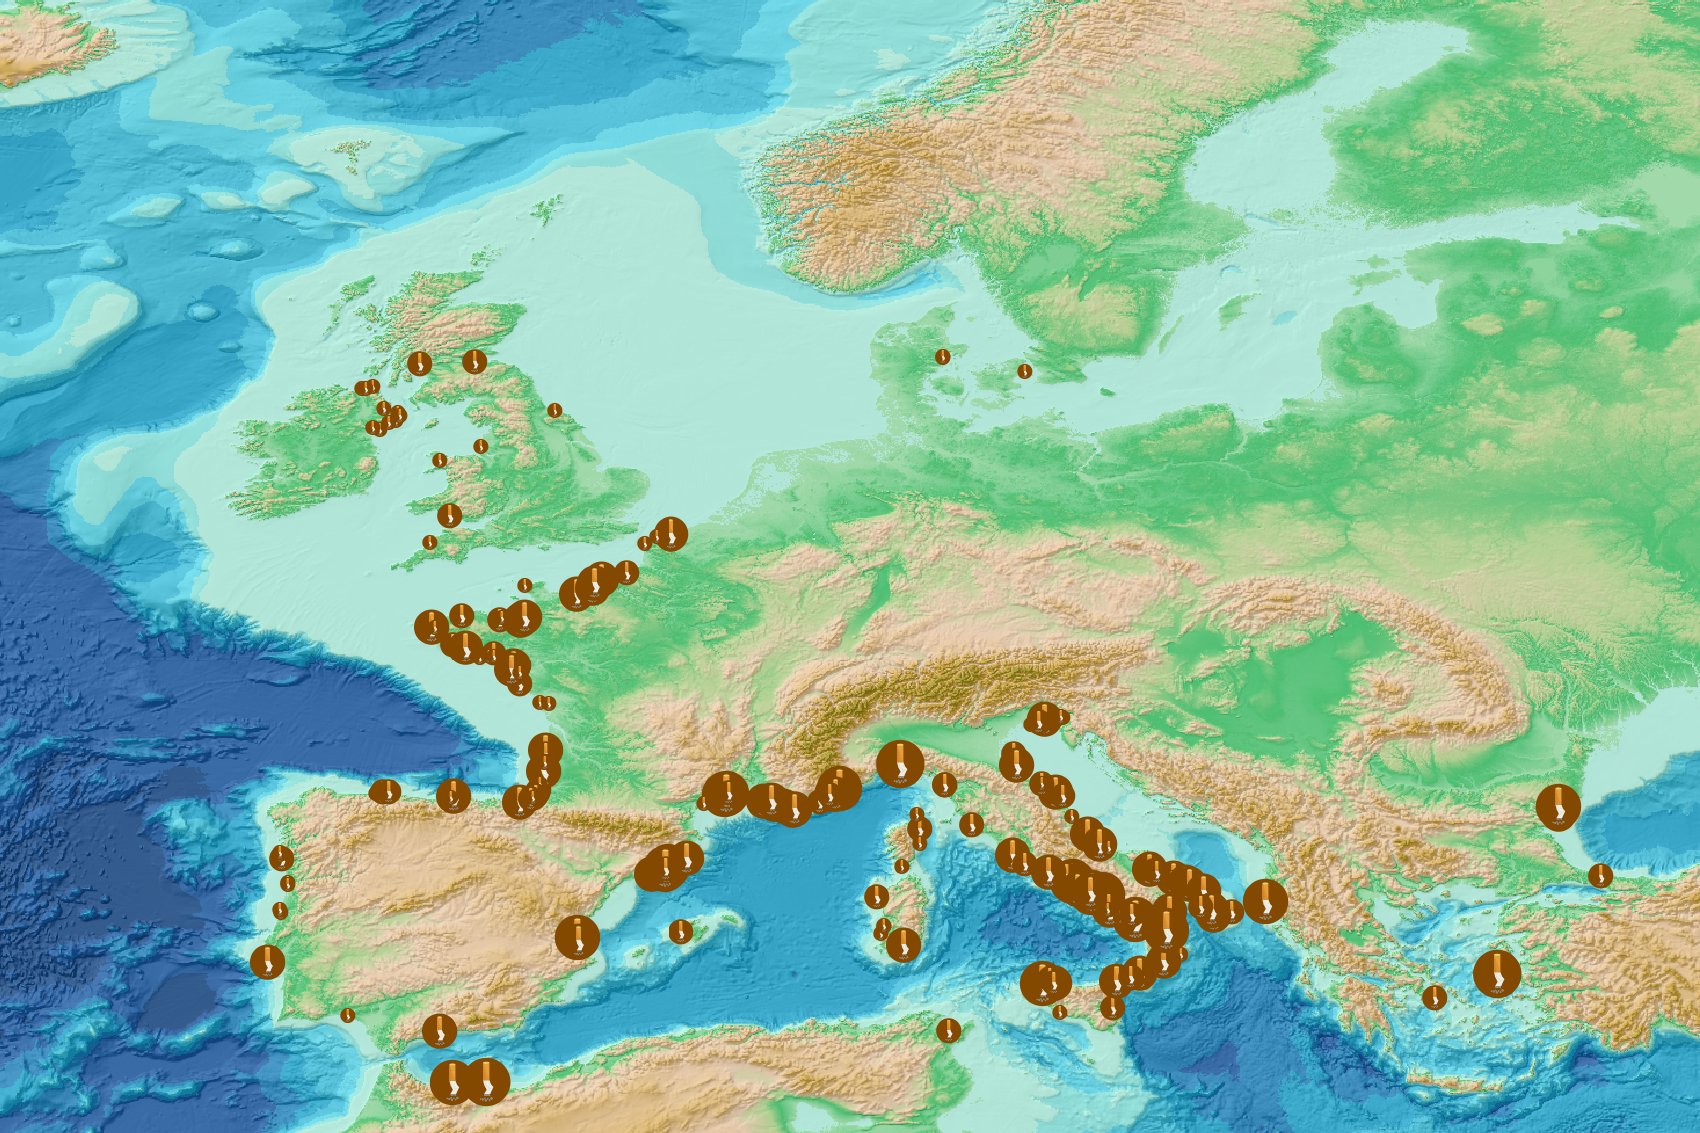
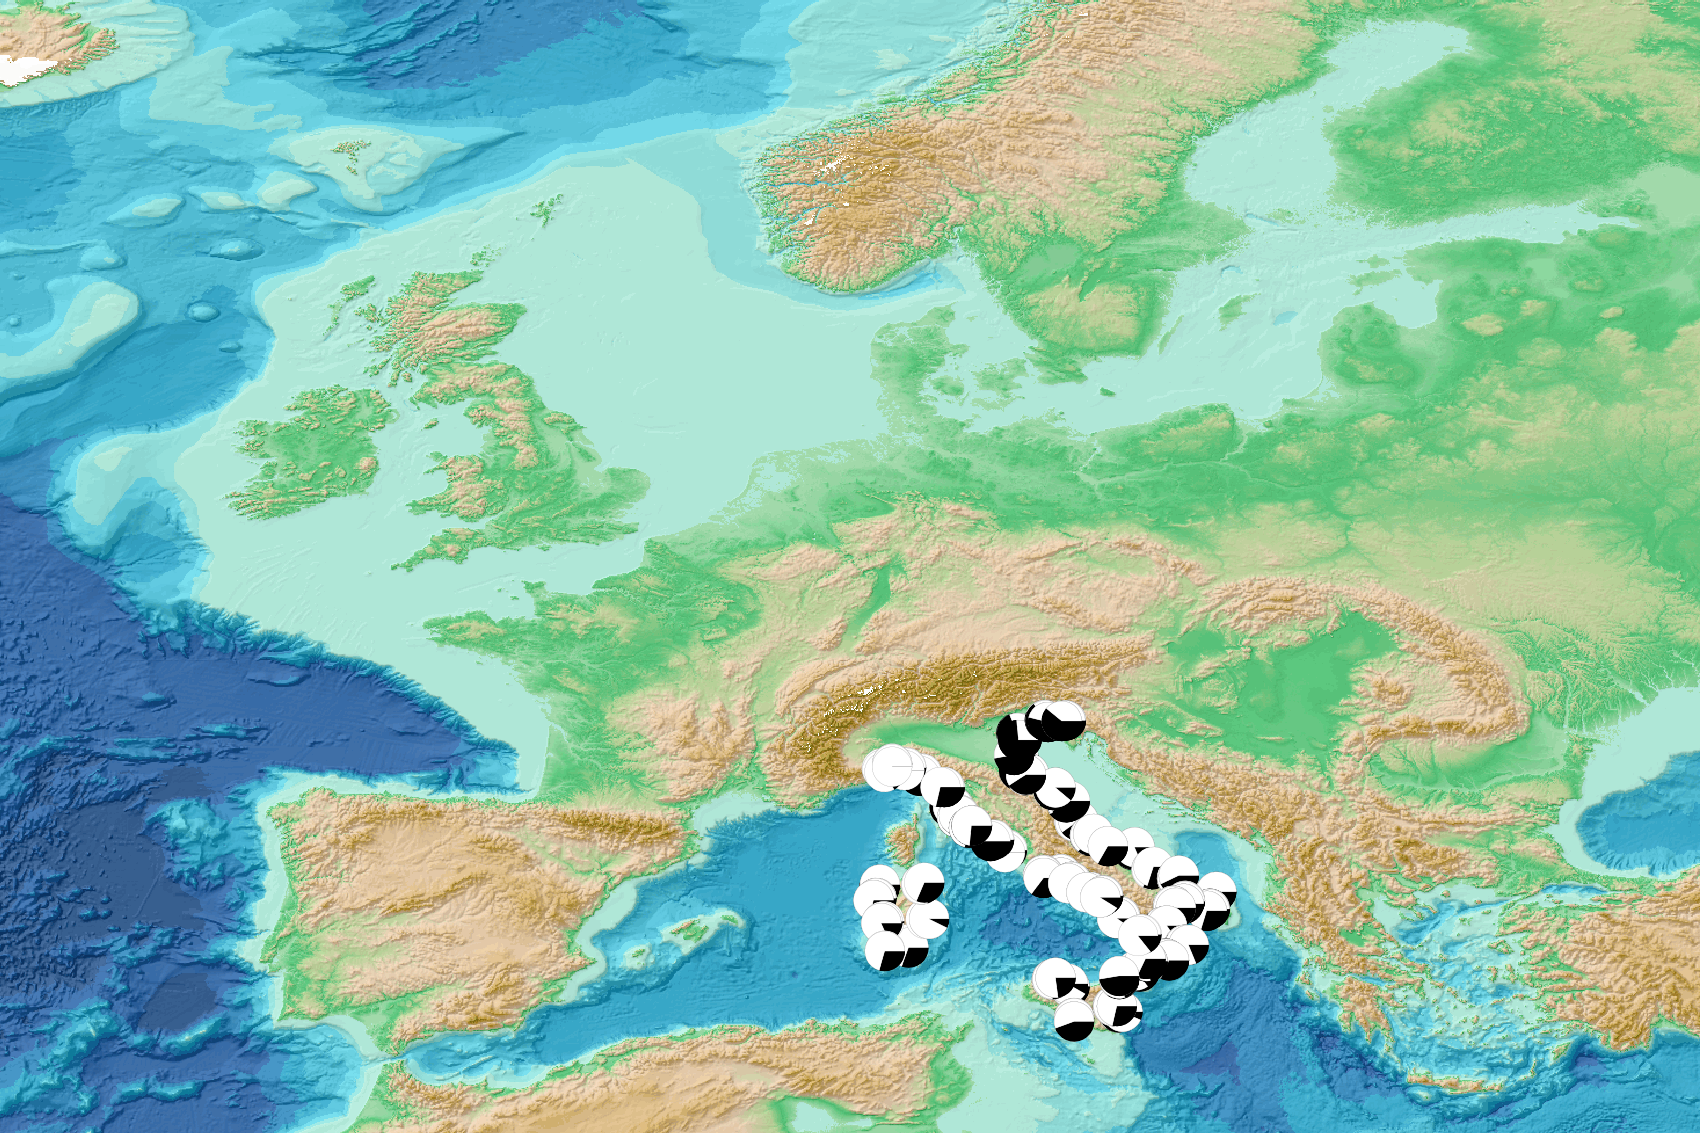
This product displays for Tributyltin, positions with values counts that have been measured per matrix and are present in EMODnet regional contaminants aggregated datasets, v2024. The product displays positions for all available years.
-