Keyword
/Cross-discipline/Fluxes
Type of resources
Topics
Keywords
Contact for the resource
Provided by
Formats
Representation types
Resolution
From
1
-
2
/
2
-

This dataset shows the global distribution of over 1,300 estuaries, including some lagoon systems and fjords. The majority of estuaries are represented by polygons, except for 44 records for which points are available. This dataset was developed by Sea Around Us (www.seaaroundus.org).
-

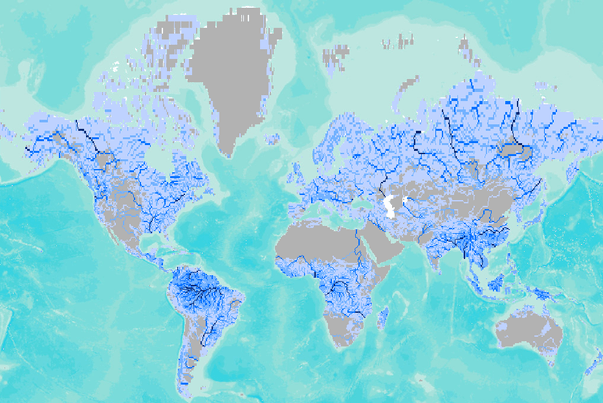
Global annual river discharge for a 0.5 degree resolution digital river network (blended, km3/yr per grid cell). Blended river flow represents a composite of observed and modeled river flow. Annual river discharge - computed as flow accumulated long term average runoff along a 30-minute resolution digital river network and blended with observed discharge data where available (km3/yr).
 Catalogue PIGMA