 Catalogue PIGMA
Aggregate data
Type of resources
Available actions
Topics
Keywords
Contact for the resource
Provided by
Years
Formats
Representation types
Update frequencies
status
Scale
Resolution
-
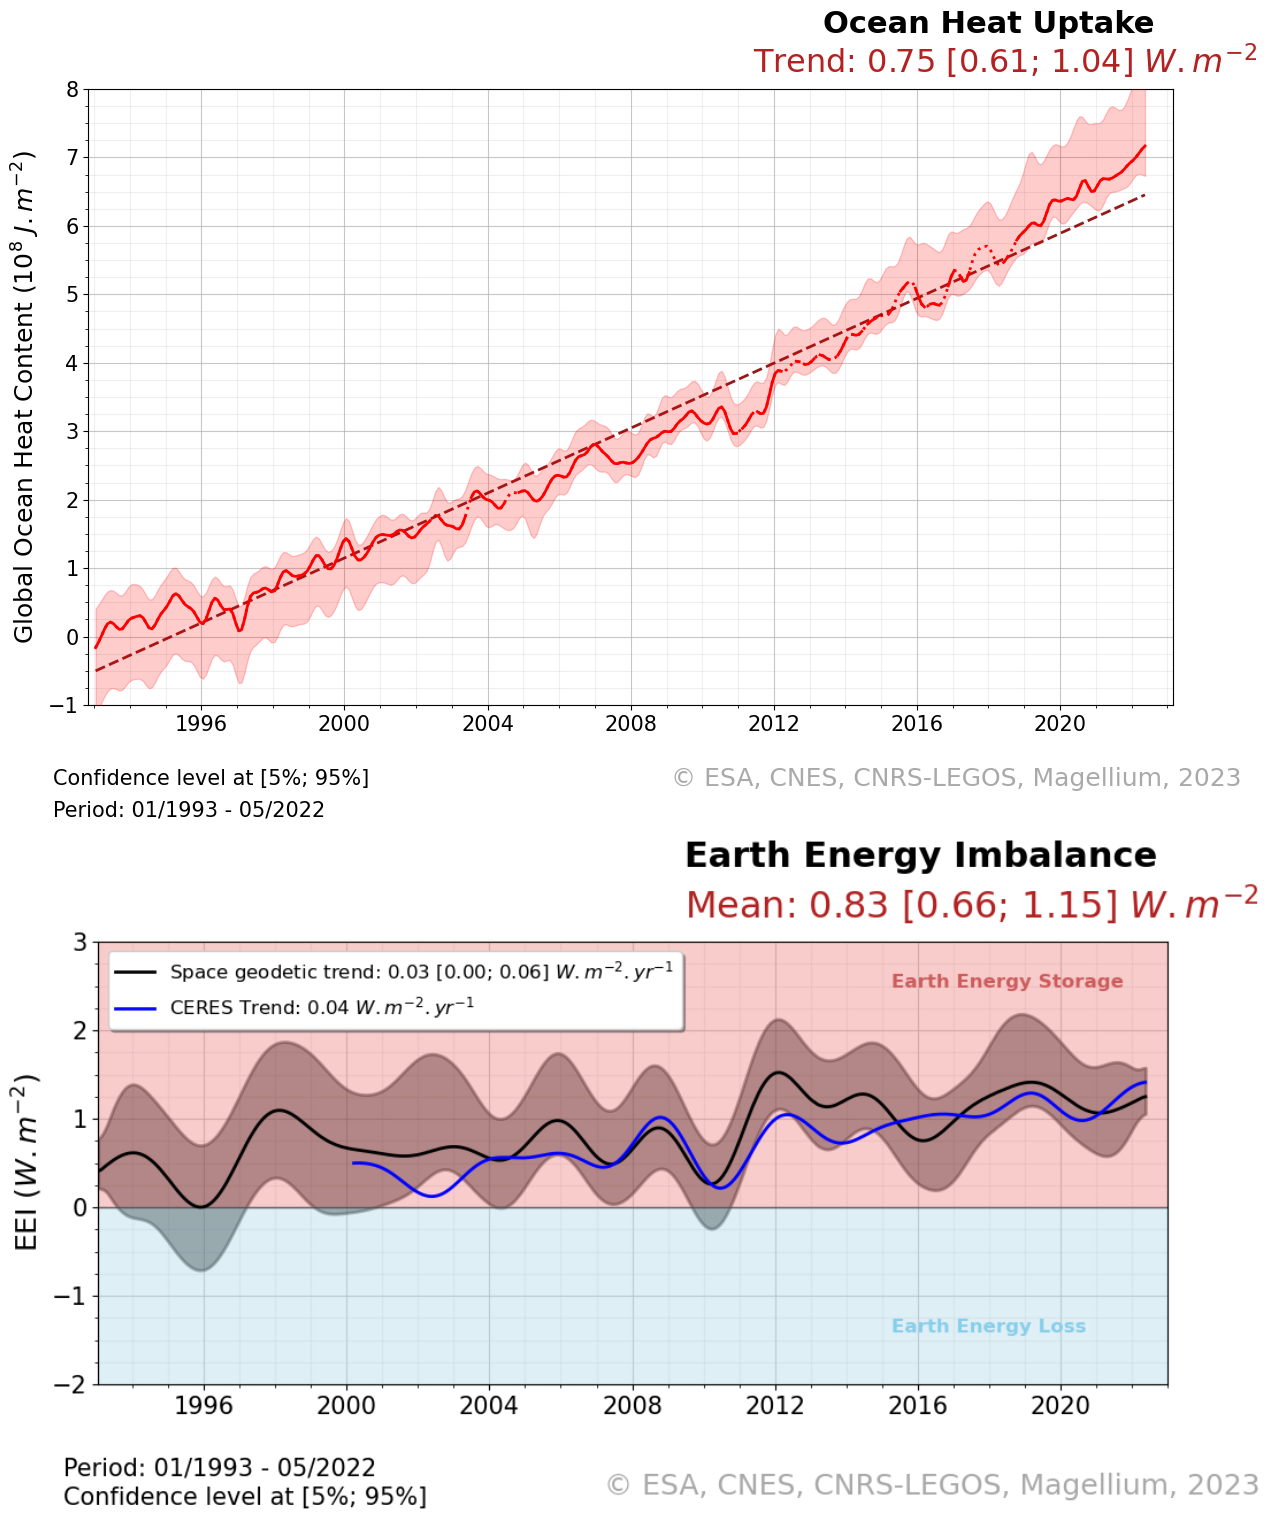
The Ocean Heat Content ("OHC") is estimated from the measurement of the thermal expansion of the ocean based on differences between the total sea-level content derived from altimetry measurements and the mass content derived from gravimetry data, noted “altimetry-gravimetry”. The Earth Energy Imbalance ("EEI") indicator is derived from the temporal variations of the ocean heat content, i.e. by calculating its derivative (called the ocean heat uptake). The product is delivered in two distinct files. The main one contains the essential variables like Global Ocean Heat Content, Earth Energy Imbalance time series and their relative variance-covariance matrices. The second file contains more variables than the first product like time series of Ocean Mass, Sea Level et Steric Sea Level change grids. It also includes additional variables that were not used for the Global ocean heat content calculation, such as the Global mean of ocean mass, Global mean sea level and Global mean steric sea level time series, but which may nevertheless be of interest to users. Users will therefore be able to find, among other things : - the regional map of the Ocean Heat Content trends (see image associated with this metadata sheet), - global ocean heat content change time series (representative of the globe within the extent of data availability), - earth energy imbalance time series (from global OHC filtered-out from signals lower than 3 years), - the uncertainties associated with these two datasets.
-
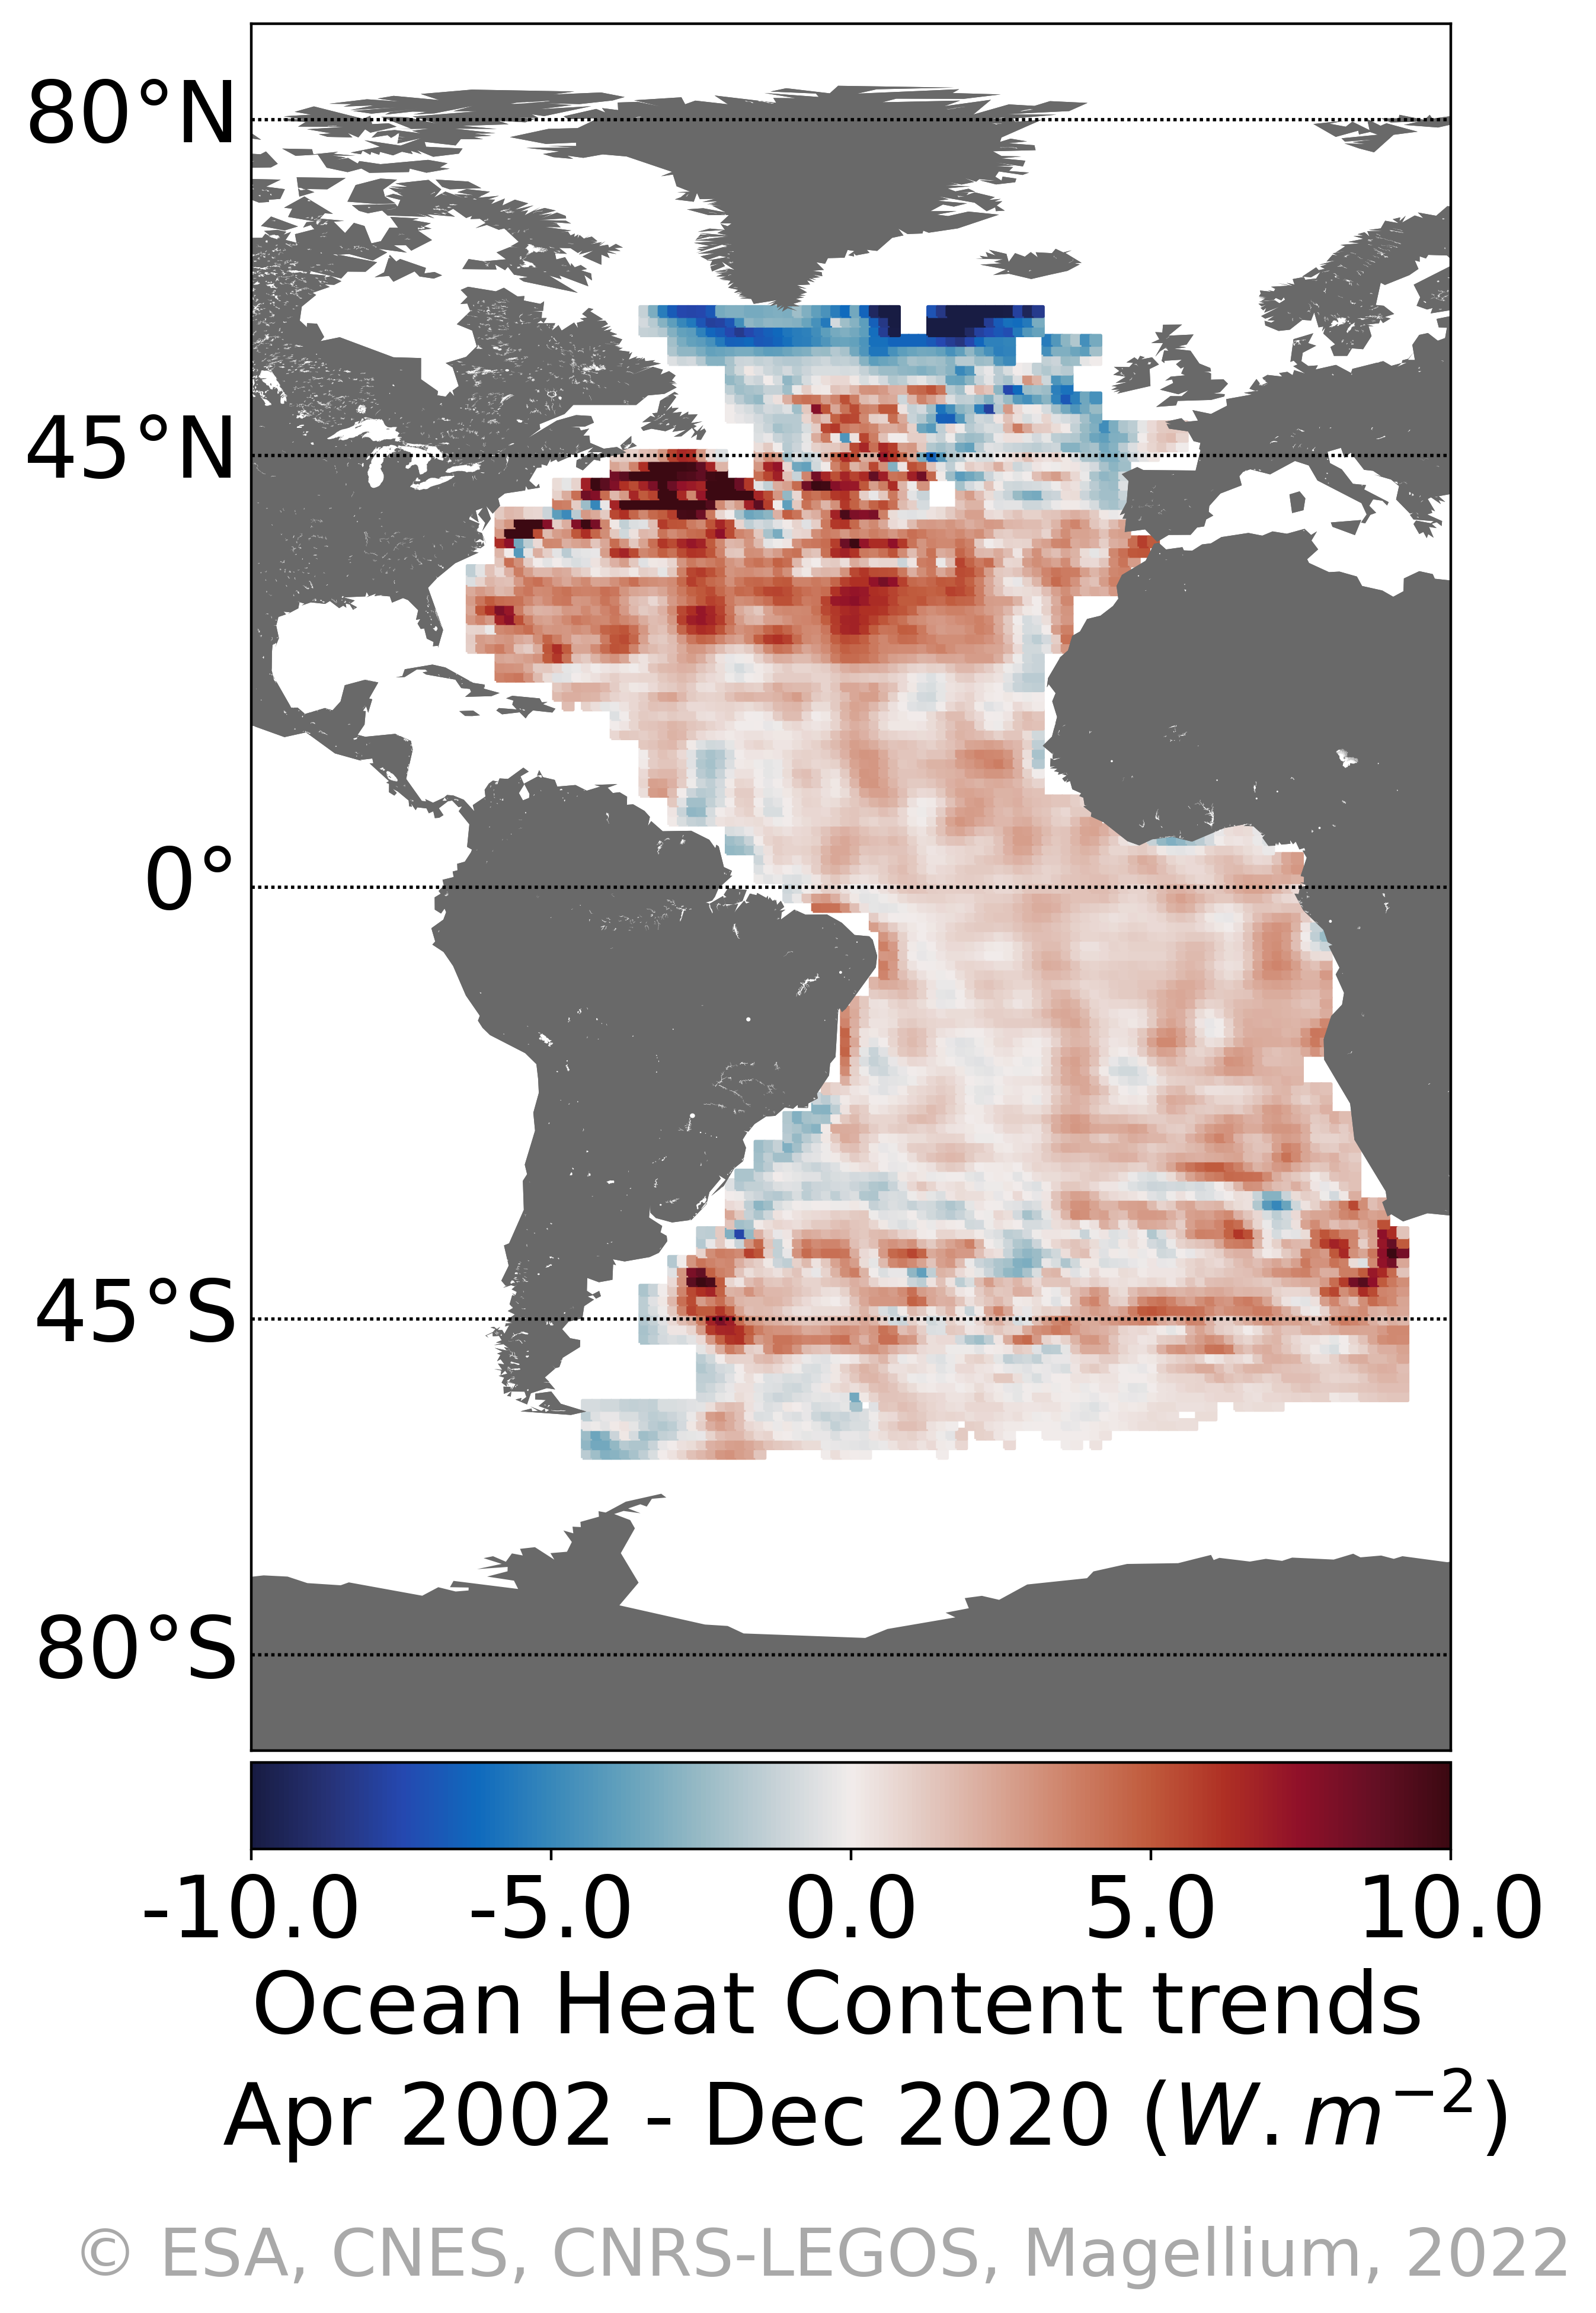
Regional heat content change over the Atlantic Ocean with the space geodetic approach : "4DAtlantic-OHC" The Ocean Heat Content ("OHC") is estimated from the measurement of the thermal expansion of the ocean based on differences between the total sea-level content derived from altimetry measurements and the mass content derived from gravimetry data, noted “altimetry-gravimetry”. Users will be mainly interested in: - Monthly gridded Atlantic Ocean heat content change - OHC trends and their uncertainties
-
Stocks of Crepidula fornicata Linnaeus, 1758 in the Pertuis Charentais. Environmental state for 2011
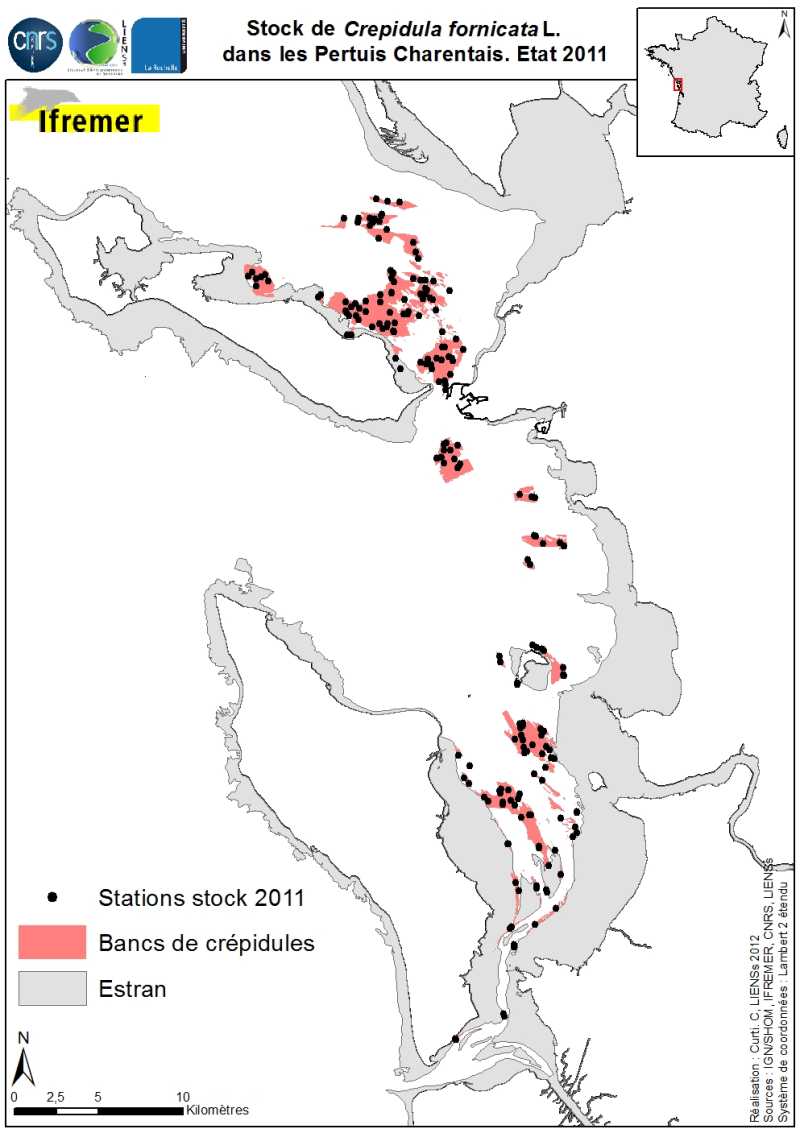
Stocks (abundance and biomass) of the slipper limpet Crepidula fornicata Linnaeus, 1758 in the Pertuis Charentais shallows were estimated in 2011 and mapped (Sauriau et al., 2011). The influence of the estimate includes the Pertuis Breton, the eastern part Pertuis Antioch Fouras peninsula and the Bay of Marennes-Oléron where the latter earlier estimates are available. Contours and surface areas of the crepidula were previously determined by acoustic imaging performed aboard the VO/Haliotis in 2008 and 2009, interpreted and validated by spot sampling in 2009 (Curti, 2009). Sampling stocks of 2011 is based on a stratified random sample of 40 banks with a proportional distribution of sampling of 200 stations between banks. The listing for each crepidula bank stocks (abundance in millions, biomass in tonnes) both living and dead, these shells may provide support to potential new colonization.
-
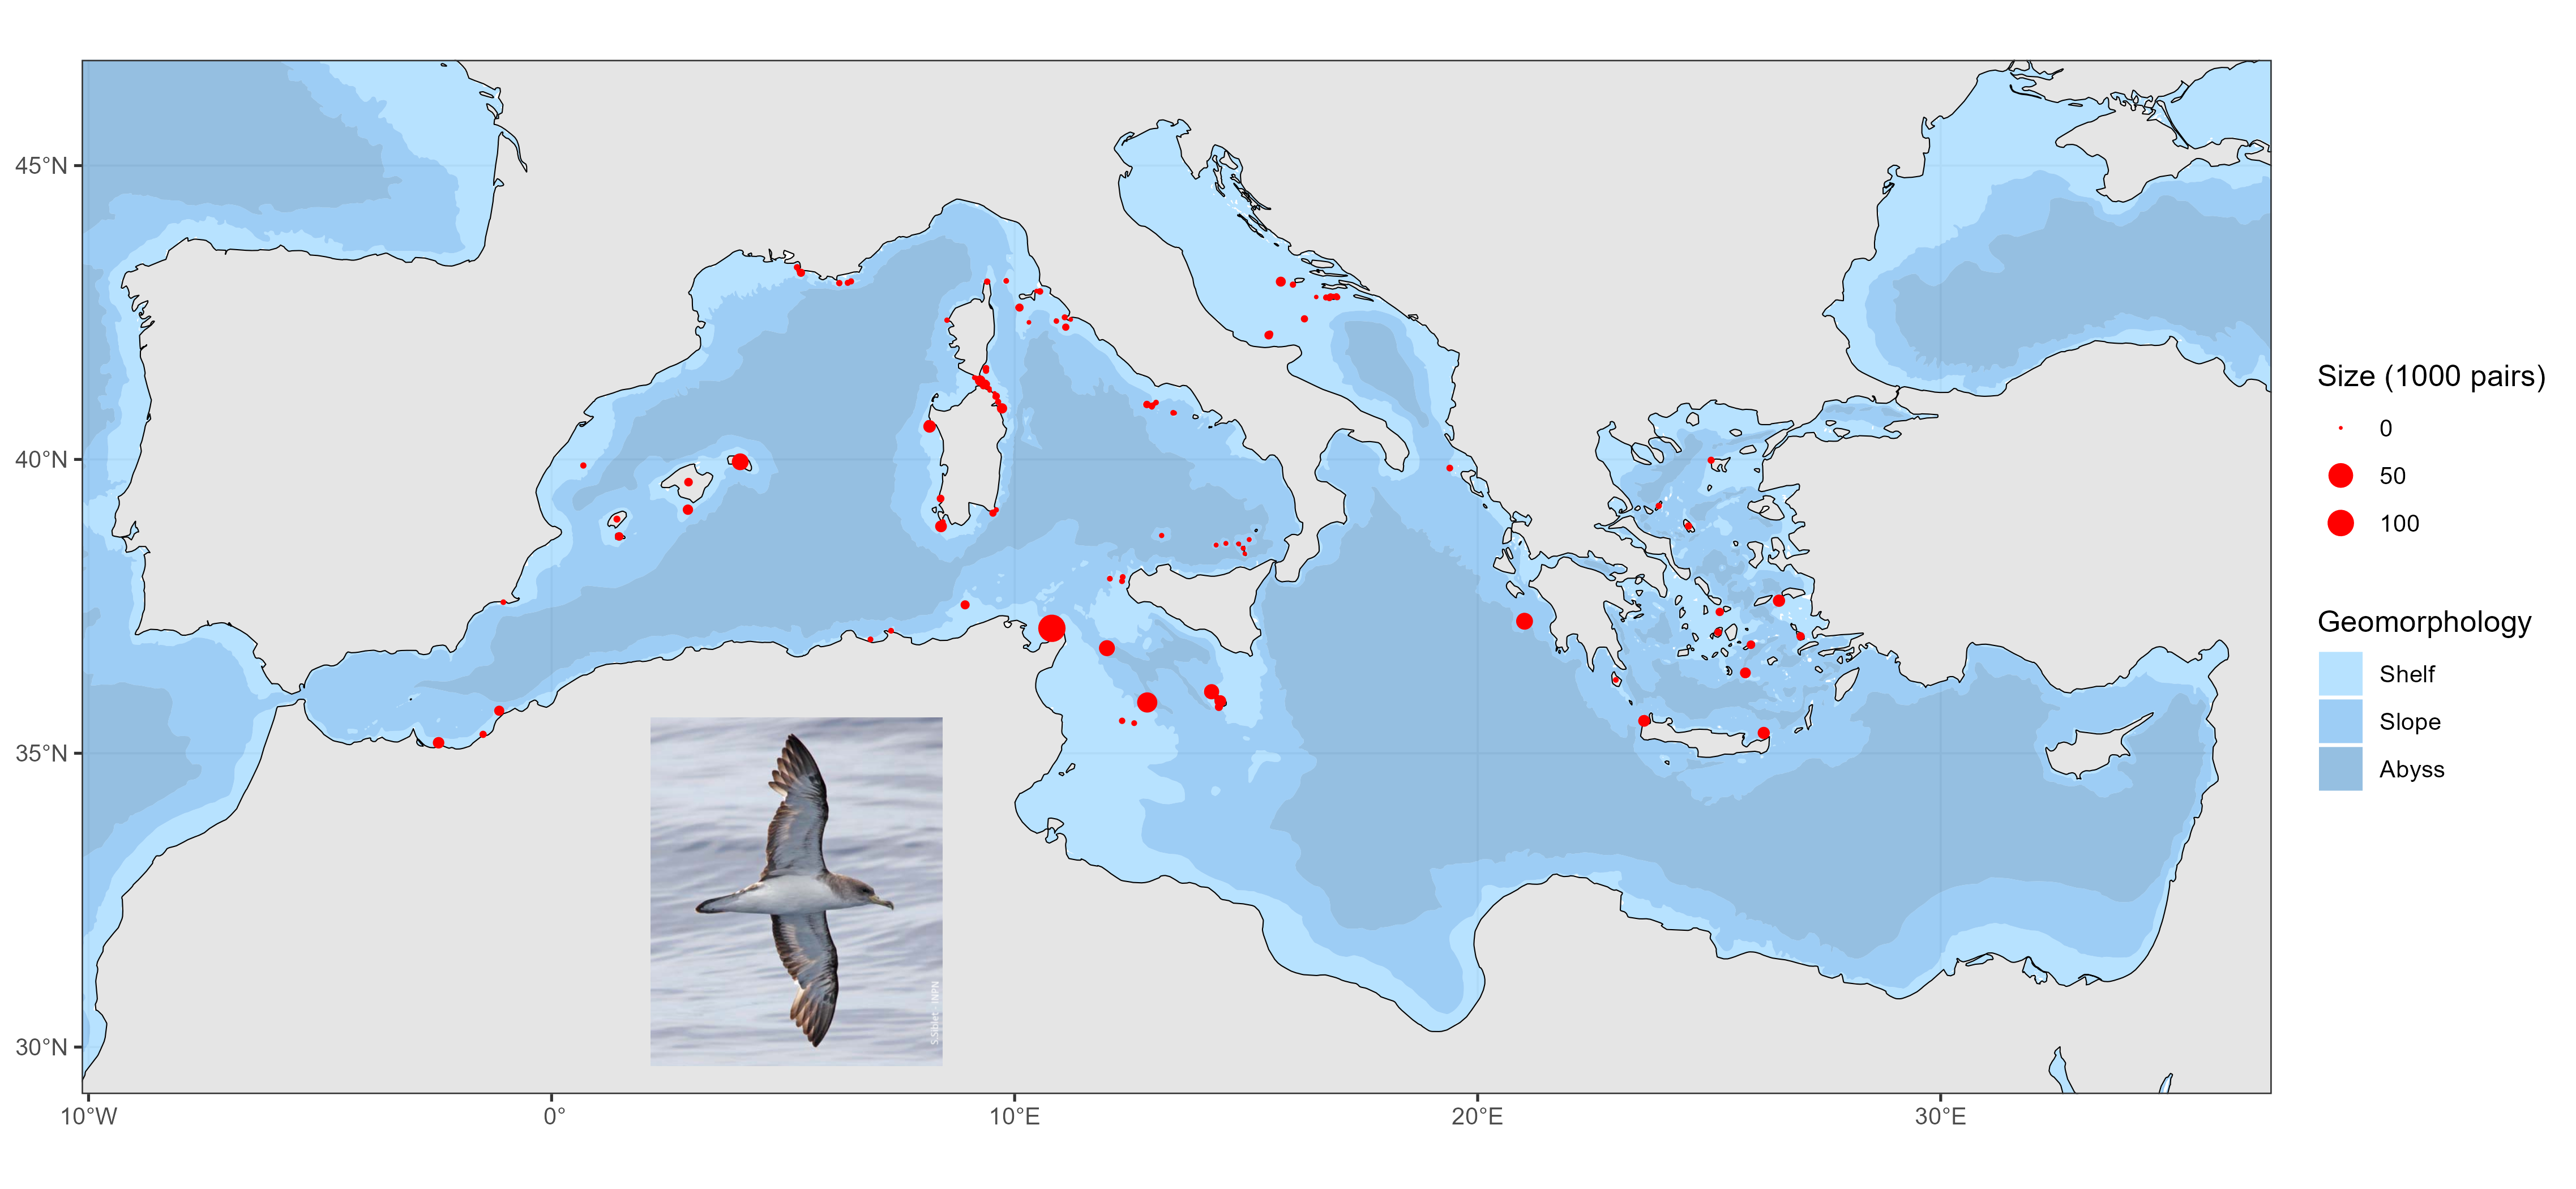
Geolocations of Scopoli's shearwater (Calonectris diomedea) breeding colonies in the Mediterranean Sea. Distance sampling surveys are extensively used to estimate the abundance of wide-ranging species but are prone to detection biases. This may be particularly acute for strip-transect protocols, which assume perfect detection. We examined this assumption by quantifying the detection probability of a declining seabird (Scopoli’s shearwater, Calonectris diomedea), with particular attention to time-of-day and observation conditions at sea. We found detection probability was negatively affected by sun glare but positively by cloud cover and considerably dropped during mid-day hours due to circadian changes in behaviour (reduced detectability while resting). This result urges for systematically assessing and correcting detection bias when using strip-transect data to derive abundance information. Here, we did so by building a detection-corrected presence-absence ensemble model and combining it with a compilation of colony sizes and locations. A Monte-Carlo simulation ensured uncertainty propagation within and across data sources. The corrected abundance map showed shearwaters were largely prevalent in the central Mediterranean, Tunisia hosting most of the population both at sea and at colonies (45% of the global population; 79% of breeding pairs). This first accurate map is an essential conservation tool, emphasizing the importance of transnational actions for such species, that know no political boundaries.
-
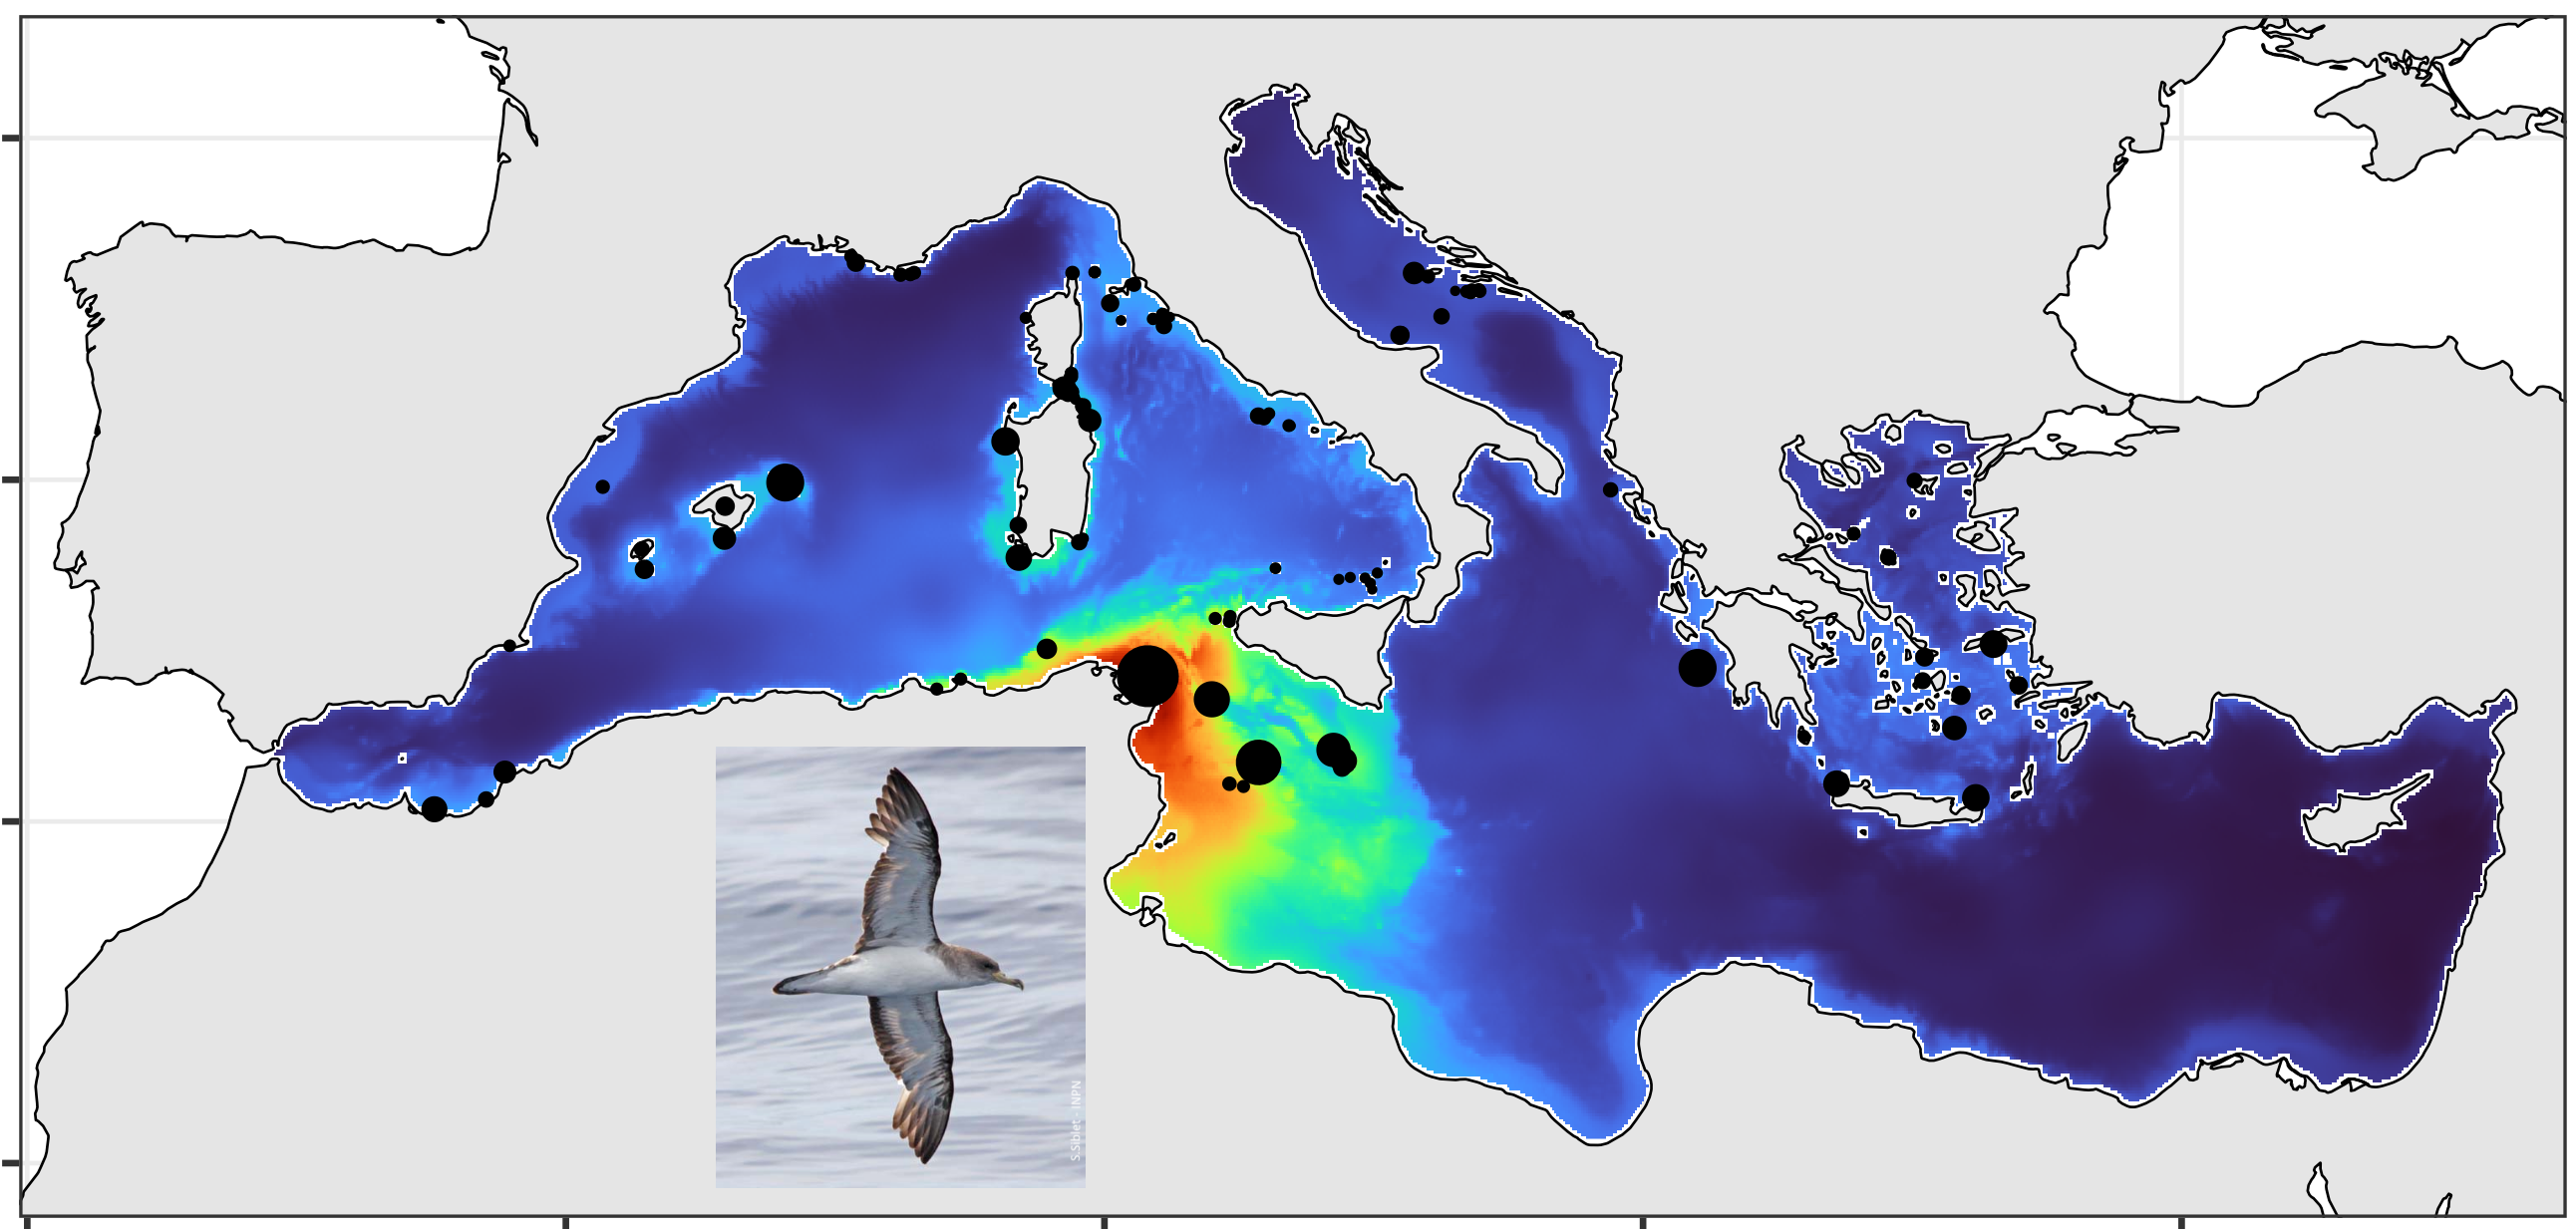
Distribution of Scopoli's shearwater (Calonectris diomedea) in the Mediterranean Sea during the summer season Distance sampling surveys are extensively used to estimate the abundance of wide-ranging species but are prone to detection biases. This may be particularly acute for strip-transect protocols, which assume perfect detection. We examined this assumption by quantifying the detection probability of a declining seabird (Scopoli’s shearwater, Calonectris diomedea), with particular attention to time-of-day and observation conditions at sea. We found detection probability was negatively affected by sun glare but positively by cloud cover and considerably dropped during mid-day hours due to circadian changes in behaviour (reduced detectability while resting). This result urges for systematically assessing and correcting detection bias when using strip-transect data to derive abundance information. Here, we did so by building a detection-corrected presence-absence ensemble model and combining it with a compilation of colony sizes and locations. A Monte-Carlo simulation ensured uncertainty propagation within and across data sources. The corrected abundance map showed shearwaters were largely prevalent in the central Mediterranean, Tunisia hosting most of the population both at sea and at colonies (45% of the global population; 79% of breeding pairs). This first accurate map is an essential conservation tool, emphasizing the importance of transnational actions for such species, that know no political boundaries.
-
Multimission altimetry-derived gridded from Ssalto/Duacs products backward-in-time Finite Size Lyapunov Exponents and Orientations of associated eigenvectors
-
1) Demographic traits These data are published data of age-specific mortality rates, age-specific lengths or weights, length and age at maturity, fecundity-length relationships, and egg size for 84 populations from 49 species of primarily commercial teleost fishes. The populations included are those for which all the life history traits under study have been estimated over a period shorter than 10 years. Traits were estimated from within the ten year window or averaged across it when data were available. Only studies in which reference population, sample size, techniques used for ageing fish and counting eggs, and models used for estimating mortality were reported are included. When only a size or age range was available, the midpoint between the extreme values was used. Raw data were converted into seven demographic traits: - Time-to-5%-survival (T.05): the time elapsed from sexual maturity until 95% of a cohort is dead. T.05 fwas estimated from an exponential mortality model, based on total mortality coefficients estimated by Virtual Population Analysis (age-structured model) in most cases or cohort analysis or catch curves. - Length-at-5%-survival (L.05). In fishes, adult size is difficult to measure because of their indeterminate growth. Adult size reported here is length at time-to-5%-survival. - Age at sexual maturity (Tm): median age at maturity was estimated directly from the data or by fitting a logistic curve to age-specific proportion mature data. When only an age range was available, the midpoint between minimum and maximum is reported. - Length at sexual maturity (Lm): median length at maturity was estimated as age at maturity. - Slope of the fecundity-length relationship (Fb): fish fecundity, defined as the number of eggs present in the ovaries immediately before spawning, is known to increase intraspecifically with the size of females. This increase is usually described by a power-law F = aLb. The exponent of this relationship, b (slope of the log-log fecundity-length regression), accounts for the increase in fecundity with size. - Fecundity at maturity (Fm): fecundity in the year of maturity was estimated from length at maturity, the fecundity-length relationship and the number of spawning bouts per year for batch spawners. - Egg volume (Egg): When information on egg size was unavailable in specific papers, values were borrowed from other studies, using the following criteria in the descending order: from the same period, the same population, the same species. In five species of Perciformes no estimate was available for any population, thus egg volume was estimated from other species of the same family. 2) Fishing pressure Three types of environments with low, moderate and high fishing pressure were defined. - To scale the pressure exerted by fishing to the natural population turn-over, it was expressed as the ratio of fishing mortality to natural mortality rates (F/M). Data were gathered from the literature together with demographic traits. Authors use the following methods to estimate natural mortality rates: intercept of a regression of total mortality on fishing effort, linear relationship known between estimates of natural mortality, growth parameters and the temperature, or multispecies models. Fishing mortality rates were estimated from Virtual Population Analysis or cohort analysis, or as the difference between total and natural mortality. Three levels of fishing pressure were defined: low fishing pressure (fishing mortality lower than natural mortality, F/M < 1), intermediate (1 <= F/M < 2) and high (F/M >= 2).
-
The MIOST (Multiscale Interpolation Ocean Science Topography) experimental altimeter product provides grids at delayed-time, at global scale, 1/10° spatial resolution, the sea surface height (MSLA and MADT) as well as the geostrophic currents, resulting from specific processing. Use for regional studies, ocean variability (mesoscale circulation,...).
-
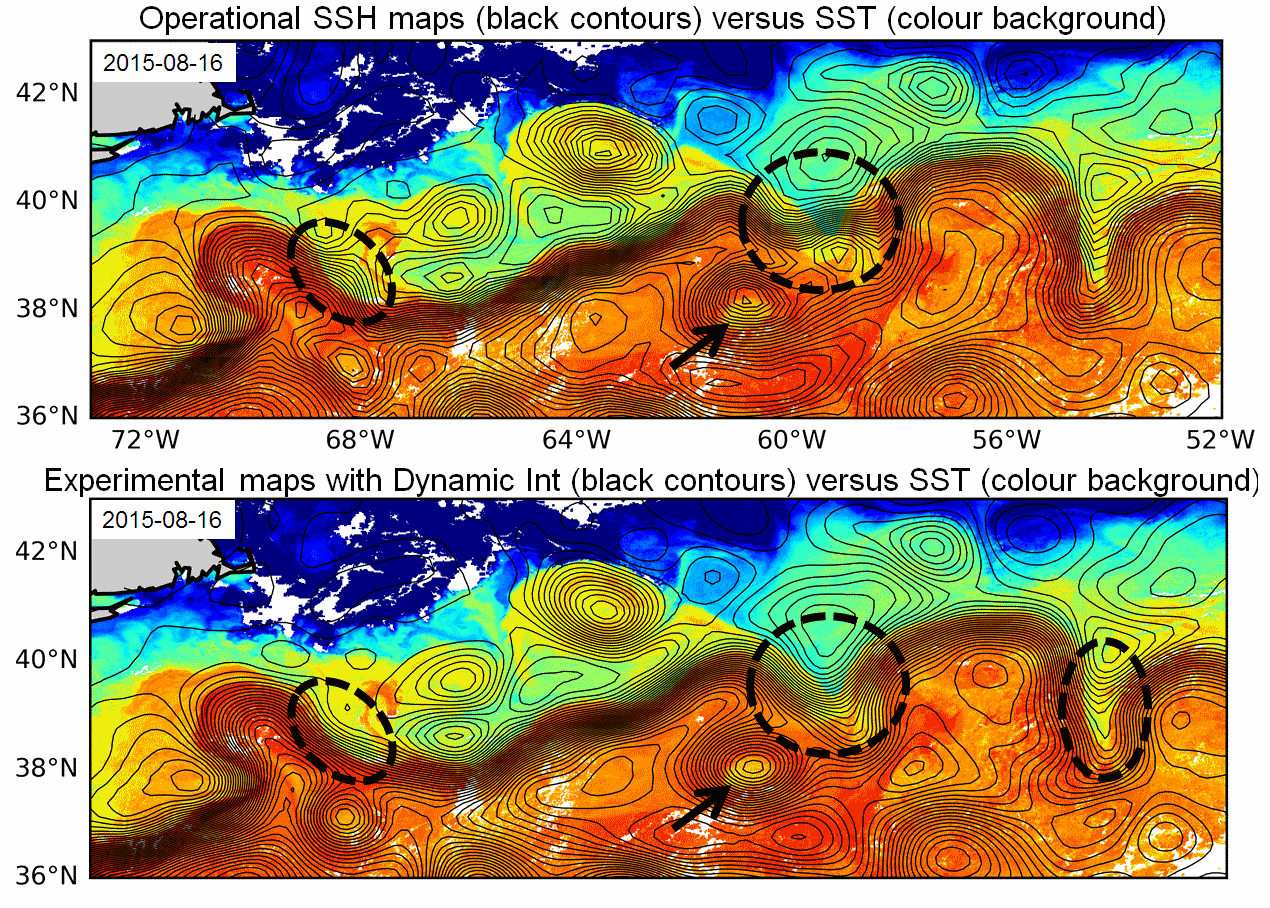
Multimission altimeter products "Experimental" with a finer resolution in preparation to the SWOT Era with sea surface heights computed with respect to a twenty-year mean and Geostrophic velocities, resulting from specific processes, available in delayed time. Use: regional studies, ocean variability (mesoscale circulation,...),
-
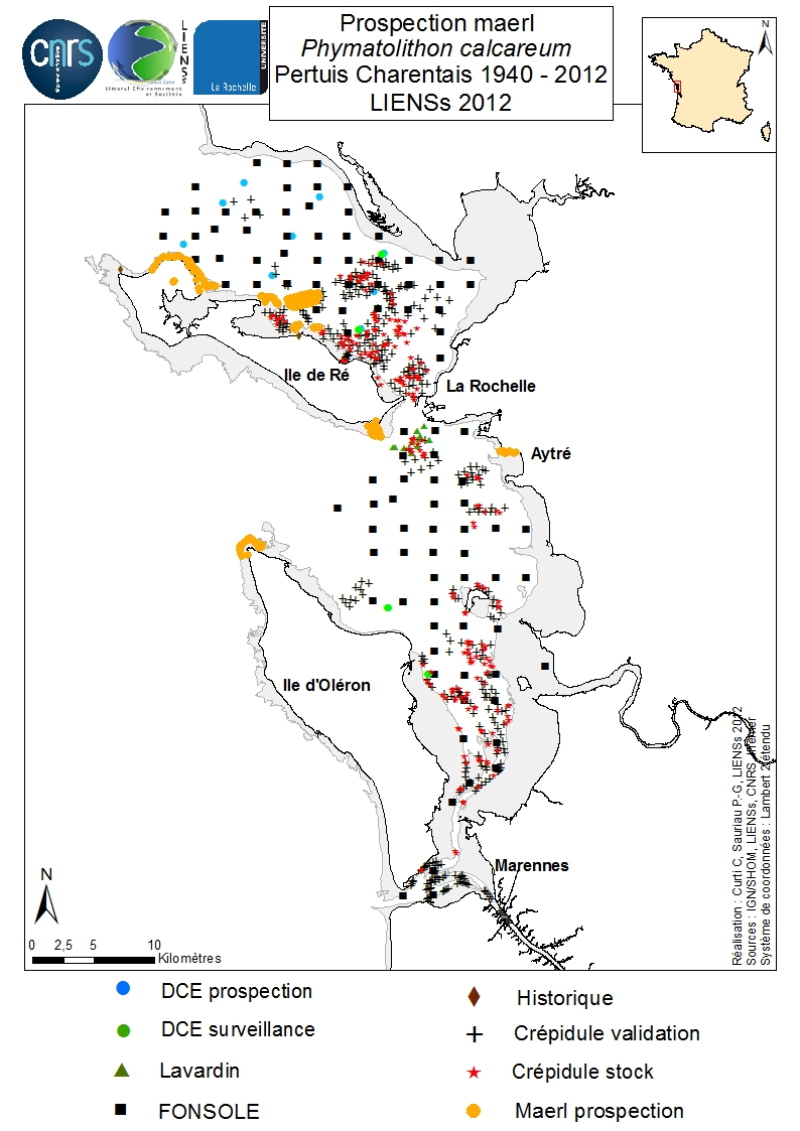
An inventory of mäerl ( unfixed red marine algae Corallinaceae with calcified arbuscular thalli) is taken in the Pertuis Charentais using the compilation of historical data and new observations over the period 2006-2012. The geographic extent of the inventory includes Pertuis Breton, Antioch and Maumusson, extends from the Lay estuary in the north to the Bay of Marennes-Oléron in the south and includes the edges of the islands of Ré, Oléron and Aix. Contributing to this inventory are, surveys DCE 2006 DCE, control monitoring DCE 2007 to 2012 under the aegis of Ifremer and Agences de l’Eau Loire-Bretagne and Adour-Garonne, surveys conducted for the Port Atlantique La Rochelle on the site of dredge spoil deposits in Lavardin from 2007 to 2012, surveys in 2007 FONSOLE by Ifremer and the surveys by Ifremer and laboratory LIENSs to map the crepidula stocks in the Pertuis Charentais Sea. Adding specific surveys conducted in 2011 by the ship Estran by dredge on subtidal bottom sediments of Pertuis Breton and intertidal quadrat in 2012 on the periphery of the islands of Ré, Oléron and along the cliffs of Aytré. The positioning of ground truthing stations were identified by GPS or dGPS. Initially identified by samples of the dredged material in October 2009 during the validation of sonar surveys to individualize stocks of crepidula, a live maerl bed is mapped in July 2011 in the harbor of Saint-Martin in Pertuis Breton. Its area is estimated at more than 2 km². Surveys of pedibus jambi conducted at the point of Grouin and Saint-Martin de Ré has confirmed the presence of live maerl scattered on the lower foreshore. This suggests a scattering of live maerl thalli of several tens of km² around the main bed of Saint-Martin. It is also confirmed by the single algological extraction of Phymatolithon calcareum done at the beginning of the twentieth century in Saint-Martin de Ré by Dollfus, probably already on the lower foreshore as observed in 2012 near the Couronneau beacon. Numerous dead maerl thalli in the procress of diagenesis have also been observed in the East and Southeast of Pertuis Breton and Antioch suggesting passive transport by contributions from live beds farther to the West, including Pertuis in Antioch. The presence of live maerl on the lower foreshore is seen very occasionally in the western islands of Oléron (Pointe Chassiron) and Ré (Phare des Baleines) via recent algologiques and fauna surveys. In biogeographic terms, the maerl bed of Pertuis Breton is the easternmost and southernmost of those known in the Bay of Biscay. The nearest mäerl beds known are respectively located in Noirmoutier (Bourgneuf Bay) and Galicia (Spain). These observations complement the atlas mapping of maerl populations in Europe published under the auspices of the OSPAR Convention. They provide a knowledge base for future conservation actions defined locally in the context of Natura 2000 Sea Marine Natural Park of the Gironde estuary and the Pertuis Charentais.