Article
Type of resources
Topics
Keywords
Contact for the resource
Provided by
Years
Formats
Representation types
Resolution
-

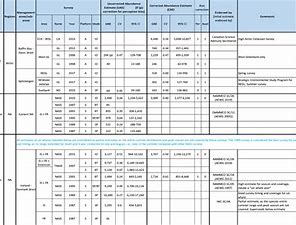
The purpose of this table is to present the best available abundance estimates for cetacean species in areas of relevance to the work of NAMMCO. It is intended to be used as a starting point for researchers, and the original sources are provided if additional information is required. The Scientific Committee of NAMMCO maintains a Working Group on Abundance Estimates, composed of invited experts in the field as well as some Committee members. This Working Group meets periodically to review new abundance estimates from recent surveys or, in some cases, re-analyses of older data. The reports of the Working Group are brought to the Scientific Committee at their annual meetings, and used to formulate advice on stock status, allowable removals or other matters. In most cases, the Scientific Committee will formally endorse estimates approved by the Working Group, and if so, this is indicated on the Table. Some estimates have been endorsed by the Scientific Committee of the International Whaling Commission (IWC).
-

Assessments run at AFWG provide the scientific basis for the management of cod, haddock, saithe, redfish, Greenland halibut and capelin in subareas 1 and 2. Taking the catch values provided by the Norwegian fisheries ministry for Norwegian catches1 and raising the total landed value to the total catches gives an approximate nominal first-hand landed value for the combined AFWG stocks of ca. 20 billion NOK or ca. 2 billion EUR (2018 estimates).
-

The Plankton Lifeform Extraction Tool brings together disparate European plankton datasets into a central database from which it extracts abundance time series of plankton functional groups, called “lifeforms”, according to shared biological traits. This tool has been designed to make complex plankton datasets accessible and meaningful for policy, public interest, and scientific discovery. The Plankton Lifeform Extraction Tool currently integrates 155 000 samples, containing over 44 million plankton records, from nine different plankton datasets within UK and European seas, collected between 1924 and 2017. Additional datasets can be added, and time series can be updated.
-

We assembled a dataset of 14C-based productivity measurements to understand the critical variables required for accurate assessment of daily depth-integrated phytoplankton carbon fixation (PP(PPeu)u) from measurements of sea surface pigment concentrations (Csat)(Csat). From this dataset, we developed a light-dependent, depth-resolved model for carbon fixation (VGPM) that partitions environmental factors affecting primary production into those that influence the relative vertical distribution of primary production (Pz)z) and those that control the optimal assimilation efficiency of the productivity profile (P(PBopt). The VGPM accounted for 79% of the observed variability in Pz and 86% of the variability in PPeu by using measured values of PBopt. Our results indicate that the accuracy of productivity algorithms in estimating PPeu is dependent primarily upon the ability to accurately represent variability in Pbopt. We developed a temperature-dependent Pbopt model that was used in conjunction with monthly climatological images of Csat sea surface temperature, and cloud-corrected estimates of surface irradiance to calculate a global annual phytoplankton carbon fixation (PPannu) rate of 43.5 Pg C yr‒1. The geographical distribution of PPannu was distinctly different than results from previous models. Our results illustrate the importance of focusing Pbopt model development on temporal and spatial, rather than the vertical, variability.
-
Understanding how much inorganic fertilizer (referred to as fertilizer) is applied to different crops at national, regional and global levels is an essential component of fertilizer consumption analysis and demand projection. Good information on fertilizer use by crop (FUBC) is rarely available because it is difficult to collect and time-consuming to process and validate. To fill this gap, a first global FUBC report was published in 1992 for the 1990/1991 period, based on an expert survey conducted jointly by the Food and Agriculture Organization (FAO) of the UN, the International Fertilizer Development Center (IFDC) and the International Fertilizer Association (IFA). Since then, similar expert surveys have been carried out and published every two to four years in the main fertilizer-consuming countries. Since 2008 IFA has led these efforts and, to our knowledge, remains the only globally available data set on FUBC. This dataset includes data (in CSV format) from a survey carried out by IFA to represent the 2017–18 period as well as a collation of all historic FUBC data.
-

Species distribution models (Maxent) predicting the distribution of two Vulnerable Marine Ecosystems (VME): the reef-forming Scleractinian coral Desmophyllum pertusum and the aggregations forming Hexactinellid sponge Pheronema carpenteri. Both of these species are VME indicator taxa and form habitat that enhance deep-sea diversity (Ross and Howell, 2013). Maps of the likely distribution of the habitat formed by these two species will enable efficient Marine Spatial planning to facilitate their conservation. This work was performed at the University of Plymouth in 2021. A GIS layer is provided for each species.
-

This dataset comprises the global frequency, classification and distribution of marine heat waves (MHWs) from 1996-2020, in Chauhan et al. 2023 (https://doi.org/10.3389/fmars.2023.1177571). The classification was done based on their attributes and using different baselines. Daily SST values were extracted from the NOAA-OISST v2 high-resolution (0.25°) dataset from 1982-2020. MHWs were detected using the method presented by Hobday et al. 2016 (https://doi.org/10.1016/j.pocean.2015.12.014), and by using the 95th percentile of the accumulated temperature distribution to flag the extreme events. A shifting baseline of 8-year rolling period was selected between the years 1982-1996, since this period shows relatively stable maximum values of temperature across different ocean regions. The shifting baseline aims to account for the decadal changes of westerly winds, temperatures and ocean gyres circulations. The classification was done using the KMeans clustering algorithm to identify the relevant features of MHWs and classify them into separate groups based on feature similarities. This algorithm takes MHW features, namely duration, maximum intensity, rate onset and rate decline, as input vectors and applies clustering in the 4-dimensional feature space where each data point represents an MHW event. Note that all the MHWs features are standardized because unequal variances can put more weight on variables with smaller variances. This record comprehends the geospatial datasets of: Average number of MHW days per year (i.e., the sum of all MHW days divided by the total number of years, 1996-2020). Average cumulative intensity per year (i.e., the sum of cumulative intensity divided by the total number of years, 1996-2020). Total number of MHW events across the different periods averaged on the total number of years (1989-2020). The period 1982-1988 was only used as an initial baseline without calculating MHWs. Spatial distribution of three MHW categories: moderate MHWs, abrupt and Intense MHWs and extreme MHWs; displaying the total number of MHW days normalized by the number of years considered (i.e., 1989-2020). Distribution of Extreme MHWs across the different periods (A) 1989-1996, (B) 1997-2004, (C) 2005-2012, (D) 2013-2020. The relative frequency (γ) is a ratio of extreme MHWs in a specific period and all extreme MHWs in the same cluster for all periods.
 Catalogue PIGMA