 Catalogue PIGMA
Bio-geographical regions
Type of resources
Available actions
Topics
Keywords
Contact for the resource
Provided by
Years
Formats
Representation types
Update frequencies
status
Scale
Resolution
-
Annual time series of Eels Production per country [tons]
-
Combination MPAs and monitoring stations for biodiversity elements
-

The code and files contained in this repository support replication of a broad-scale benthic habitat classification of the South Atlantic produced by McQuaid et al. (2023). We used statistical clustering algorithms to classify broad-scale (10km2) environmental data into distinct habitat classes, which reflect variation in physical conditions and we assume support distinct biological communities. We request that any use of the input data is referenced as per the table below, and that classification outputs are referenced as: McQuaid K. A. Bridges A. E. H., Howell K. L., Gandra T. B. R., de Souza V., Currie J. C., Hogg O. T., Pearman T. R. R., Bell J. B. B., Atkinson L. J., Baum D., Bonetti J., Carranza A., Defeo O., Furey T., Gasalla M. A., Golding N, Hampton S. L., Horta S., Jones D. O. B., Lombard A. T., Manca E., Marin Y., Martin S., Mortensen P., Passdore C., Piechaud N., Sink K. J. & Yool A. 2023. Broad-scale benthic habitat classification of the South Atlantic. Progress in Oceanography. DOI: https://doi.org/10.1016/j.pocean.2023.103016
-
Assess whether the MPA network constitutes a representative and coherent network as described in article 13 of the Marine Strategy Framework Directive 3 products were specified to achieve the second objectif of the challenge: ATLANTIC_CH02_Product_2 / Quantitative analyse of MPA coherency The product comprises 4 components: Distribution of vulnerable marine habitats : Shape represent the distribution of different vulnérable habitats Distribution biologically or ecologically significant areas (EBSAs) Critical areas of vulnerable species Distribution of indicator species The method used computes the percentage coverage between : Vulnerable habitats like carbon sinks, reef, kelp... Ecologically or biologically significant area Life critical area (feeding , breeding, migratory routes, spawning, dispersal larvea, nursery…) for indicator species Distribution of indicator species in the study area and MPA network location.
-
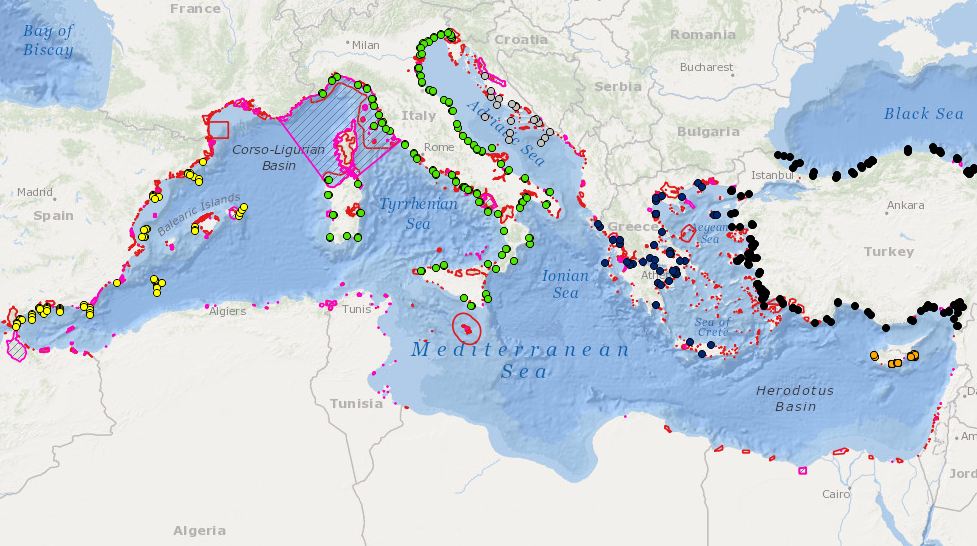
Combination MPAs and monitoring stations for biodiversity elements
-
Annual time series of Eels Production per country [tons]
-

-
-
