 Catalogue PIGMA
Celtic Sea
Type of resources
Available actions
Topics
Keywords
Contact for the resource
Provided by
Years
Formats
Representation types
Update frequencies
status
Scale
Resolution
-

EVHOE (« Evaluation Halieutique de l’Ouest Européen ») surveys provide observational data on bentho-demersal communities on the continental shelves of the Bay of Biscay and the Celtic Sea for more than 30 years. The surveys operate a standardized bottom trawling gear and are conducted from 15 to 600 m depth, usually in the fourth quarter of the year, starting at the end of October. The main objectives are the monitoring of 22 commercial stocks of fish species and 10 cephalopods from the North-East Atlantic. The dataset also provide a description of regional diversity, including 250 taxa of fish, 45 taxa of cephalopods and others “commercial” invertebrates and, from 2008, more than 350 other taxa of benthic invertebrates. The acquisition of this dataset, organised by IFREMER, is steered by the IBTS working group organised within the framework of ICES. It is being funded by the European DCMAP programme, in coordination with the French Directorate-General for Maritime Affairs, Fisheries and Aquaculture (DGAMPA). This dataset is of great interest for the long-term monitoring of the continental shelves of the Bay of Biscay and the Celtic Sea. Moreover, on a larger scale, by being integrated into a European network of bottom trawl surveys, these data play an essential role in studying the evolution of ecosystems from continental shelves to the scale of the eastern North Atlantic. From April 2025, the proposed data have been updated in the latest standard format recognised by IFREMER (‘ELFIC’ format). The 5 data tables are compiled in a .zip file which also contains a document detailing the content of each table and their respective data fields.
-
EMODnet Chemistry aims to provide access to marine chemistry datasets and derived data products concerning eutrophication, acidity and contaminants. The importance of the selected substances and other parameters relates to the Marine Strategy Framework Directive (MSFD). This European aggregated dataset contains all unrestricted EMODnet Chemistry data on potential hazardous substances, despite the fact that some data might not be related to pollution (e.g. collected by deep corer). Temperature, salinity and additional parameters are included when available. It covers the Artic Ocean, the North East Atlantic, the Greater North Sea and Celtic Seas, the Baltic Sea, the Mediterranean Sea and the Black Sea. It is produced by the merging of the regional data sets for the above mentioned six regions. Regional datasets were harmonised and validated regionally by: 'Institute of Marine Research - Norwegian Marine Data Centre (NMD)' (Norway), 'IFREMER / IDM / SISMER - Scientific Information Systems for the SEA' (France), 'Aarhus University, Department of Bioscience, Marine Ecology Roskilde' (Denmark), 'Swedish Meteorological and Hydrological Institute (SMHI)' (Sweden), 'Hellenic Centre for Marine Research, Hellenic National Oceanographic Data Centre (HCMR/HNODC)' (Greece) and 'National Institute for Marine Research and Development 'Grigore Antipa' (Romania). Regional datasets concerning contaminants are automatically harvested and the resulting collections are harmonised and validated using ODV Software and following a common methodology for all sea regions ( https://doi.org/10.6092/8b52e8d7-dc92-4305-9337-7634a5cae3f4). Parameter names are based on P01 vocabulary, which relates to BODC Parameter Usage Vocabulary and is available at: https://vocab.nerc.ac.uk/search_nvs/P01/. The European aggregated and harmonized contaminant dataset contains water, sediment and biota profiles and timeseries. The temporal coverage is 1970–2024 for water measurements, 1966–2023 for sediment measurements and 1972–2022 for biota measurements. The European aggregated and harmonized contaminant dataset can be downloaded as an ODV spreadsheet, which is composed of a metadata header followed by tab separated values. This spreadsheet can be imported into ODV Software for visualization (more information can be found at: https://www.seadatanet.org/Software/ODV). In addition, the same dataset is offered also as a txt file in a long/vertical format, in which each P01 measurement is a record line. Additionally, there are a series of columns that split P01 terms into subcomponents (substance, CAS number, matrix...). This transposed format is more adapted to worksheet applications (e.g. LibreOffice Calc).
-
EMODnet Chemistry aims to provide access to marine chemistry datasets and derived data products concerning eutrophication, acidity and contaminants. The importance of the selected substances and other parameters relates to the Marine Strategy Framework Directive (MSFD). This European aggregated dataset contains all unrestricted EMODnet Chemistry data on potential hazardous substances, despite the fact that some data might not be related to pollution (e.g. collected by deep corer). Temperature, salinity and additional parameters are included when available. It covers the Artic Ocean, the North East Atlantic, the Greater North Sea and Celtic Seas, the Baltic Sea, the Mediterranean Sea and the Black Sea. It is produced by the merging of the regional data sets for the above mentioned six regions. Regional datasets were harmonised and validated regionally by: 'Institute of Marine Research - Norwegian Marine Data Centre (NMD)' (Norway), 'IFREMER / IDM / SISMER - Scientific Information Systems for the SEA' (France), 'Aarhus University, Department of Bioscience, Marine Ecology Roskilde' (Denmark), 'Swedish Meteorological and Hydrological Institute (SMHI)' (Sweden), 'Hellenic Centre for Marine Research, Hellenic National Oceanographic Data Centre (HCMR/HNODC)' (Greece) and 'National Institute for Marine Research and Development 'Grigore Antipa' (Romania). Regional datasets concerning contaminants are automatically harvested and the resulting collections are harmonised and validated using ODV Software and following a common methodology for all sea regions ( https://doi.org/10.6092/8b52e8d7-dc92-4305-9337-7634a5cae3f4). Parameter names are based on P01 vocabulary, which relates to BODC Parameter Usage Vocabulary and is available at: https://vocab.nerc.ac.uk/search_nvs/P01/. The European aggregated and harmonized contaminant dataset contains water, sediment and biota profiles and timeseries. The temporal coverage is 1974–2021 for water measurements, 1966–2022 for sediment measurements and 1979–2021 for biota measurements. The European aggregated and harmonized contaminant dataset can be downloaded as an ODV spreadsheet, which is composed of a metadata header followed by tab separated values. This spreadsheet can be imported into ODV Software for visualization (more information can be found at: https://www.seadatanet.org/Software/ODV). In addition, the same dataset is offered also as a txt file in a long/vertical format, in which each P01 measurement is a record line. Additionally, there are a series of columns that split P01 terms into subcomponents (substance, CAS number, matrix...). This transposed format is more adapted to worksheet applications (e.g. LibreOffice Calc).
-
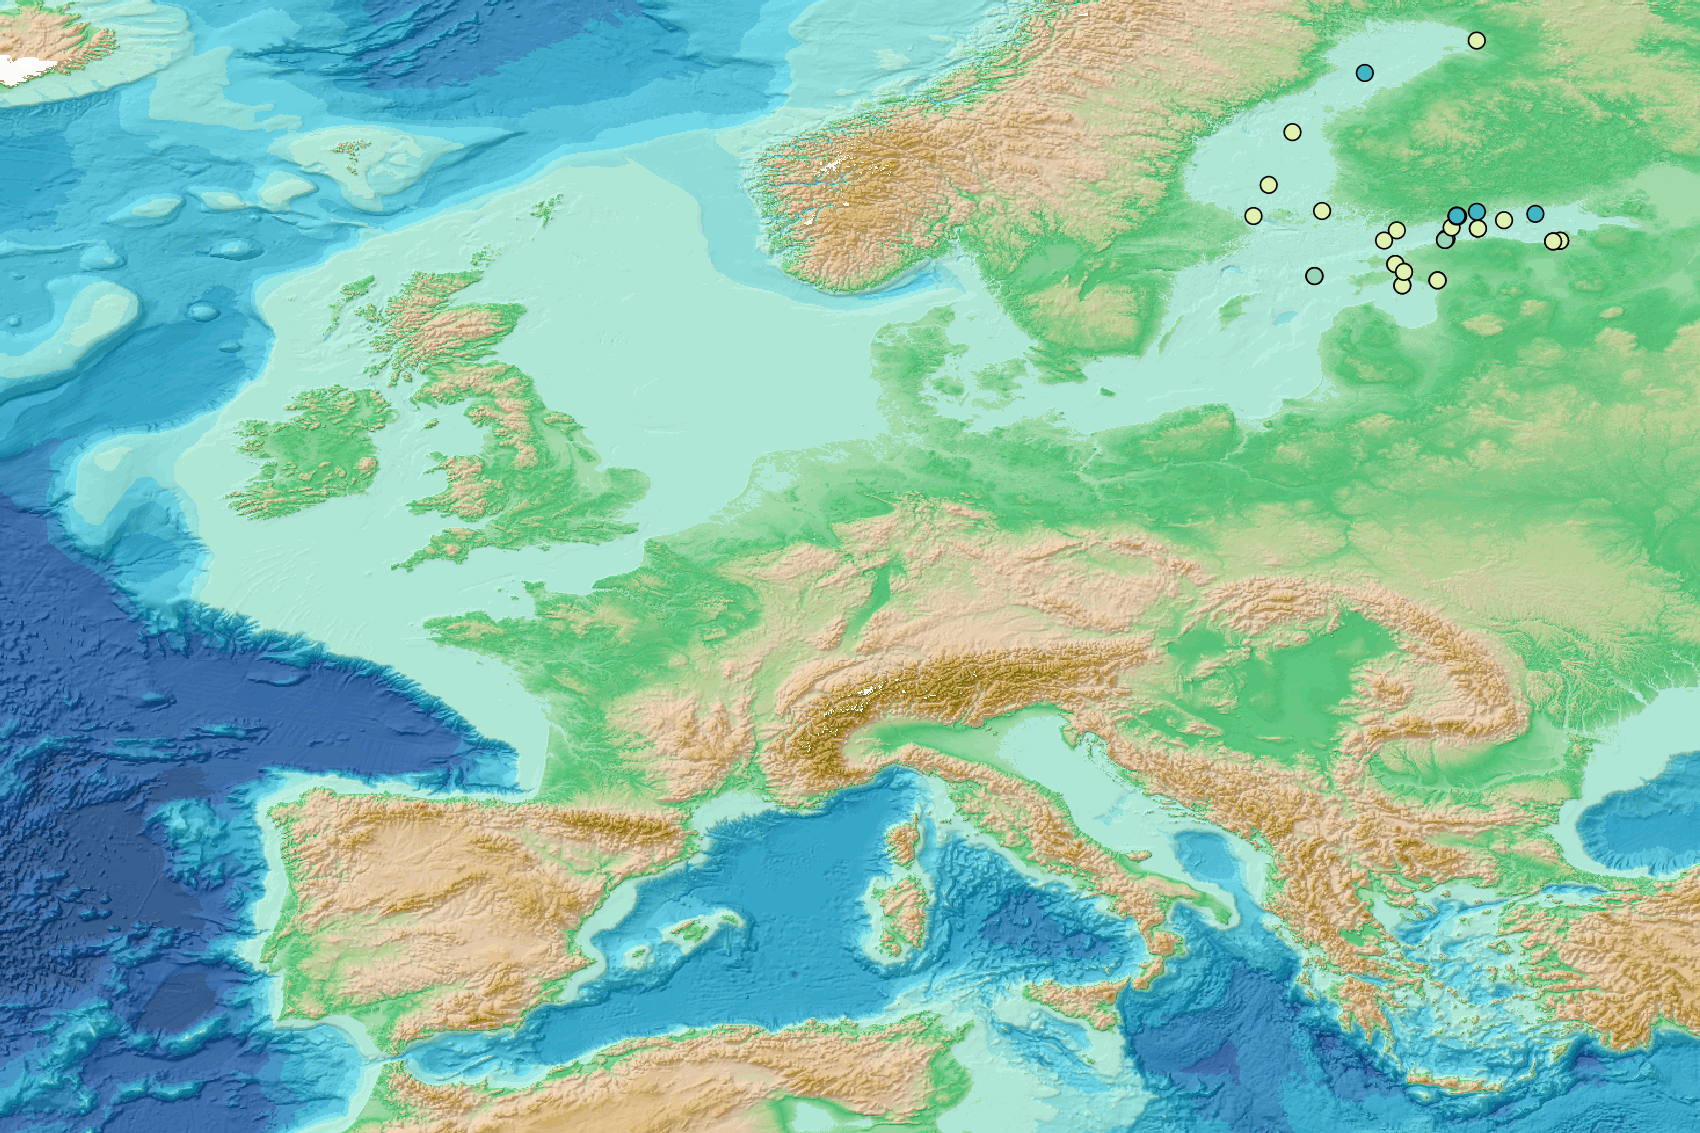
This data set presents the resulting assessment grid (based on the EEA reference grid) with the classification of chemical status of the transitional, coastal and marine waters in the context of the Water Framework Directive (WFD) and the Marine Strategy Framework Directive (MSFD), providing a mapping of contamination 'problem areas' and 'non-problem areas' based on measurements of biological effects. This classification has been performed using the CHASE+ tool, with classifications of the of contaminant status of indicators of biological effects. The status is evaluated in five classes, where NPAhigh and NPAgood are recognised as ‘non-problem areas’ and PAmoderate, PApoor and PAbad are recognised as ‘problem areas’. Monitoring biological effects is restricted to a few indicators (e.g. imposex) and data coverage is currently limited. Biological effects have thus been addressed in only 134 assessment units, mostly in the Baltic Sea, the North Sea and the North-East Atlantic Ocean. This data set underpins the findings and cartographic representations published in the EEA report “Contaminants in Europe’s seas” (No 25/2018). See the mentioned report for further information.
-

This visualization product displays the density of floating micro-litter per net normalized per km² per year from specific protocols different from research and monitoring protocols. EMODnet Chemistry included the collection of marine litter in its 3rd phase. Before 2021, there was no coordinated effort at the regional or European scale for micro-litter. Given this situation, EMODnet Chemistry proposed to adopt the data gathering and data management approach as generally applied for marine data, i.e., populating metadata and data in the CDI Data Discovery and Access service using dedicated SeaDataNet data transport formats. EMODnet Chemistry is currently the official EU collector of micro-litter data from Marine Strategy Framework Directive (MSFD) National Monitoring activities (descriptor 10). A series of specific standard vocabularies or standard terms related to micro-litter have been added to SeaDataNet NVS (NERC Vocabulary Server) Common Vocabularies to describe the micro-litter. European micro-litter data are collected by the National Oceanographic Data Centres (NODCs). Micro-litter map products are generated from NODCs data after a test of the aggregated collection including data and data format checks and data harmonization. A filter is applied to represent only micro-litter sampled according to a very specific protocol such as the Volvo Ocean Race (VOR) or Oceaneye. Densities were calculated for each net using the following calculation: Density (number of particles per km²) = Micro-litter count / (Sampling effort (km) * Net opening (cm) * 0.00001) When the number of microlitters or the net opening was not filled, it was not possible to calculate the density. Percentiles 50, 75, 95 & 99 have been calculated taking into account data for all years. Warning: the absence of data on the map does no't necessarily mean that they do not exist, but that no information has been entered in the National Oceanographic Data Centre (NODC) for this area.
-

This visualization product displays the density of floating micro-litter per net normalized in grams per km² per year from specific protocols different from research and monitoring protocols. EMODnet Chemistry included the collection of marine litter in its 3rd phase. Before 2021, there was no coordinated effort at the regional or European scale for micro-litter. Given this situation, EMODnet Chemistry proposed to adopt the data gathering and data management approach as generally applied for marine data, i.e., populating metadata and data in the CDI Data Discovery and Access service using dedicated SeaDataNet data transport formats. EMODnet Chemistry is currently the official EU collector of micro-litter data from Marine Strategy Framework Directive (MSFD) National Monitoring activities (descriptor 10). A series of specific standard vocabularies or standard terms related to micro-litter have been added to SeaDataNet NVS (NERC Vocabulary Server) Common Vocabularies to describe the micro-litter. European micro-litter data are collected by the National Oceanographic Data Centres (NODCs). Micro-litter map products are generated from NODCs data after a test of the aggregated collection including data and data format checks and data harmonization. A filter is applied to represent only micro-litter sampled according to a very specific protocol such as the Volvo Ocean Race (VOR) or Oceaneye. Densities were calculated for each net using the following calculation: Density (weight of particles per km²) = Micro-litter weight / (Sampling effort (km) * Net opening (cm) * 0.00001) When the weight of microlitters or the net opening was not filled, it was not possible to calculate the density. Percentiles 50, 75, 95 & 99 have been calculated taking into account data for all years. Warning: the absence of data on the map does not necessarily mean that they do not exist, but that no information has been entered in the National Oceanographic Data Centre (NODC) for this area.
-
This dataset presents the resulting assessment grid (based on the EEA reference grid) with the classification of chemical status of the transitional, coastal and marine waters in the context of the Water Framework Directive (WFD) and the Marine Strategy Framework Directive (MSFD). This classification has been performed using the CHASE+ tool, with classifications of the matrices ‘water’, ‘sediment’ and ‘biota’ and indicators of ‘biological effects’, as well as an integrated classification of chemical status, combining results of all matrices. The chemical status is evaluated in five classes, where NPAhigh and NPAgood are recognised as ‘non-problem areas’ and PAmoderate, PApoor and PAbad are recognised as ‘problem areas’. This is the assessment made excluding concentrations of mercury (Hg). The overall area of interest used is based on the marine regions and subregions under the Marine Strategy Framework Directive. Additionally, Norwegian (Barent Sea and Norwegian Sea) and Icelandic waters (’Iceland Sea’) have been added (see Surrounding seas of Europe). Note that within the North East Atlantic region only the subregions within EEZ boundaries (~200 nm) have been included. This dataset underpins the findings and cartographic representations published in the report "Contaminants in Europe's Seas" (EEA, 2019).
-
This visualization product displays the density of floating micro-litter per net normalized per liter per year from research and monitoring protocols. EMODnet Chemistry included the collection of marine litter in its 3rd phase. Before 2021, there was no coordinated effort at the regional or European scale for micro-litter. Given this situation, EMODnet Chemistry proposed to adopt the data gathering and data management approach as generally applied for marine data, i.e., populating metadata and data in the CDI Data Discovery and Access service using dedicated SeaDataNet data transport formats. EMODnet Chemistry is currently the official EU collector of micro-litter data from Marine Strategy Framework Directive (MSFD) National Monitoring activities (descriptor 10). A series of specific standard vocabularies or standard terms related to micro-litter have been added to SeaDataNet NVS (NERC Vocabulary Server) Common Vocabularies to describe the micro-litter. European micro-litter data are collected by the National Oceanographic Data Centres (NODCs). Micro-litter map products are generated from NODCs data after a test of the aggregated collection including data and data format checks and data harmonization. A filter is applied to represent only micro-litter sampled according to research and monitoring protocols as MSFD monitoring. Densities were calculated for each net using the following calculation: Density (number of particles per liter) = Micro-litter count / Sampling effort (l) When the number of microlitters was not filled, the density could not be calculated. Percentiles 50, 75, 95 & 99 have been calculated taking into account data for all years. Warning: the absence of data on the map doesn't necessarily mean that they don't exist, but that no information has been entered in the National Oceanographic Data Centre (NODC) for this area.
-

This visualization product displays the type of litter in percent per net per year from research and monitoring protocols. EMODnet Chemistry included the collection of marine litter in its 3rd phase. Before 2021, there was no coordinated effort at the regional or European scale for micro-litter. Given this situation, EMODnet Chemistry proposed to adopt the data gathering and data management approach as generally applied for marine data, i.e., populating metadata and data in the CDI Data Discovery and Access service using dedicated SeaDataNet data transport formats. EMODnet Chemistry is currently the official EU collector of micro-litter data from Marine Strategy Framework Directive (MSFD) National Monitoring activities (descriptor 10). A series of specific standard vocabularies or standard terms related to micro-litter have been added to SeaDataNet NVS (NERC Vocabulary Server) Common Vocabularies to describe the micro-litter. European micro-litter data are collected by the National Oceanographic Data Centres (NODCs). Micro-litter map products are generated from NODCs data after a test of the aggregated collection including data and data format checks and data harmonization. A filter is applied to represent only micro-litter sampled according to research and monitoring protocols as MSFD monitoring. To calculate percentages for each type, formula applied is: Type (%) = (∑number of particles of each type)*100 / (∑number of particles of all type) When the number of micro-litters was not filled or was equal zero, it was not possible to calculate the percentage. Standard vocabularies for micro-litter types are taken from Seadatanet's H01 library (https://vocab.seadatanet.org/v_bodc_vocab_v2/search.asp?lib=H01 ). Some morphological types of micro-litters may have been sampled but were not defined by the protocole applied during the survey. They are represented as « undefined micro-litter items ». Warnings: - the absence of data on the map does not necessarily mean that they do not exist, but that no information has been entered in the National Oceanographic Data Centre (NODC) for this area. - since 03/07/2023, the preferred label « Undefined micro-litter items » has been integrated into the H01 library whereas the labels « microplastic items », « non-plastic man-made micro-particles (e.g. glass, metal, tar) » and «non-plastic filaments (natural fibres, rubber) » have been deprecated. When defined, the material or polymer type can be checked directly in the source data.
-

This visualization product displays the density of floating micro-litter per net normalized per km² per year from research and monitoring protocols. EMODnet Chemistry included the collection of marine litter in its 3rd phase. Before 2021, there was no coordinated effort at the regional or European scale for micro-litter. Given this situation, EMODnet Chemistry proposed to adopt the data gathering and data management approach as generally applied for marine data, i.e., populating metadata and data in the CDI Data Discovery and Access service using dedicated SeaDataNet data transport formats. EMODnet Chemistry is currently the official EU collector of micro-litter data from Marine Strategy Framework Directive (MSFD) National Monitoring activities (descriptor 10). A series of specific standard vocabularies or standard terms related to micro-litter have been added to SeaDataNet NVS (NERC Vocabulary Server) Common Vocabularies to describe the micro-litter. European micro-litter data are collected by the National Oceanographic Data Centres (NODCs). Micro-litter map products are generated from NODCs data after a test of the aggregated collection including data and data format checks and data harmonization. A filter is applied to represent only micro-litter sampled according to research and monitoring protocols as MSFD monitoring. Densities were calculated for each net using the following calculation: Density (number of particles per km²) = Micro-litter count / (Sampling effort (km) * Net opening (cm) * 0.00001) When information about the sampling effort (km) was lacking and point coordinates were known (start and end of the sampling), the sampling effort was calculated using the PostGIS ST_DistanceSpheroid function with a WGS84 measurement spheroid. When the number of micro-litters or the net opening was not filled, it was not possible to calculate the density. Percentiles 50, 75, 95 & 99 have been calculated taking into account data for all years. Warning: the absence of data on the map does not necessarily mean that they do not exist, but that no information has been entered in the National Oceanographic Data Centre (NODC) for this area.