 Catalogue PIGMA
Historical
Type of resources
Available actions
Topics
Keywords
Contact for the resource
Provided by
Years
Formats
Representation types
status
Resolution
-
These products contain global non time critical (NTC) reprocessed (REP) Level 2P skin Sea Surface Temperature (SST) derived from SLSTR-A on Copernicus Sentinel-3 at full-resolution swath (1 km at nadir) in GHRSST compliant NetCDF format. All SSTs from the Sea and Land Surface Temperature Radiometer (SLSTR) series of instruments are SST skin measurements. For more details please see “What is SST?” on the GHRSST web pages. At night, the skin temperature is typically a few tenths of a degree cooler than the temperature measured by in situ systems; in the day, the skin can be considerably higher if strong diurnal warming is present. The SLSTRs are dual-view self-calibrating radiometers with SST retrieved from spectral bands at nominally 3.74, 10.85 and 12 µm (referred to as S7, S8 & S9). Corrections for water vapour atmospheric absorption are performed using a triple window at night, and a split window during the day as the 3.7 µm channel is not used due to solar contamination. All pixels in the dual-view part of the swath are viewed twice, via nadir and oblique views with different atmospheric path lengths, allowing for correction for aerosol effects. Consequently, there are four possible retrieved SSTs, referred to as N2 (nadir-only 11 µm and 12 µm), N3 (nadir-only 3.7 µm, 11 µm and 12 µm), D2 (dual-view 11 µm and 12 µm) and D3 (dual-view 3.7 µm, 11 µm and 12 µm). The L2P file contains the best SST available for each pixel and flags are included to identify which retrieval is used. If the observation is in the nadir-only / single-view part of swath then "sst_algorithm_types" is N2 or N3, and if the observation is in the dual-view part of swath then "sst_algorithm_types" is D2 or D3. For D2 or D3 pixels it is possible to generate their N2 or N3 equivalent by subtracting the value in the "dual_nadir_sst_difference" field. Users are advised to use only QL = 5 dual-view SSTs for reference sensor applications and to use single-view (all quality levels) and quality level 3 and 4 dual-view data only for other qualitative analysis. Users are reminded to apply the SSES bias adjustments as SLSTR-B is harmonised to SLSTR-A through SSES. Users can consider using the "theoretical_uncertainty" for weighting observations rather than the simple SSES standard deviation values. Primary access to data is via the EUMETSAT Data Store (linked below). Other access methods can be found in the EUMETSAT Product Navigator https://navigator.eumetsat.int/product/EO:EUM:DAT:0582?query=slstr&results=22&s=advanced. Please also read the EUMETSAT SLSTR Product Notices (linked below) as they provide a lot of useful information. All products currently contain SLSTRA-MAR-L2P-v1.0 as the GHRSST Collection ID in the file metadata, which will be revised in a future release.
-
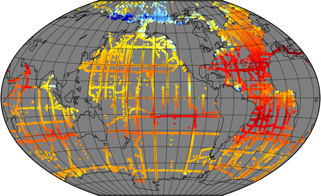
This L3U (Level 3 Uncollated) dataset contains global daily Sea Surface Temperature (SST) on a 0.02 degree grid resolution. It is produced by the National Oceanic and Atmospheric Administration (NOAA) Advanced Clear Sky Processor for Ocean (ACSPO) using L2P (Level 2 Preprocessed) product acquired from the Meteorological Operational satellite A (Metop-A) Advanced Very High Resolution Radiometer 3 (AVHRR/3) (https://podaac.jpl.nasa.gov/dataset/AVHRRF_MA-STAR-L2P-v2.80 ) in Full Resolution Area Coverage (FRAC) mode as input. It is distributed as 10-minute granules in netCDF-4 format, compliant with the Group for High Resolution Sea Surface Temperature (GHRSST) Data Specification version 2 (GDS2). There are 144 granules per 24-hour interval. Fill values are reported in all invalid pixels, including land pixels with >5 km inland. For each valid water pixel (defined as ocean, sea, lake or river), and up to 5 km inland, the following major layers are reported: SSTs and ACSPO clear-sky mask (ACSM; provided in each grid as part of l2p_flags, which also includes day/night, land, ice, twilight, and glint flags). Only input L2P SSTs with QL=5 were gridded, so all valid SSTs are recommended for the users. Per GDS2 specifications, two additional Sensor-Specific Error Statistics layers (SSES bias and standard deviation) are reported in each pixel with valid SST. Ancillary layers include wind speed and ACSPO minus reference Canadian Meteorological Centre (CMC) Level 4 (L4) SST. The ACSPO Metop-A AVHRR FRAC L3U product is monitored and validated against iQuam in situ data https://www.star.nesdis.noaa.gov/socd/sst/iquam , in the NOAA SST Quality Monitor (SQUAM) system https://www.star.nesdis.noaa.gov/socd/sst/squam . SST imagery and clear-sky mask are evaluated, and checked for consistency with L2P and other satellites/sensors SST products, in the NOAA ACSPO Regional Monitor for SST (ARMS) system https://www.star.nesdis.noaa.gov/socd/sst/arms . More information about the dataset is found at AVHRRF_MA-STAR-L2P-v2.80 and in (Pryamitsyn et al., 2021).
-
The MetOp First Generation (FG) is a European multi-satellite program jointly established by ESA and EUMETSAT, comprising three satellites, MetOp -A, -B and -C. The primary sensor onboard MetOp-FG, the Advanced Very High Resolution Radiometer/3 (AVHRR/3) contributed by NOAA, measures Earth emissions and reflectances in 5 out of 6 available bands (centered at 0.63, 0.83, 1.61, 3.7, 11 and 12 microns), in a swath of 2,600km from an 817km altitude. These data are collected in a Full Resolution Area Coverage (FRAC) mode, with pixel size of 1.1km at nadir. MetOp-A launched on 19 October 2006 is the first in the MetOp-FG series. The NOAA Advanced Clear-Sky Processor for Ocean (ACSPO) Level 2 Preprocessed (L2P) SST product is derived at the full AVHRR FRAC resolution and reported in 10 minute granules in NetCDF4 format, compliant with the GHRSST Data Specification version 2 (GDS2). Subskin SSTs are derived using the regression Nonlinear SST (NLSST) algorithm, which employs three bands (3.7, 11 and 12 microns) at night and two bands (11 and 12 microns) during the day. The ACSPO AVHRR FRAC L2P product is monitored and validated against quality controlled in situ data, provided by the NOAA in situ SST Quality Monitor system (iQuam) https://www.star.nesdis.noaa.gov/socd/sst/iquam , in another NOAA system, SST Quality Monitor (SQUAM) https://www.star.nesdis.noaa.gov/socd/sst/squam . SST imagery and clear-sky masking are continuously evaluated, and checked for consistency with other sensors and platforms, in the NOAA ACSPO Regional Monitor for SST (ARMS) system https://www.star.nesdis.noaa.gov/socd/sst/arms . MetOp-A orbital characteristics and AVHRR/3 sensor performance are tracked in the NOAA 3S system ( https://www.star.nesdis.noaa.gov/socd/sst/3s ).The L2P Near Real Time (NRT) SST files are archived at PO.DAAC with 3-6 hours latency, and then replaced by the Re-ANalysis (RAN) SST after about 2 months later with identical file names. Two features can be used to identify them: different file name time stamps and netCDF global attribute metadata source=NOAA-NCEP-GFS for NRT and source=MERRA-2 for RAN. A reduced size (0.45GB/day), equal-angle gridded (0.02-deg resolution) ACSPO L3U product is available at https://doi.org/10.5067/GHMTA-3US28
-
The ESA Sea State Climate Change Initiative (CCI) project has produced global multi-sensor time-series of along-track satellite synthetic aperture radar (SAR) integrated sea state parameters (ISSP) data from ENVISAT (referred to as SAR Wave Mode onboard ENVISAT Level 2P (L2P) ISSP data) with a particular focus for use in climate studies. This dataset contains the ENVISAT Remote Sensing Integrated Sea State Parameter product (version 1.1), which forms part of the ESA Sea State CCI version 3.0 release. This product provides along-track significant wave height (SWH) measurements at 5km resolution every 100km, processed using the Li et al., 2020 empirical model, separated per satellite and pass, including all measurements with flags and uncertainty estimates. These are expert products with rich content and no data loss. The SAR Wave Mode data used in the Sea State CCI SAR WV onboard ENVISAT Level 2P (L2P) ISSP v3 dataset come from the ENVISAT satellite mission spanning from 2002 to 2012.
-
This dataset provides Level 4 total current including geostrophy and a data-driven approach for Ekman and near-inertial current, based on a convolution between drifter observation and wind history, to fit empirically a complex and time-lag dependant transfert function between ERA5 wind stress and current The data are available through HTTP and FTP; access to the data is free and open. In order to be informed about changes and to help us keep track of data usage, we encourage users to register at: https://forms.ifremer.fr/lops-siam/access-to-esa-world-ocean-circulation-project-data/ This dataset was generated by Datlas and is distributed by Ifremer / CERSAT in the frame of the World Ocean Circulation (WOC) project funded by the European Space Agency (ESA).
-

The ESA Sea State Climate Change Initiative (CCI) project has produced global multi-sensor time-series of along-track satellite altimeter significant wave height data (referred to as Level 2P (L2P) data) with a particular focus for use in climate studies. This dataset contains the Version 4 Remote Sensing Significant Wave Height product, which provides along-track data at approximately 6 km spatial resolution, separated per satellite and pass, including all measurements with flags, bias corrections and extra parameters from other sources. These are expert products with rich content and no data loss. The altimeter data used in the Sea State CCI dataset v4 come from multiple satellite missions spanning from 1992 to 2023 (ERS-1, ERS-2, Envisat, CryoSat-2, Jason-1, Jason-2, Jason-3, SARAL, Sentinel-3 A, Sentinel-3 B, Sentinel-6 A), therefore spanning over a larger time range than the previous version 3. The missions already retracked (with WHALES) in version 3 were not reprocessed, but extended when applicable. Many altimeters are bi-frequency (Ku-C or Ku-S) and only measurements in Ku band were used, for consistency reasons, being available on each altimeter but SARAL (Ka band). **The version 4 of this dataset now supersedes the previous version 3.**
-
The ESA Sea State Climate Change Initiative (CCI) project has produced global multi-sensor time-series of along-track satellite synthetic aperture radar (SAR) integrated sea state parameters (ISSP) data from Sentinel-1 (referred to as SAR WV onboard Sentinel-1 Level 2P (L2P) ISSP data) with a particular focus for use in climate studies. This dataset contains the Sentinel-1 SAR Remote Sensing Integrated Sea State Parameter product (v1.0), which forms part of the ESA Sea State CCI version 3.0 release. This product provides along-track primary significant wave height measurements and secondary sea state parameters, calibrated with CMEMS model data and reference in situ measurements at 20km resolution every 100km, processed using the Pleskachevsky et. al., 2021 emprical model, separated per satellite and pass, including all measurements with flags and uncertainty estimates. These are expert products with rich content and no data loss. The SAR Wave Mode data used in the Sea State CCI SAR WV onboard Sentinel-1 Level 2P (L2P) ISSP v3 dataset come from the Sentinel-1 satellite missions spanning from 2014 to 2021 (Sentinel-1 A, Sentinel-1 B).
-
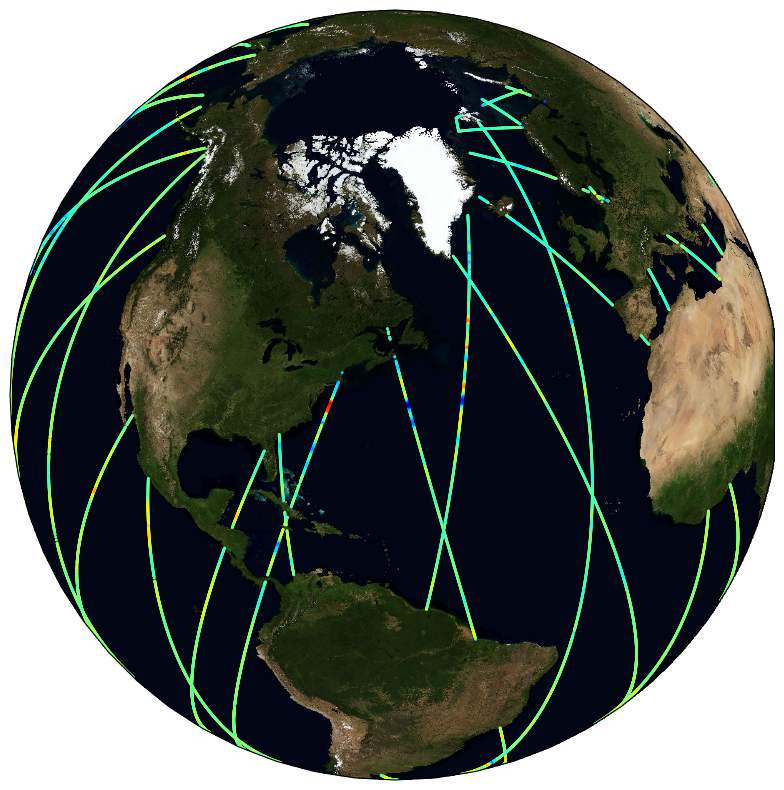
Satellite altimeters routinely supply sea surface height (SSH) measurements which are key observations to monitor ocean dynamics. However, below a wavelength of about 70 km, along-track altimeter measurements are often characterized by a dramatic drop in the signal-to-noise ratio, making it very challenging to fully exploit available altimeter observations to precisely analyze small mesoscale variations in SSH. Although various approaches have been proposed and applied to identify and filter noise from measurements, no distinctive methodology emerged to be systematically applied in operational products. To best cope with this unresolved issue, the Copernicus Marine Environment Monitoring Service (CMEMS) actually provides simple band-pass filtered data to mitigate noise contamination in the along-track SSH signals and more innovative and adapted noise filtering methods are thus left to users seeking to unveil small-scale altimeter signals. Here demonstrated, a fully data-driven approach is developed and applied to provide robust estimates of noise-free Sea Level Anomaly (SLA) signals. The method combines Empirical Mode Decomposition (EMD), to help analyze non-stationary and non-linear processes, and an adaptive noise filtering technique inspired by Discrete Wavelet Transform (DWT) decompositions. It is now found to best resolve the distribution of the sea surface height variability in the mesoscale 30-120 km wavelength band. A practical uncertainty variable is attached to the denoised SLA estimates that accounts for errors related to the local signal to noise ratio, but also for uncertainties in the denoising process, which assumes that SLA variability results in part from a stochastic process. Here, measurements from the Jason-3, Sentinel-3 A and SARAL/AltiKa altimeters are processed and analyzed, and their energy spectral and seasonal distributions characterized in the small mesoscale domain. Anticipating data from the upcoming Surface Water and Ocean Topography (SWOT) mission, these denoised SLA measurements for three reference altimeter missions already yield valuable opportunities to assess global small mesoscale kinetic energy distributions. This dataset was developed within the Ocean Surface Topography Science Team (OSTST) activities. A grant was awarded to the SASSA (Satellite Altimeter Short-scale Signals Analysis) project by the TOSCA board in the framework of the CNES/EUMETSAT call CNES-DSP/OT 12-2118. Altimeter data were provided by the Copernicus Marine Environment Monitoring Service (CMEMS) and by the Sea State Climate Change Initiative (CCI) project.
-
In recent years, large datasets of in situ marine carbonate system parameters (partial pressure of CO2 (pCO2), total alkalinity, dissolved inorganic carbon and pH) have been collated. These carbonate system datasets have highly variable data density in both space and time, especially in the case of pCO2, which is routinely measured at high frequency using underway measuring systems. This variation in data density can create biases when the data are used, for example for algorithm assessment, favouring datasets or regions with high data density. A common way to overcome data density issues is to bin the data into cells of equal latitude and longitude extent. This leads to bins with spatial areas that are latitude and projection dependent (eg become smaller and more elongated as the poles are approached). Additionally, as bin boundaries are defined without reference to the spatial distribution of the data or to geographical features, data clusters may be divided sub-optimally (eg a bin covering a region with a strong gradient). To overcome these problems and to provide a tool for matching in situ data with satellite, model and climatological data, which often have very different spatiotemporal scales both from the in situ data and from each other, a methodology has been created to group in situ data into ‘regions of interest’, spatiotemporal cylinders consisting of circles on the Earth’s surface extending over a period of time. These regions of interest are optimally adjusted to contain as many in situ measurements as possible. All in situ measurements of the same parameter contained in a region of interest are collated, including estimated uncertainties and regional summary statistics. The same grouping is done for each of the other datasets, producing a dataset of matchups. About 35 million in situ datapoints were then matched with data from five satellite sources and five model and re-analysis datasets to produce a global matchup dataset of carbonate system data, consisting of 287,000 regions of interest spanning 54 years from 1957 to 2020. Each region of interest is 100 km in diameter and 10 days in duration. An example application, the reparameterisation of a global total alkalinity algorithm, is shown. This matchup dataset can be updated as and when in situ and other datasets are updated, and similar datasets at finer spatiotemporal scale can be constructed, for example to enable regional studies. This dataset was funded by ESA Satellite Oceanographic Datasets for Acidification (OceanSODA) project which aims at developing the use of satellite Earth Observation for studying and monitoring marine carbonate chemistry. **This version is now superseded by the version 4 with higher spatial and temporal resolution**
-
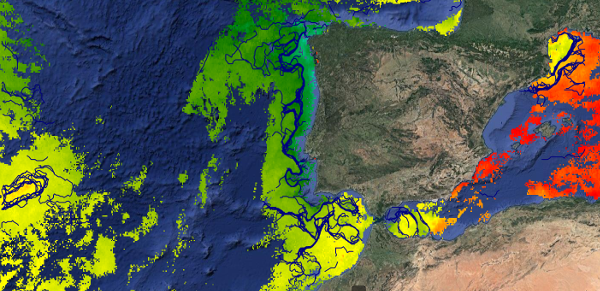
This dataset provides detections of fronts derived from high resolution remote sensing SST observations by SEVIRI L3C from OSISAF over Western Europe region. The data are available through HTTP and FTP; access to the data is free and open. In order to be informed about changes and to help us keep track of data usage, we encourage users to register at: https://forms.ifremer.fr/lops-siam/access-to-esa-world-ocean-circulation-project-data/ This dataset was generated by OceanDataLab and is distributed by Ifremer / CERSAT in the frame of the World Ocean Circulation (WOC) project funded by the European Space Agency (ESA).