 Catalogue PIGMA
Ionian Sea
Type of resources
Available actions
Topics
Keywords
Contact for the resource
Provided by
Years
Formats
Representation types
Update frequencies
Scale
Resolution
-
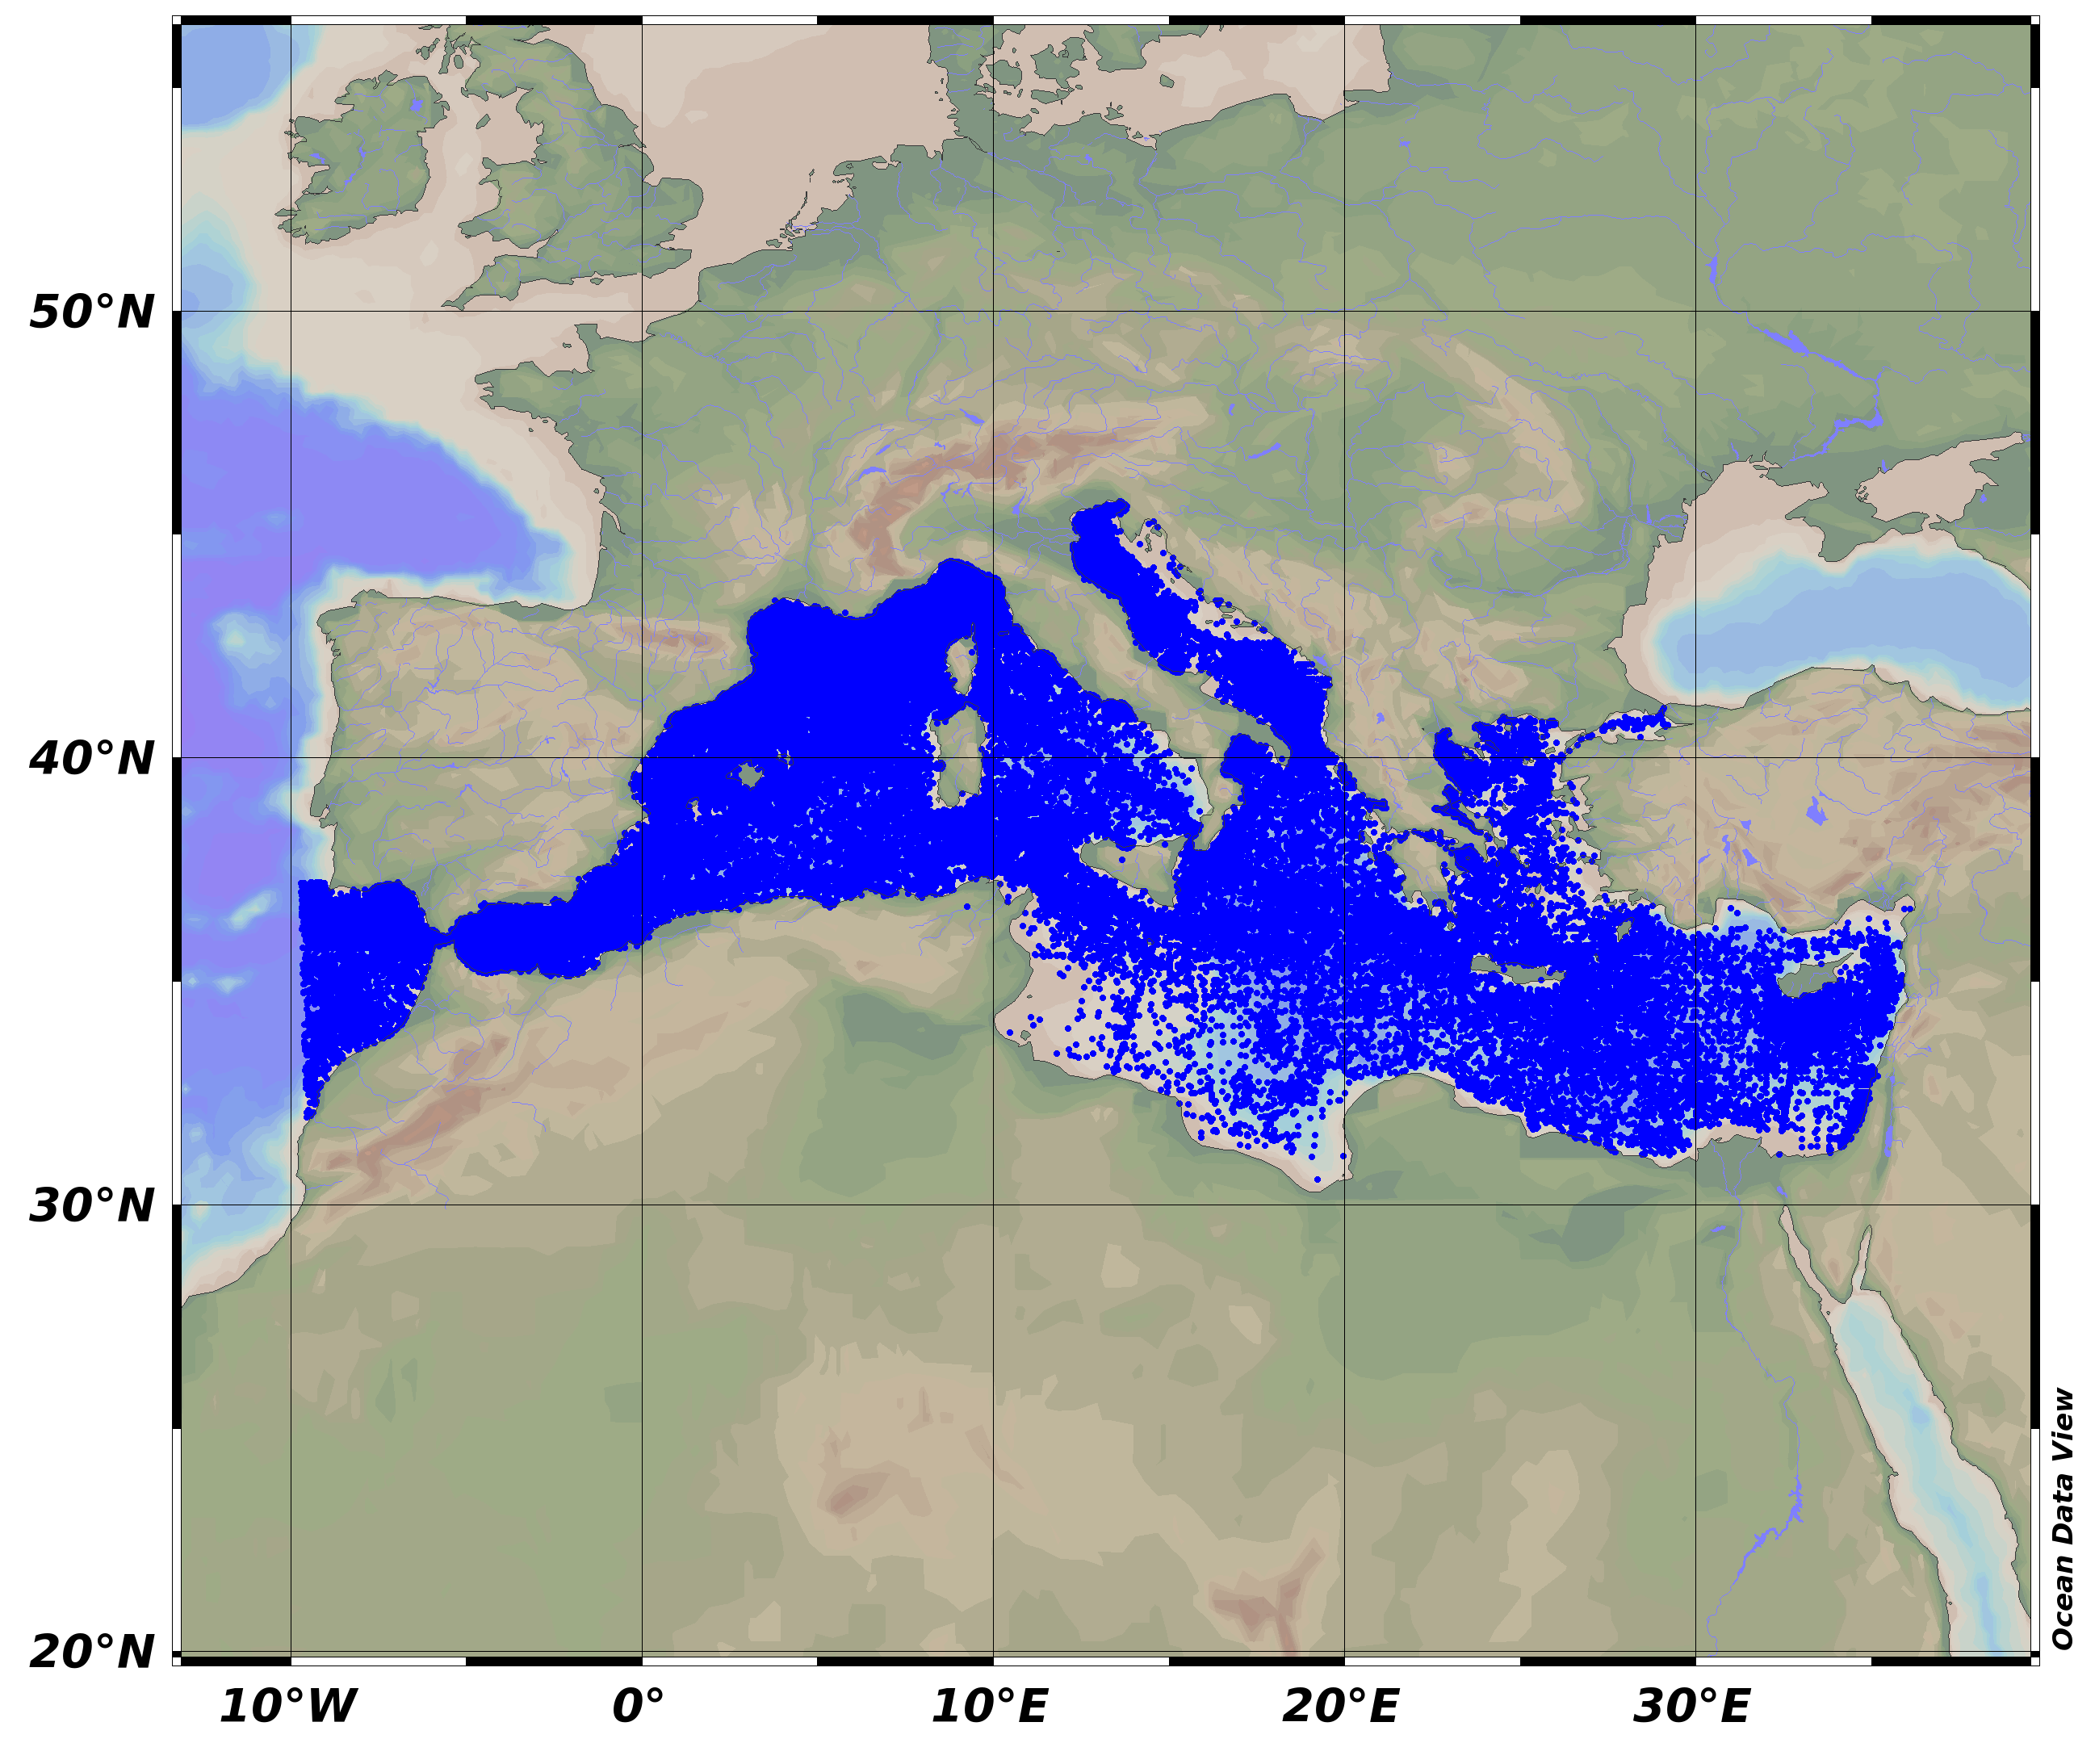
SeaDataNet Temperature and Salinity historical data collection for the Mediterranean Sea contains all open access temperature and salinity in situ data retrieved from SeaDataNet infrastructure. The data span between -9.25 and 37 degrees of longitude, thus including an Atlantic box and Marmara Sea. It covers the time period 1900-2015. Data have been quality checked using ODV software. Quality Flags of anomalous data have been revised using basic QC procedures. For data access please register at http://www.marine-id.org The dataset format is ODV binary collections. You can read, analyse and export from the ODV application provided by Alfred Wegener institute at http://odv.awi.de/
-
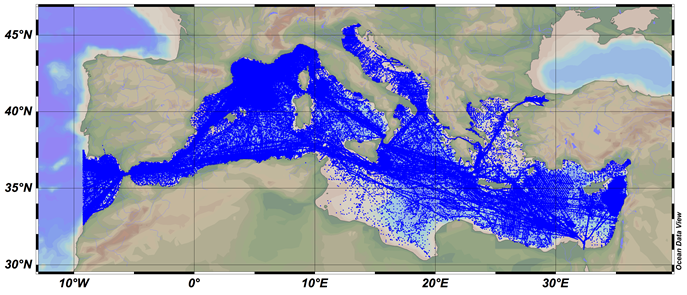
SDC_MED_DATA_TS_V1 SeaDataCloud Temperature and Salinity data collection for the Mediterranean Sea contains all open access temperature and salinity in situ data retrieved from SeaDataNet infrastructure at the end of October 2017. The data span between -9.25 and 37 degrees of longitude, thus including an Atlantic box and the Marmara Sea. It covers the time period 1900-2017. Data have been quality checked using ODV 5.0 software. Quality Flags of anomalous data have been revised using basic QC procedures. The dataset format is ODV binary collections. You can read, analyse and export from the ODV application provided by Alfred Wegener institute at http://odv.awi.de/. For data access please register at http://www.marine-id.org/.
-
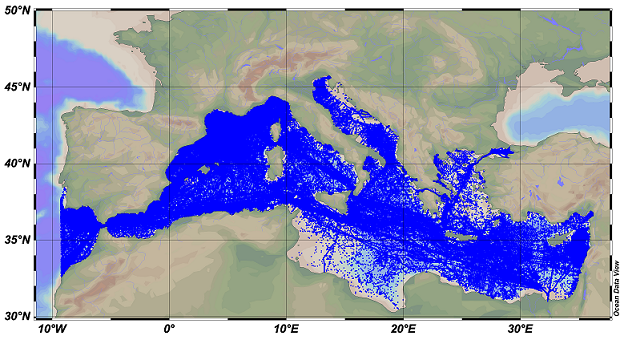
SDC_MED_DATA_TS_V2 SeaDataCloud Temperature and Salinity data collection for the Mediterranean Sea contains all open access temperature and salinity in situ data retrieved from SeaDataNet infrastructure at the end of July 2019. The data span between -9.25 and 37 degrees of longitude, thus including an Atlantic box and the Marmara Sea. It covers the time period 1900-2019. Data have been quality checked using ODV 5.3.2 software. Quality Flags of anomalous data have been revised using basic QC procedures. The dataset format is ODV binary collections. You can read, analyse and export from the ODV application provided by Alfred Wegener institute at http://odv.awi.de/. For data access please register at http://www.marine-id.org/.
-
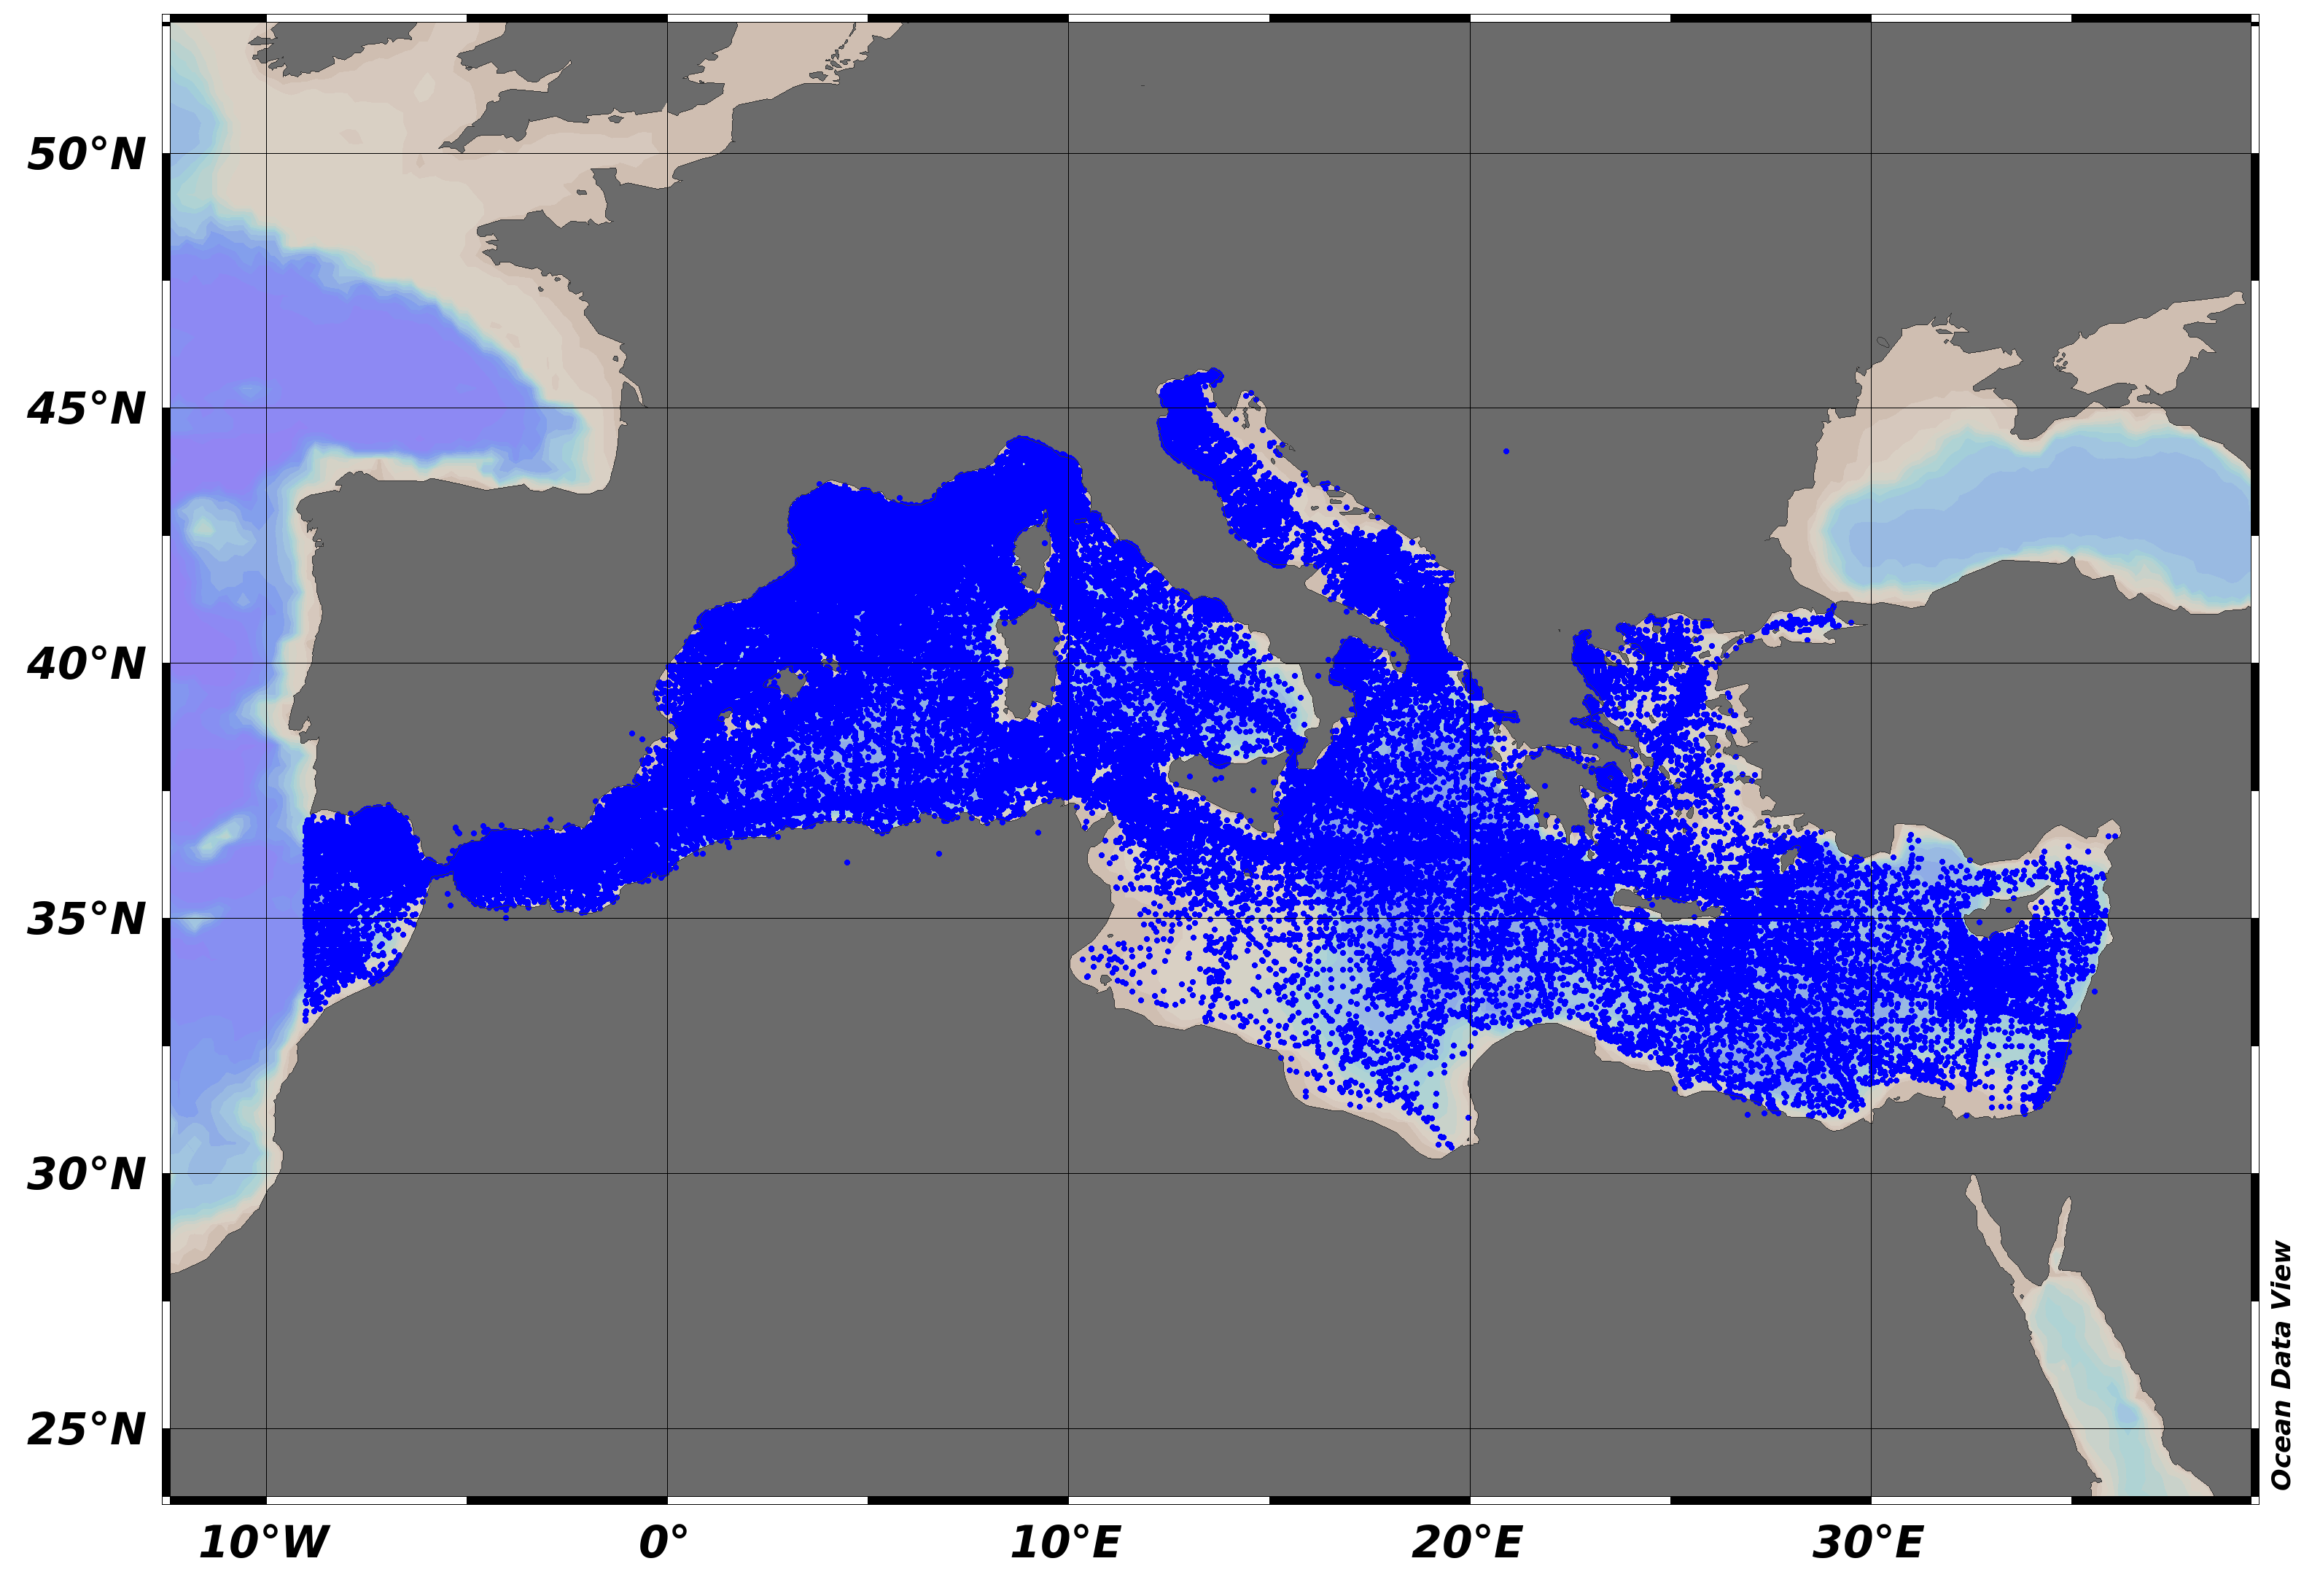
SeaDataNet Temperature and Salinity historical data collection contains all open access temperature and salinity in situ data retrieved from SeaDataNet infrastructure at the end of 2013. The data span between -9.25 and 37 degrees of longitude, thus including an Atlantic box and Marmara Sea, and cover the time period 1900-2012. Data have been quality checked using ODV software. Quality Flags of anomalous data have been revised using basic QC procedures. For data access please register at http://www.marine-id.org The dataset format is ODV binary collections. You can read, analyse and export from the ODV application provided by Alfred Wegener institute at http://odv.awi.de/
-
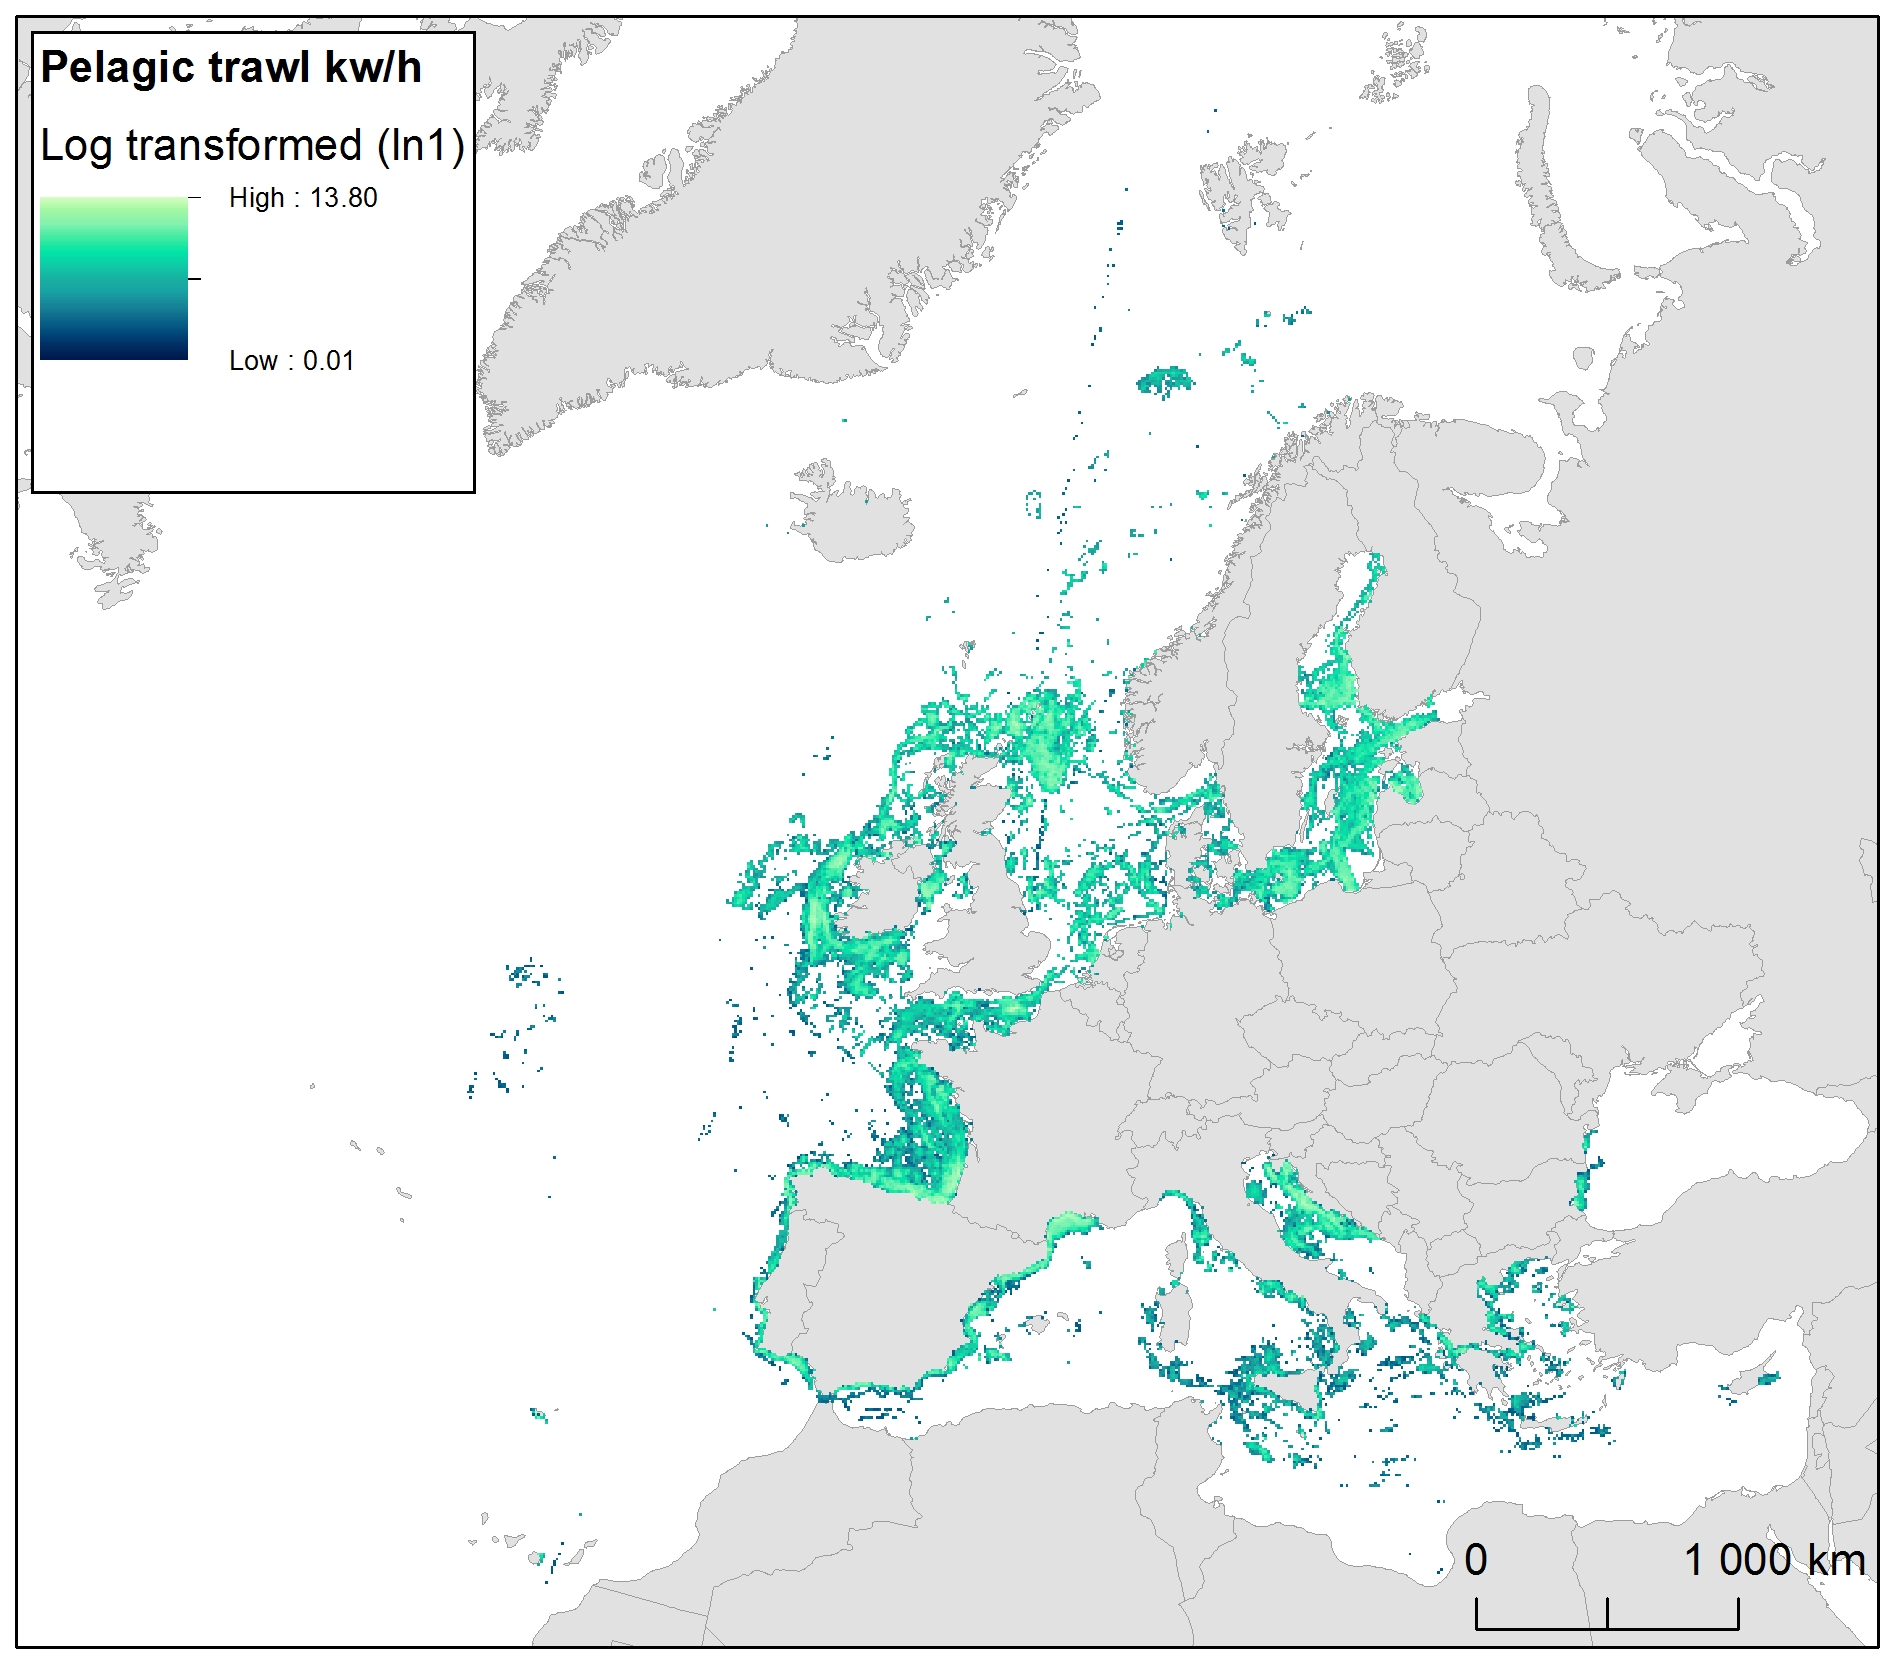
The raster dataset represents fishing intensity (kilowatt per fishing hour) by pelagic towed gears in the European seas. The dataset has been derived from Automatic Identification System (AIS) based pelagic fishing intensity data received from the European Commission’s Joint Research Centre - Independent experts of the Scientific, Technical and Economic Committee for Fisheries (JRC STECF), as well as from Vessel Monitoring System (VMS) and logbook based pelagic fishing effort data from HELCOM Commission. The temporal extent varies between the data sources (between 2013 and 2015). The dataset has been transformed to a logarithmic scale (ln1). This dataset has been prepared for the calculation of the combined effect index, produced for the ETC/ICM Report 4/2019 "Multiple pressures and their combined effects in Europe's seas" available on: https://www.eionet.europa.eu/etcs/etc-icm/etc-icm-report-4-2019-multiple-pressures-and-their-combined-effects-in-europes-seas-1.
-
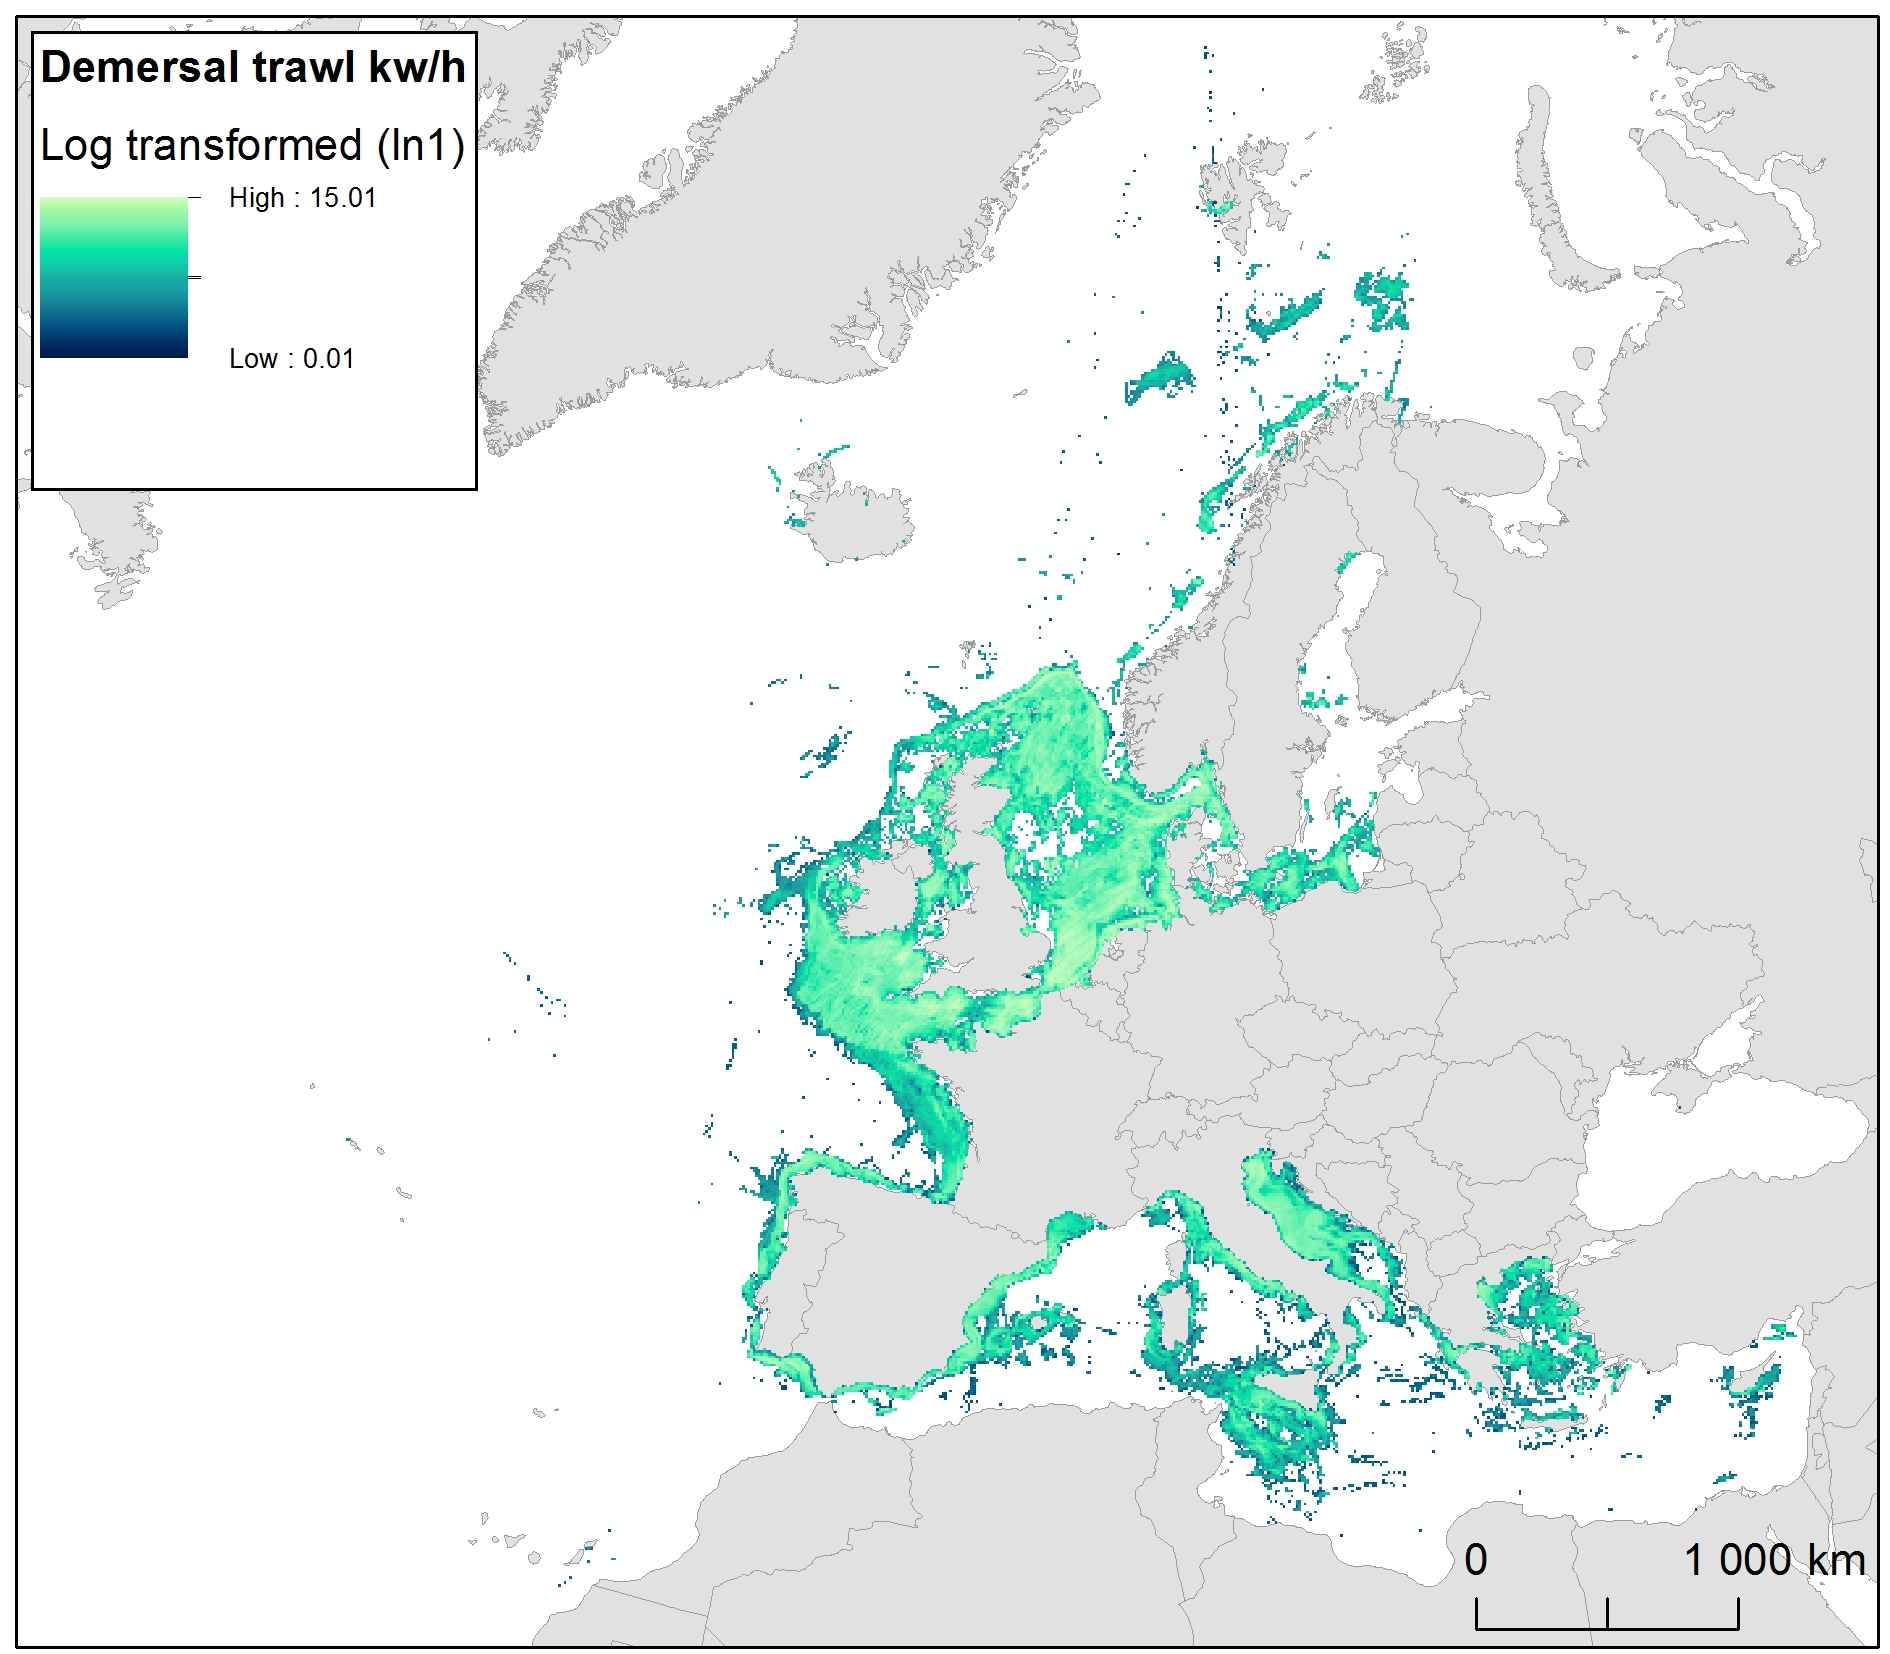
The raster dataset represents bycatch fishing intensity (kilowatt per fishing hour) from bottom touching mobile gears in the European seas. The dataset has been derived from Automatic Identification System (AIS) based demersal fishing intensity data received from the European Commission’s Joint Research Centre - Independent experts of the Scientific, Technical and Economic Committee for Fisheries (JRC STECF) as well as Vessel Monitoring System (VMS) and logbook based demersal fishing intensity data downloaded from from OSPAR and HELCOM Commissions. The temporal extent varies between the data sources (between 2014 and 2017). OSPAR and HELCOM data superseded the JRC STECF data where they overlapped spatially. The cell values have been transformed into a logarithmic scale (ln1). This dataset has been prepared for the calculation of the combined effect index, produced for the ETC/ICM Report 4/2019 "Multiple pressures and their combined effects in Europe's seas" available on: https://www.eionet.europa.eu/etcs/etc-icm/etc-icm-report-4-2019-multiple-pressures-and-their-combined-effects-in-europes-seas-1.
-
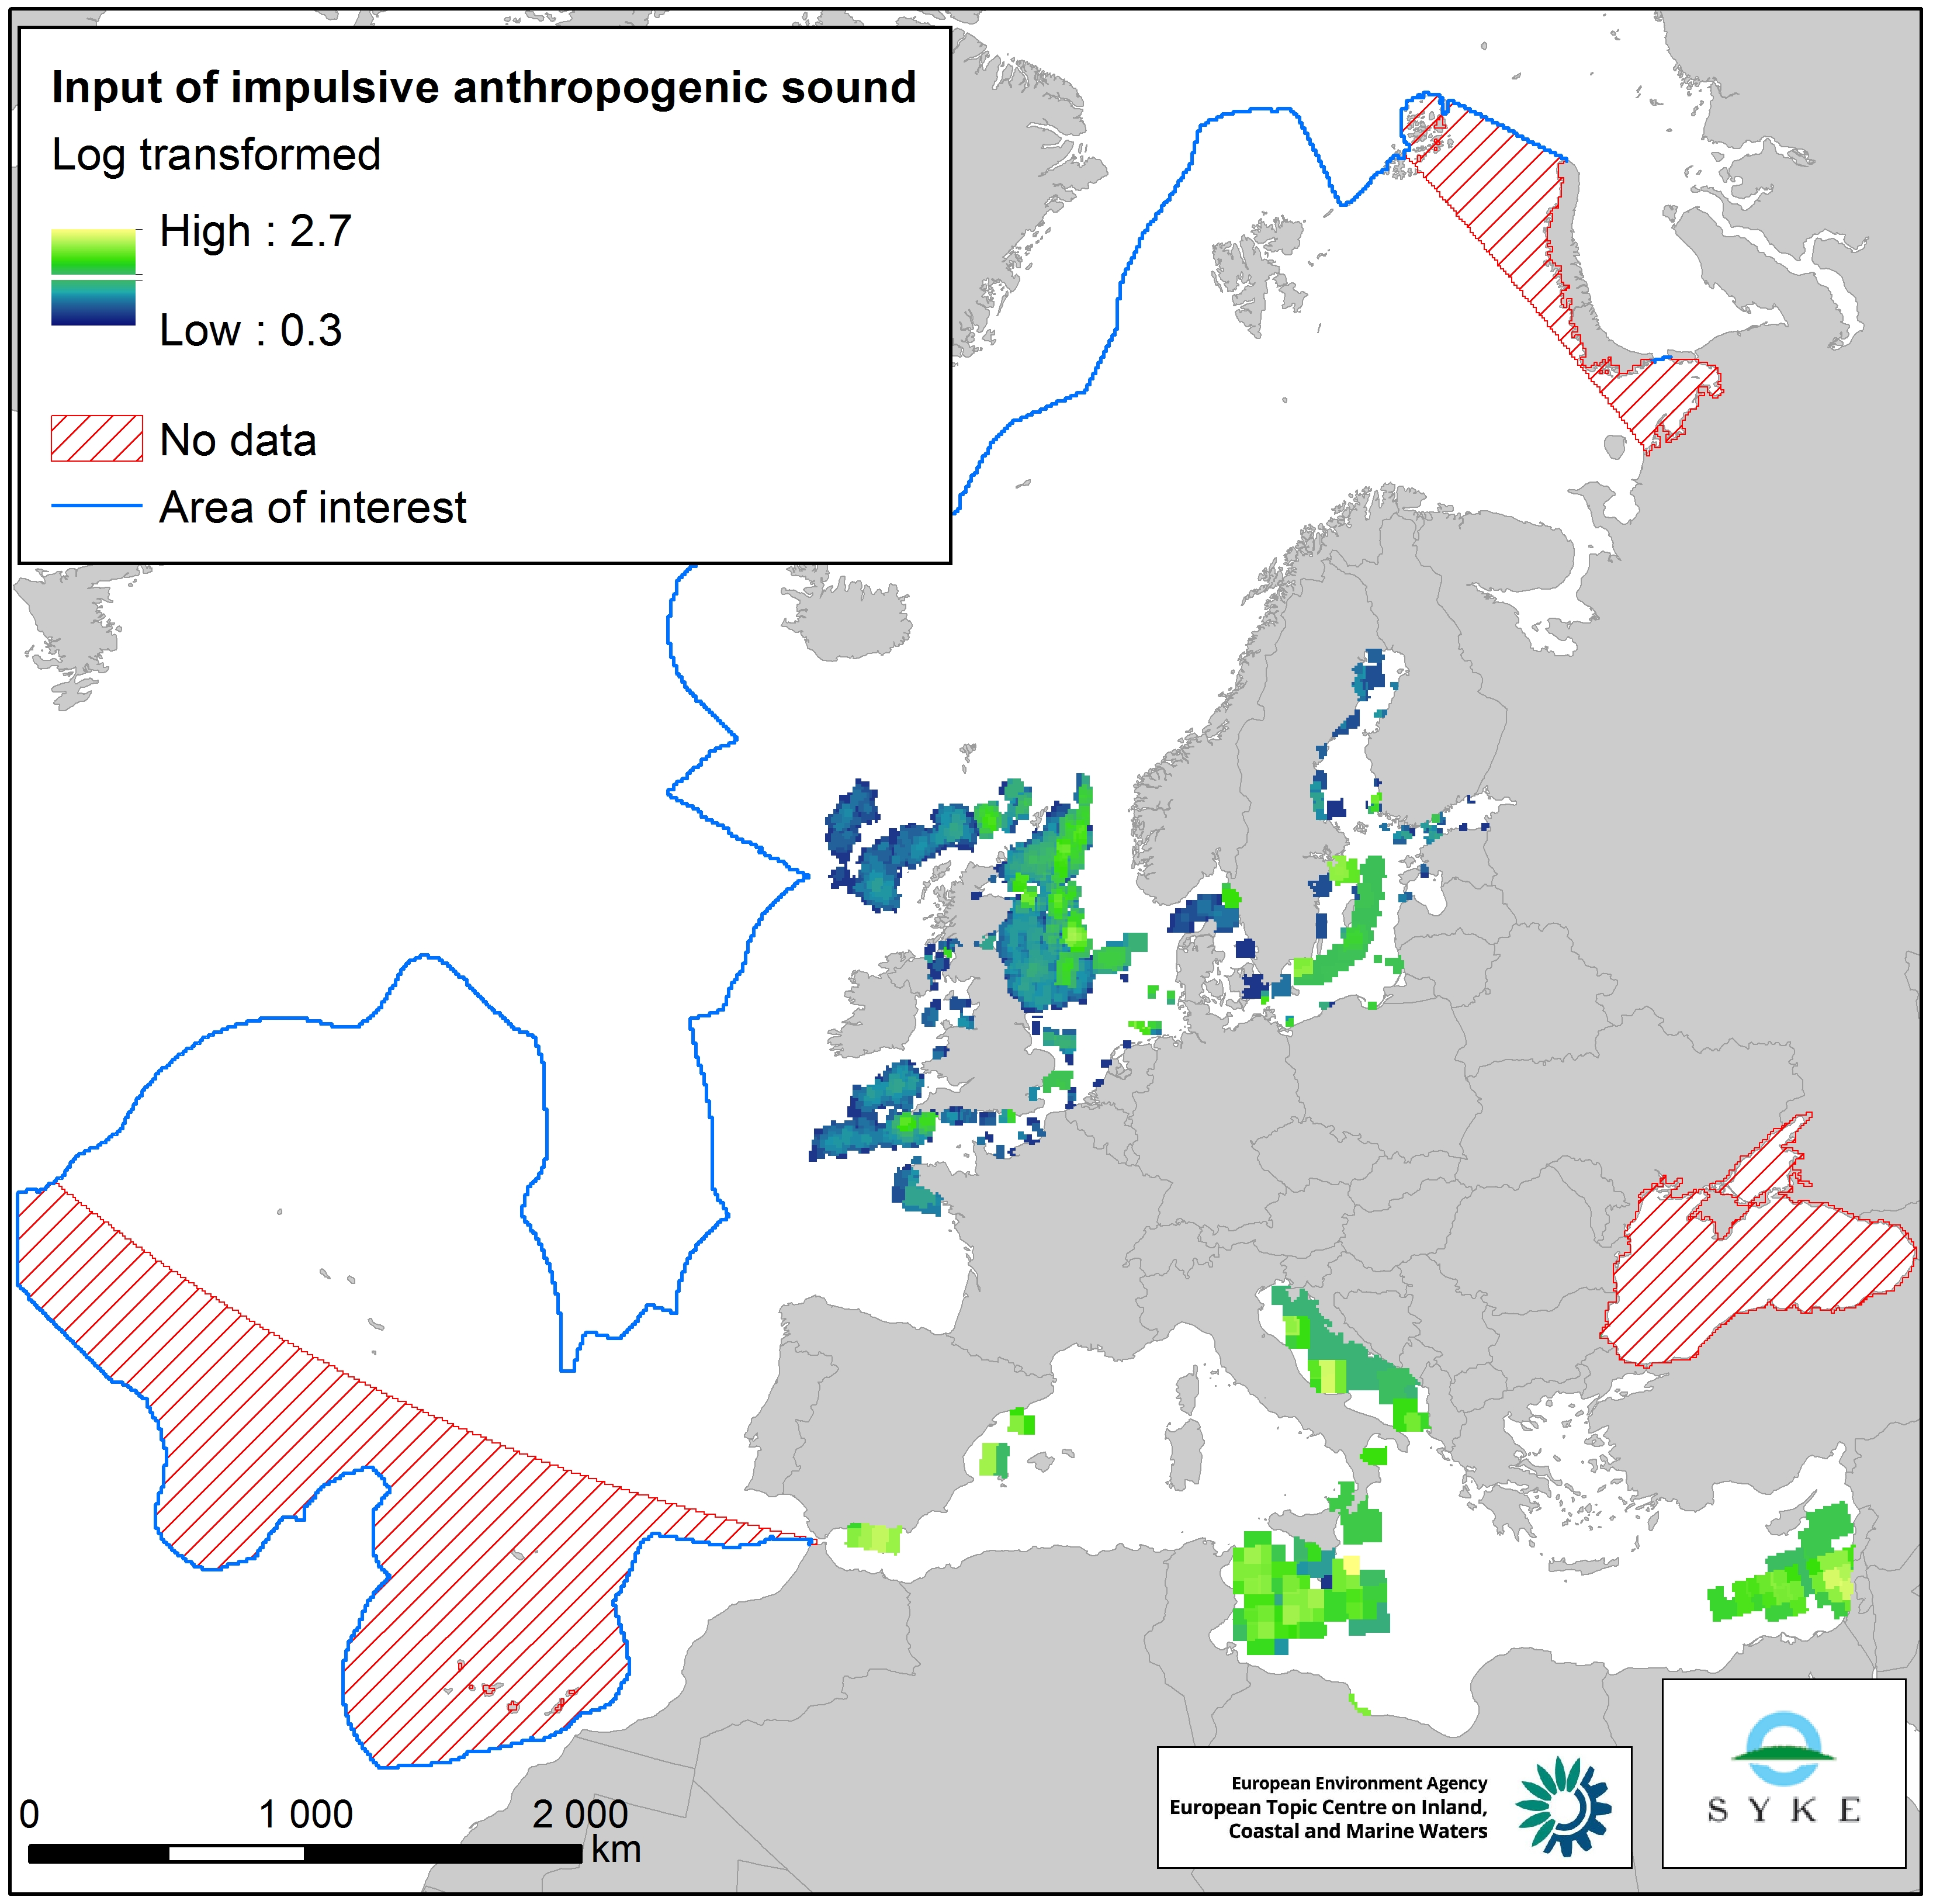
This raster dataset represents input of impulsive anthropogenic sound in Europe Seas. Impulsive sounds are typically brief with a rapid rise time, i.e. a great change in amplitude over a short period of time. The main anthropogenic sources of impulsive underwater noise are typically impact pile driving for inshore and offshore construction, seismic exploration with airguns, explosions and sonar systems. The dataset was created by combining pulse-block-days (PBD) data from the ICES Registry (for HELCOM and OSPAR areas) and ACCOMBAS (for the Mediterranean Sea), resampled using the EEA 10 km grid. The dataset does not include the Black Sea. The temporal reference of this dataset is the period 2014-2016. The cell values have been transformed into a logarithmic scale (log10). This dataset has been prepared for the calculation of the combined effect index, produced for the ETC/ICM Report 4/2019 "Multiple pressures and their combined effects in Europe's seas" available on: https://www.eionet.europa.eu/etcs/etc-icm/etc-icm-report-4-2019-multiple-pressures-and-their-combined-effects-in-europes-seas-1.
-
This visualization product displays the density of floating micro-litter per net normalized per liter per year from specific protocols different from research and monitoring protocols. EMODnet Chemistry included the collection of marine litter in its 3rd phase. Before 2021, there was no coordinated effort at the regional or European scale for micro-litter. Given this situation, EMODnet Chemistry proposed to adopt the data gathering and data management approach as generally applied for marine data, i.e., populating metadata and data in the CDI Data Discovery and Access service using dedicated SeaDataNet data transport formats. EMODnet Chemistry is currently the official EU collector of micro-litter data from Marine Strategy Framework Directive (MSFD) National Monitoring activities (descriptor 10). A series of specific standard vocabularies or standard terms related to micro-litter have been added to SeaDataNet NVS (NERC Vocabulary Server) Common Vocabularies to describe the micro-litter. European micro-litter data are collected by the National Oceanographic Data Centres (NODCs). Micro-litter map products are generated from NODCs data after a test of the aggregated collection including data and data format checks and data harmonization. A filter is applied to represent only micro-litter sampled according to a very specific protocol such as the Volvo Ocean Race (VOR) or Oceaneye. Densities were calculated for each net using the following calculation: Density (number of particles per liter) = Micro-litter count / Sampling effort (l) When the number of microlitters was not filled, the density could not be calculated. Percentiles 50, 75, 95 & 99 have been calculated taking into account data for all years. Warning: the absence of data on the map doesn't necessarily mean that they don't exist, but that no information has been entered in the National Oceanographic Data Centre (NODC) for this area.
-

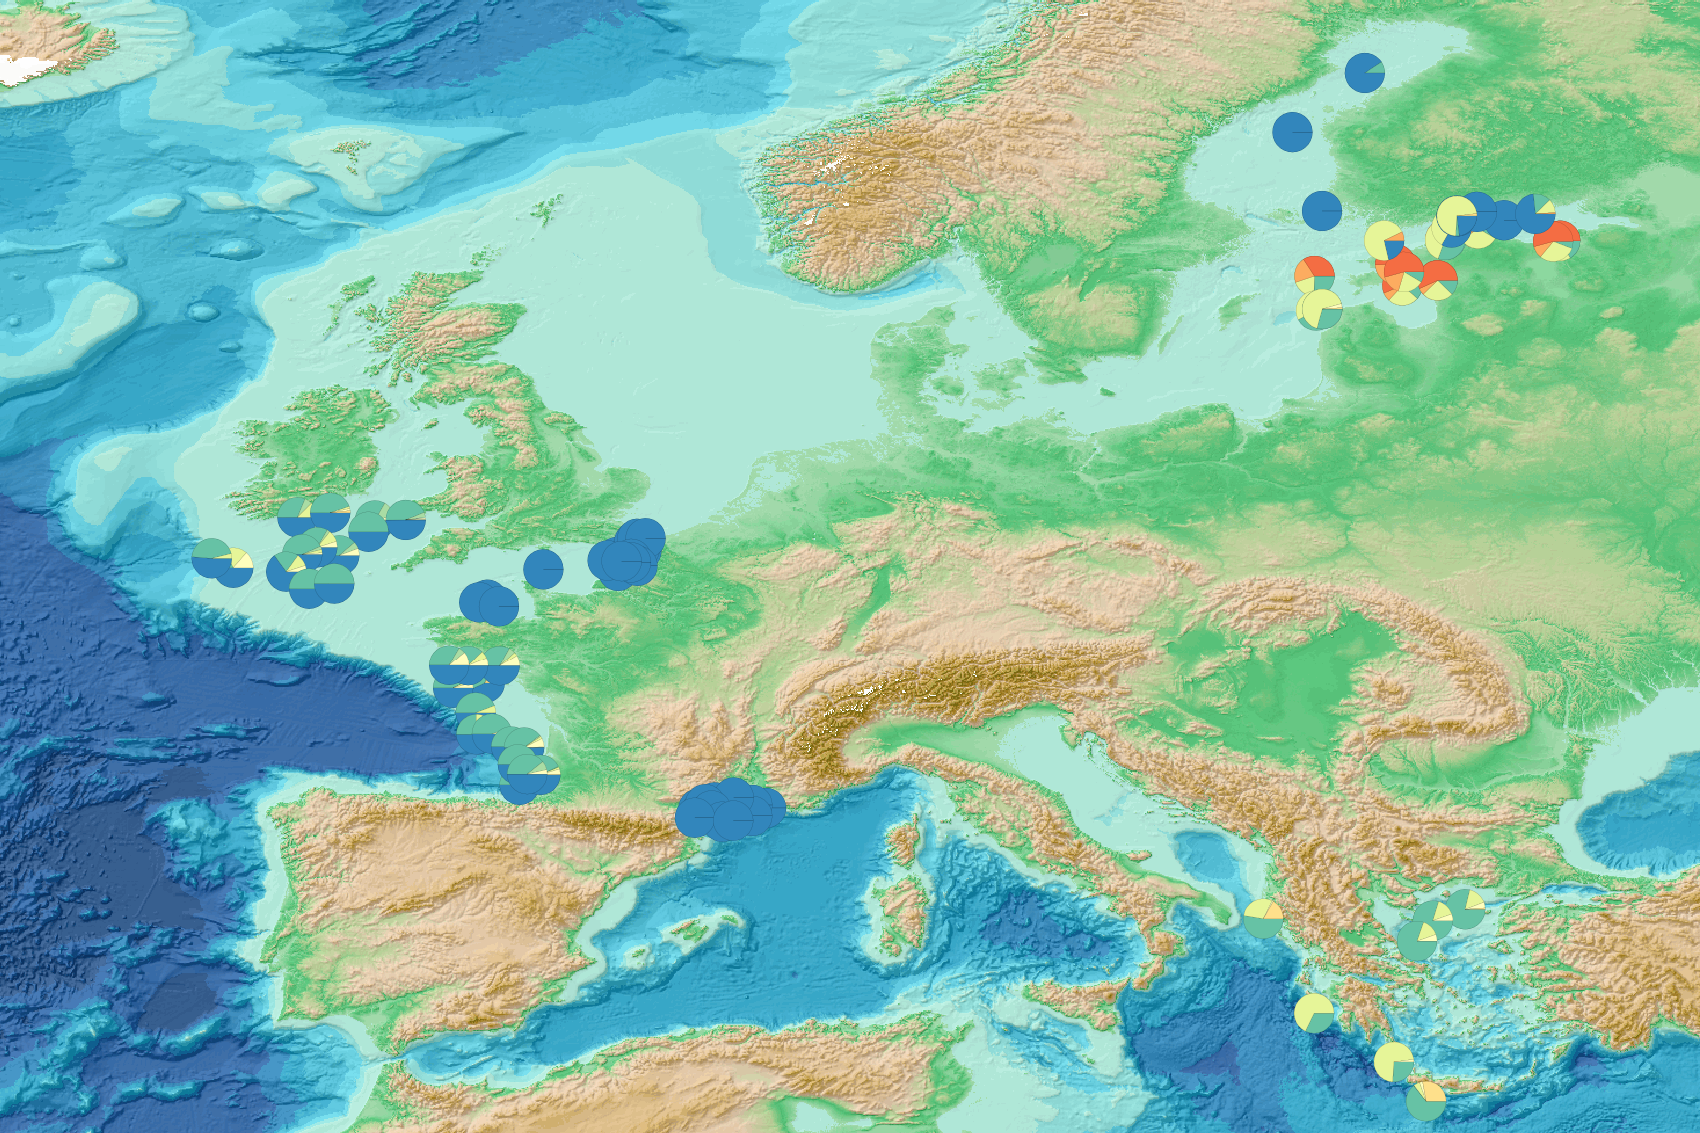
This visualization product displays the size of litter in percent per net per year from specific protocols different from research and monitoring protocols. EMODnet Chemistry included the collection of marine litter in its 3rd phase. Before 2021, there was no coordinated effort at the regional or European scale for micro-litter. Given this situation, EMODnet Chemistry proposed to adopt the data gathering and data management approach as generally applied for marine data, i.e., populating metadata and data in the CDI Data Discovery and Access service using dedicated SeaDataNet data transport formats. EMODnet Chemistry is currently the official EU collector of micro-litter data from Marine Strategy Framework Directive (MSFD) National Monitoring activities (descriptor 10). A series of specific standard vocabularies or standard terms related to micro-litter have been added to SeaDataNet NVS (NERC Vocabulary Server) Common Vocabularies to describe the micro-litter. European micro-litter data are collected by the National Oceanographic Data Centres (NODCs). Micro-litter map products are generated from NODCs data after a test of the aggregated collection including data and data format checks and data harmonization. A filter is applied to represent only micro-litter sampled according to a very specific protocol such as the Volvo Ocean Race (VOR) or Oceaneye. To calculate percentages for each size, formula applied is: Size (%) = (∑number of particles of each size)*100 / (∑number of particles of all size) When the number of micro-litters was not filled or was equal to zero, it was not possible to calculate the percentage. Standard vocabularies for micro-litter size classes are taken from Seadatanet's H03 library (https://vocab.seadatanet.org/v_bodc_vocab_v2/search.asp?lib=H03 ). Different protocols with different degrees of precision were used to classify the sampled micro-litters. Consequently, on the map, the distribution of micro-litter in the size classes depends on the protocol applied during the survey. Warning: the absence of data on the map does not necessarily mean that they do not exist, but that no information has been entered in the National Oceanographic Data Centre (NODC) for this area.
-
This visualization product displays the type of litter in percent per net per year from research and monitoring protocols. EMODnet Chemistry included the collection of marine litter in its 3rd phase. Before 2021, there was no coordinated effort at the regional or European scale for micro-litter. Given this situation, EMODnet Chemistry proposed to adopt the data gathering and data management approach as generally applied for marine data, i.e., populating metadata and data in the CDI Data Discovery and Access service using dedicated SeaDataNet data transport formats. EMODnet Chemistry is currently the official EU collector of micro-litter data from Marine Strategy Framework Directive (MSFD) National Monitoring activities (descriptor 10). A series of specific standard vocabularies or standard terms related to micro-litter have been added to SeaDataNet NVS (NERC Vocabulary Server) Common Vocabularies to describe the micro-litter. European micro-litter data are collected by the National Oceanographic Data Centres (NODCs). Micro-litter map products are generated from NODCs data after a test of the aggregated collection including data and data format checks and data harmonization. A filter is applied to represent only micro-litter sampled according to research and monitoring protocols as MSFD monitoring. To calculate percentages for each type, formula applied is: Type (%) = (∑number of particles of each type)*100 / (∑number of particles of all type) When the number of microlitters was not filled or zero, the percentage could not be calculated. Standard vocabularies for microliter types are taken from Seadatanet's H01 library (https://vocab.seadatanet.org/v_bodc_vocab_v2/search.asp?lib=H01) Warning: the absence of data on the map doesn't necessarily mean that they don't exist, but that no information has been entered in the National Oceanographic Data Centre (NODC) for this area.