 Catalogue PIGMA
climatologyMeteorologyAtmosphere
Type of resources
Available actions
Topics
Keywords
Contact for the resource
Provided by
Years
Formats
Representation types
Update frequencies
status
Scale
Resolution
-
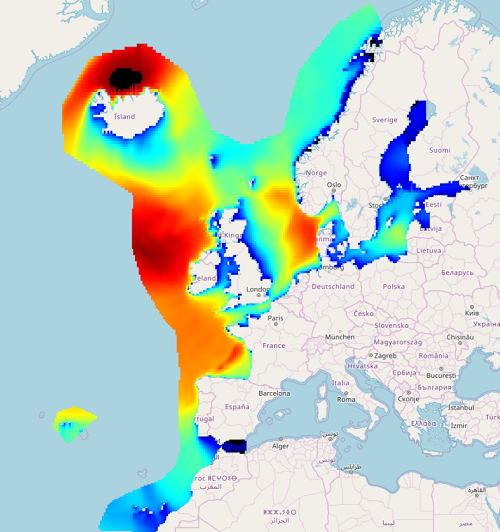
IOWAGA sea-states hindcast database generated by the wave model WAVEWATCH-III and forced by ECMWF winds on the North East Atlantic grid over 1990-2012 period.
-

Carte sur le périmètre des 53 communes du Plan de Protection de l'Atmosphère (PPA) sur l'agglomération bordelaise. Élaborée le 24/10/2011
-
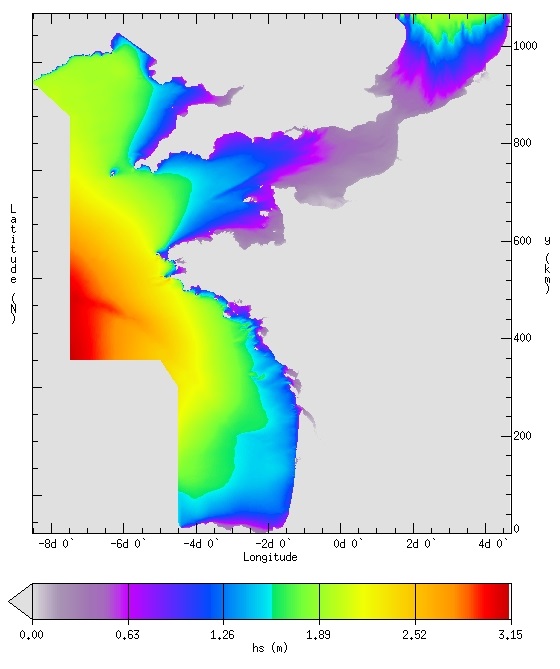
IOWAGA sea-states forecast best estimate generated by the wave model WAVEWATCH-III and forced by ECMWF winds on the French coast of the Atlantic ocean unstructured grid from 2017 to now
-

Carte sur le périmètre des 20 communes du Plan de Protection de l'Atmosphère (PPA) sur l'agglomération de Dax. Élaborée le 30/01/2012
-
IOWAGA sea-states forecast best estimate generated by the wave model WAVEWATCH-III and forced by ECMWF winds on the North East Atlantic grid from 2017 to now
-
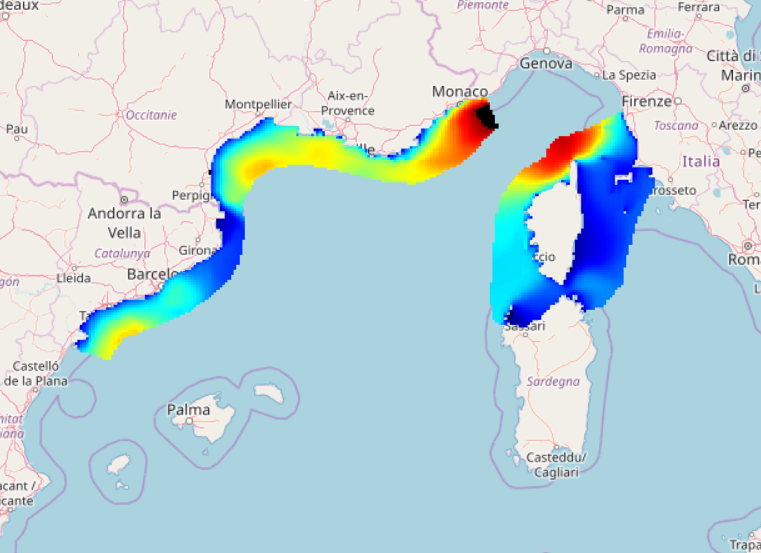
IOWAGA sea-states hindcast database generated by the wave model WAVEWATCH-III and forced by ECMWF winds on the North mediterranean grid over 2004-2017 period.
-
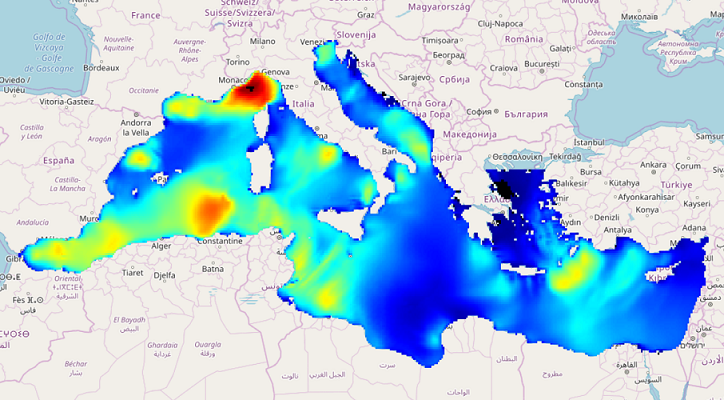
IOWAGA sea-states hindcast database generated by the wave model WAVEWATCH-III and forced by ECMWF winds on the Mediterranean grid over 2005-2017 period.
-
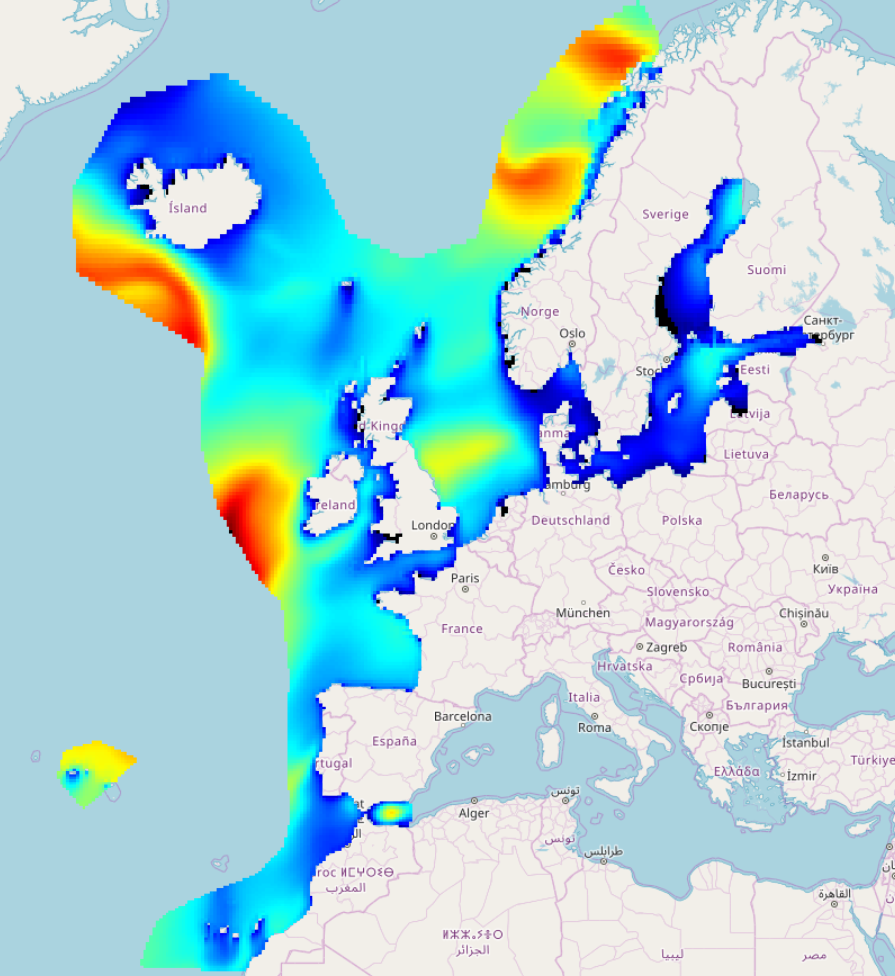
IOWAGA sea-states hindcast database generated by the wave model WAVEWATCH-III and forced by CFSR winds on the North East Atlantic grid over 1990-2012 period.
-

Carte sur le périmètre des 20 communes du Plan de Protection de l'Atmosphère (PPA) sur l'agglomération de bayonne. Élaborée le 30/01/2012
-

Carte sur le périmètre des 22 communes du Plan de Protection de l'Atmosphère (PPA) sur l'agglomération de Pau. Élaborée le 09/02/2012