 Catalogue PIGMA
2016
Type of resources
Available actions
Topics
Keywords
Contact for the resource
Provided by
Years
Formats
Representation types
Update frequencies
status
Scale
Resolution
-

The Drifting Buoys GDAC -Global Data Assembly Centre- is the repository of surface drifters data. Both NRT -Near Real Time- and DM -Delayed Mode- data are available on the GDAC. Drifters report generally trajectories, sea-surface temperatures, atmospheric pressures at sea-level, as well as sea-surface salinity or sub-surface temperature in the ocean top layer.
-
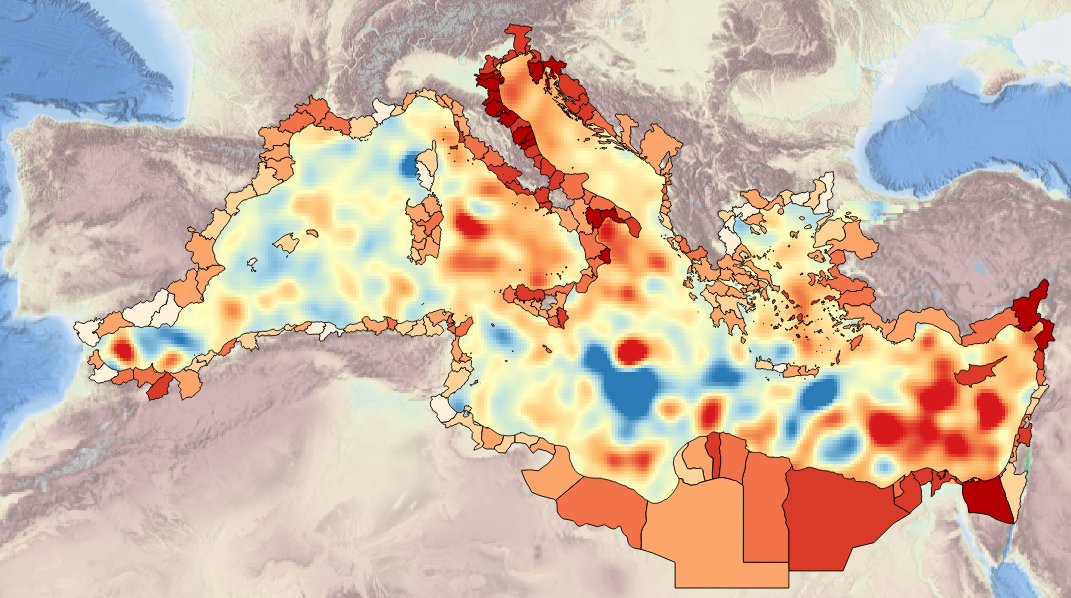
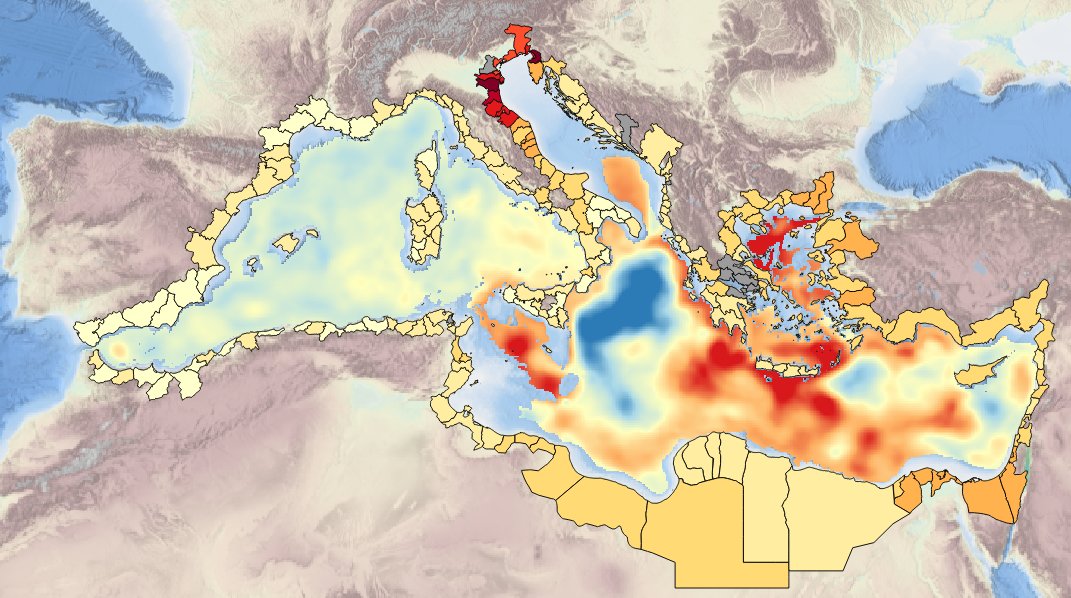
Specification of the desirable and recommended product attributes for generating time series of sea level trend for the last 10 years for the Mediterranean basin for each NUTS3 region along the coast.
-
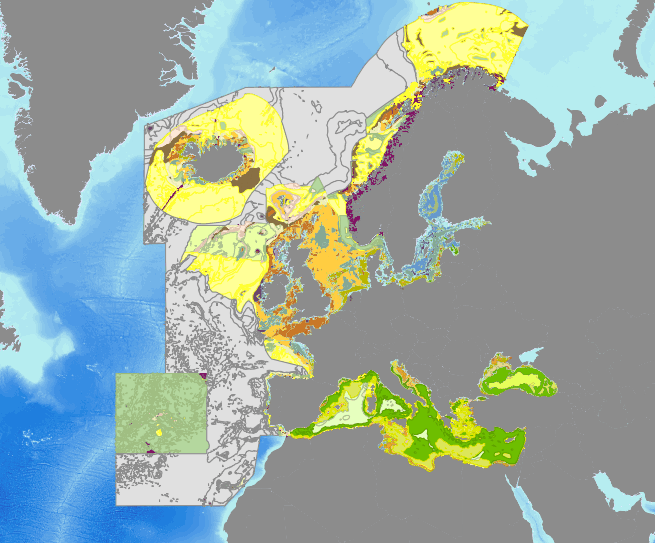
Output of the 2016 EUSeaMap broad-scale predictive model, produced by EMODnet Seabed Habitats. The extent of the mapped area includes the Mediterranean Sea, Black Sea, Baltic Sea, and areas of the North Eastern Atlantic extending from the Canary Islands in the south to Norway in the North. The map was produced using a "top-down" modelling approach using classified habitat descriptors to determine a final output habitat. Habitat descriptors differ per region but include: Biological zone Energy class Oxygen regime Salinity regime Seabed Substrate Riverine input Habitat descriptors (excepting Substrate) are calculated using underlying physical data and thresholds derived from statistical analyses or expert judgement on known conditions. The model is produced in Arc Model Builder (10.1). For more information on the modelling process please read the EMODnet Seabed Habitats The model was created using raster input layers with a cell size of 0.002dd (roughly 250 meters). The model includes the sublittoral zone only; due to the high variability of the littoral zone, a lack of detailed substrate data and the resolution of the model, it is difficult to predict littoral habitats at this scale. The map follows the EUNIS 2007-11 classification system where it is appropriate.
-
Specifications of the desirable and recommended product attributes for generating spatial layers of sea level trend for the last 10 years for the Mediterranean basin and for each NUTS3 region along the coast.
-

The objective of this tender is to examine the current data collection, observation and data assembly programmes in the Meditterranean Sea, identify gaps and to evaluate how they can be optimised.
-
Data from FerryBoxes on ships of opportunity going on permanent routes are stored inside this database (ferrydata.hzg.de). Parameters are temperature, salinity, chlorophyll-a fluorescence, oxygen and different others. The data model is transect oriented. A data portal to access and visualise the data is also provided.
-

GOSUD aims at assembling in-situ observations of the world ocean surface collected by a variety of ships and at distributing quality controlled datasets. At present time the variables considered by GOSUD are temperature and salinity. The GOSUD data are mostly collected using thermosalinographs (TSG) installed on research vessels, on commercial ships and in some cases on sailing exploration ships. GOSUD manages both near-real time (RT and NRT) data and delayed mode (DM-reprocessed) data. The GOSUD GDAC is hosted by the Coriolis data centre (France) and a back-up (permanent archived) is performed on a daily basis by NCEIS (NOAA's National Centers for Environmental Information).
-
Description ot the spatial layers attributes of sea level trend for the last 10 years for the Mediterranean basin and for each NUTS3 region along the coast.
-
Description of attributes for time series on annual averafe mid-water and sea-bottom temperature for the last 10 years for the Mediterranean basin and for each NUTS3 along coast
-
Specification of the desirable and recommended products attributes for generating spatial layers of sea mid-water and sea-bottom temperature for the last 10, 50 and 100 years for the Mediterranean basin and for each NUTS3 region along the coast.