 Catalogue PIGMA
GeoTIFF
Type of resources
Available actions
Topics
Keywords
Contact for the resource
Provided by
Years
Formats
Representation types
Update frequencies
status
Scale
Resolution
-
Coastal zones are presented as a series of 10 consecutive buffers of 1km width each (towards inland). For this dataset, were treated as sea data all areas with a class value of 523 (sea and ocean) in Corine Land Cover (details in lineage).
-
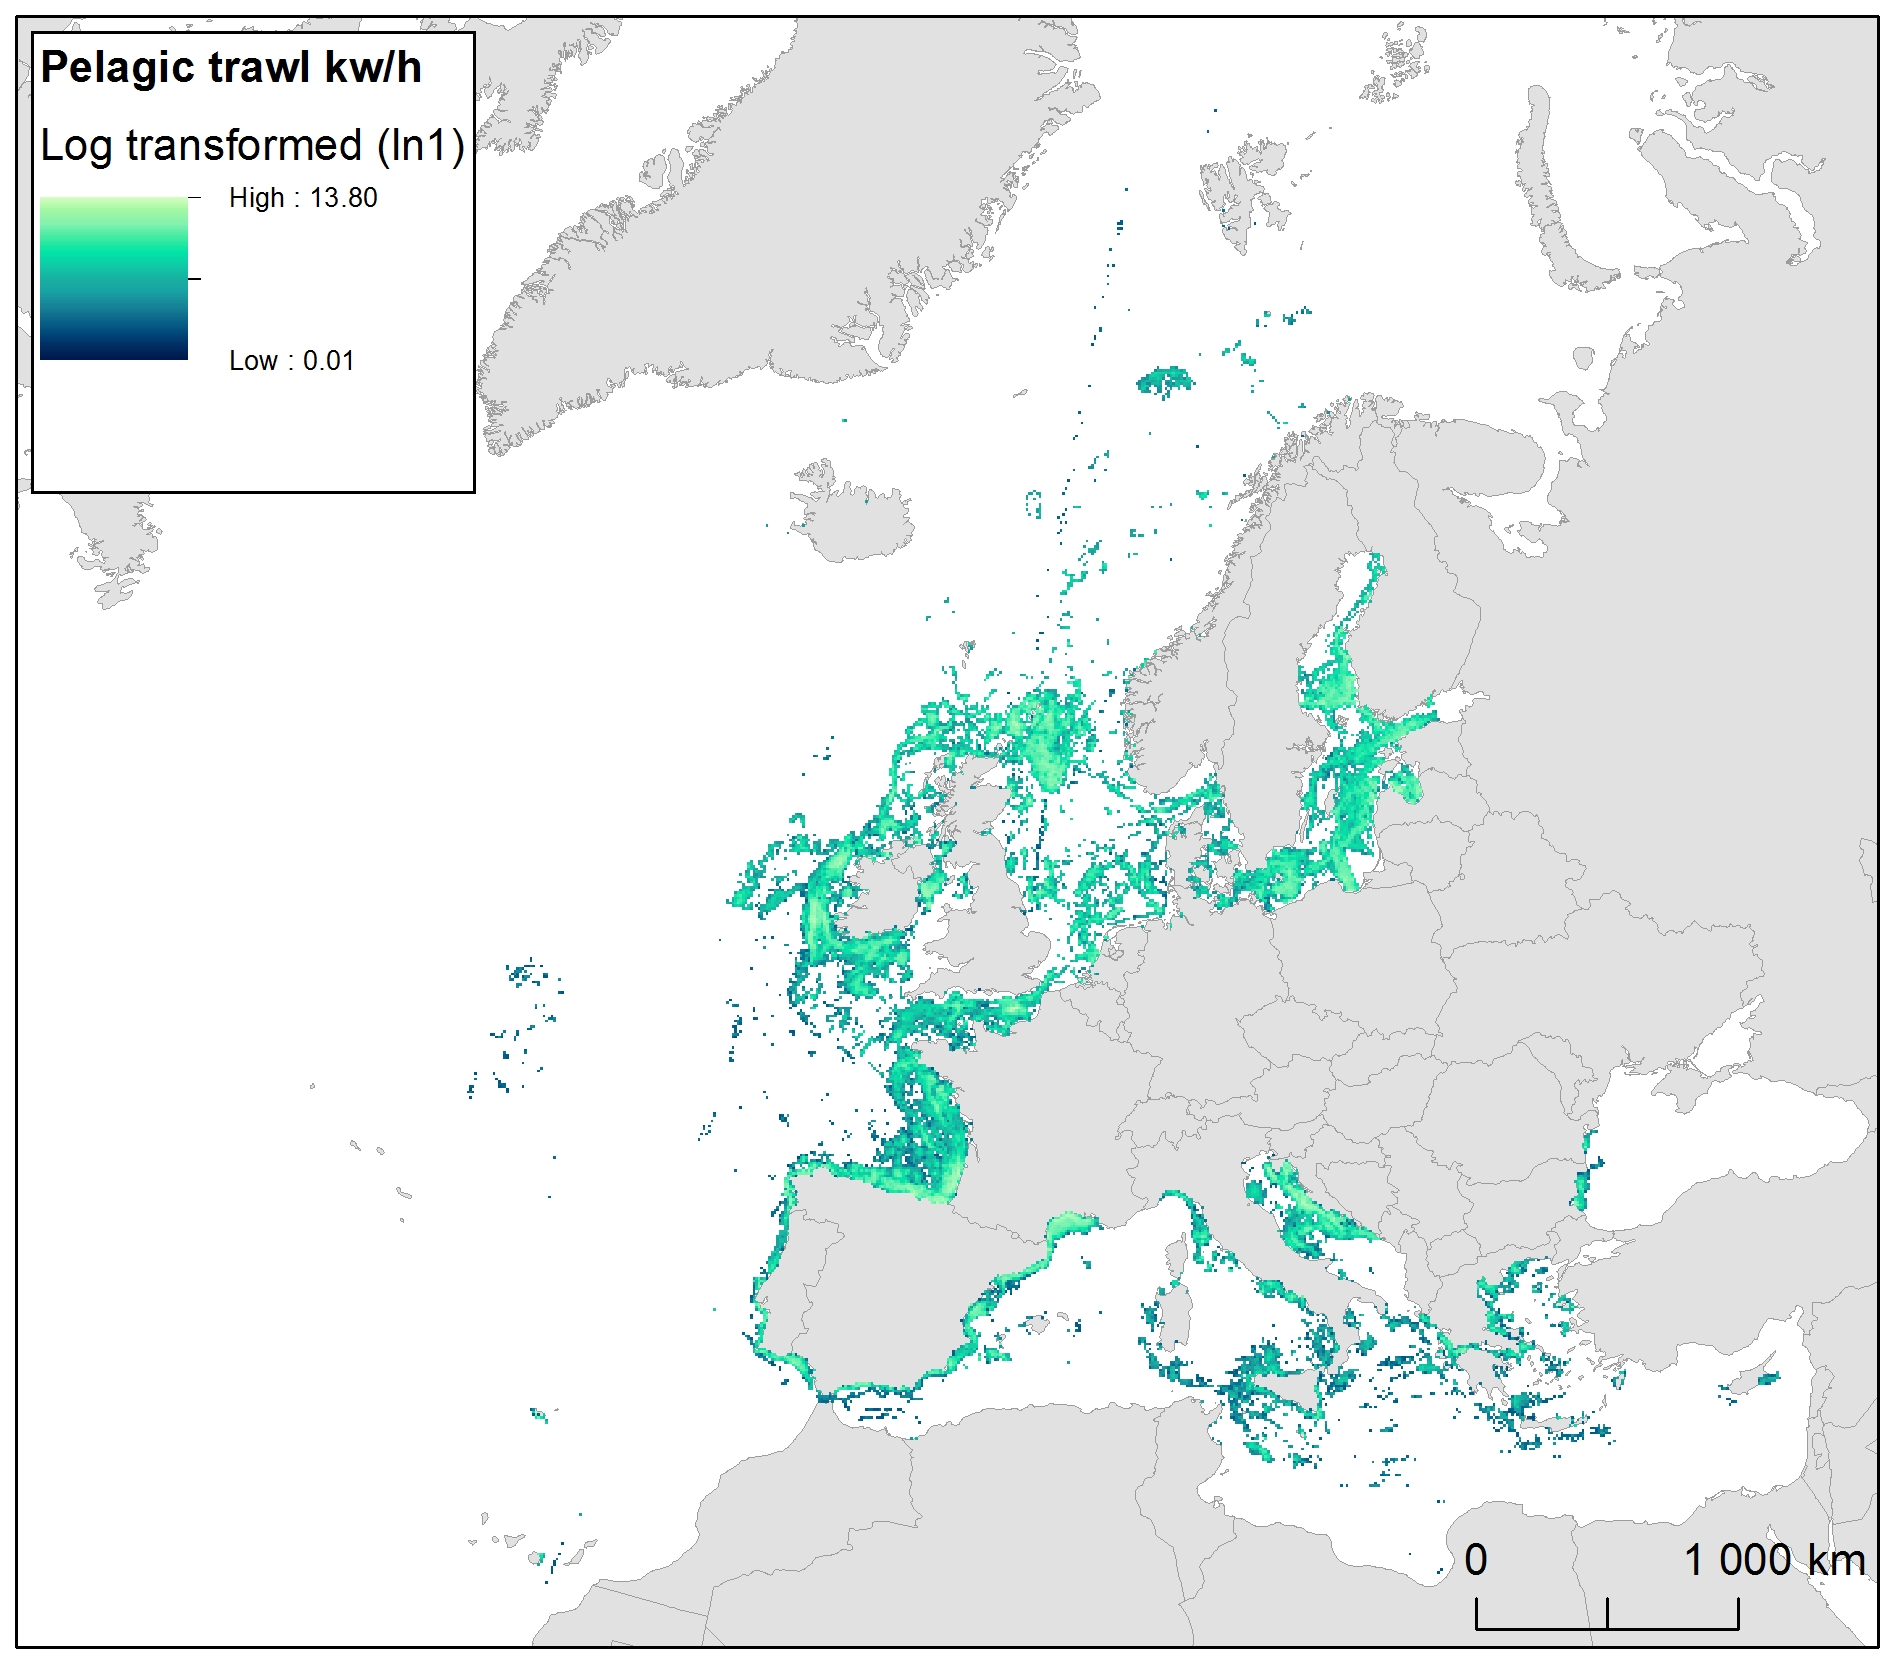
The raster dataset represents fishing intensity (kilowatt per fishing hour) by pelagic towed gears in the European seas. The dataset has been derived from Automatic Identification System (AIS) based pelagic fishing intensity data received from the European Commission’s Joint Research Centre - Independent experts of the Scientific, Technical and Economic Committee for Fisheries (JRC STECF), as well as from Vessel Monitoring System (VMS) and logbook based pelagic fishing effort data from HELCOM Commission. The temporal extent varies between the data sources (between 2013 and 2015). The dataset has been transformed to a logarithmic scale (ln1). This dataset has been prepared for the calculation of the combined effect index, produced for the ETC/ICM Report 4/2019 "Multiple pressures and their combined effects in Europe's seas" available on: https://www.eionet.europa.eu/etcs/etc-icm/etc-icm-report-4-2019-multiple-pressures-and-their-combined-effects-in-europes-seas-1.
-
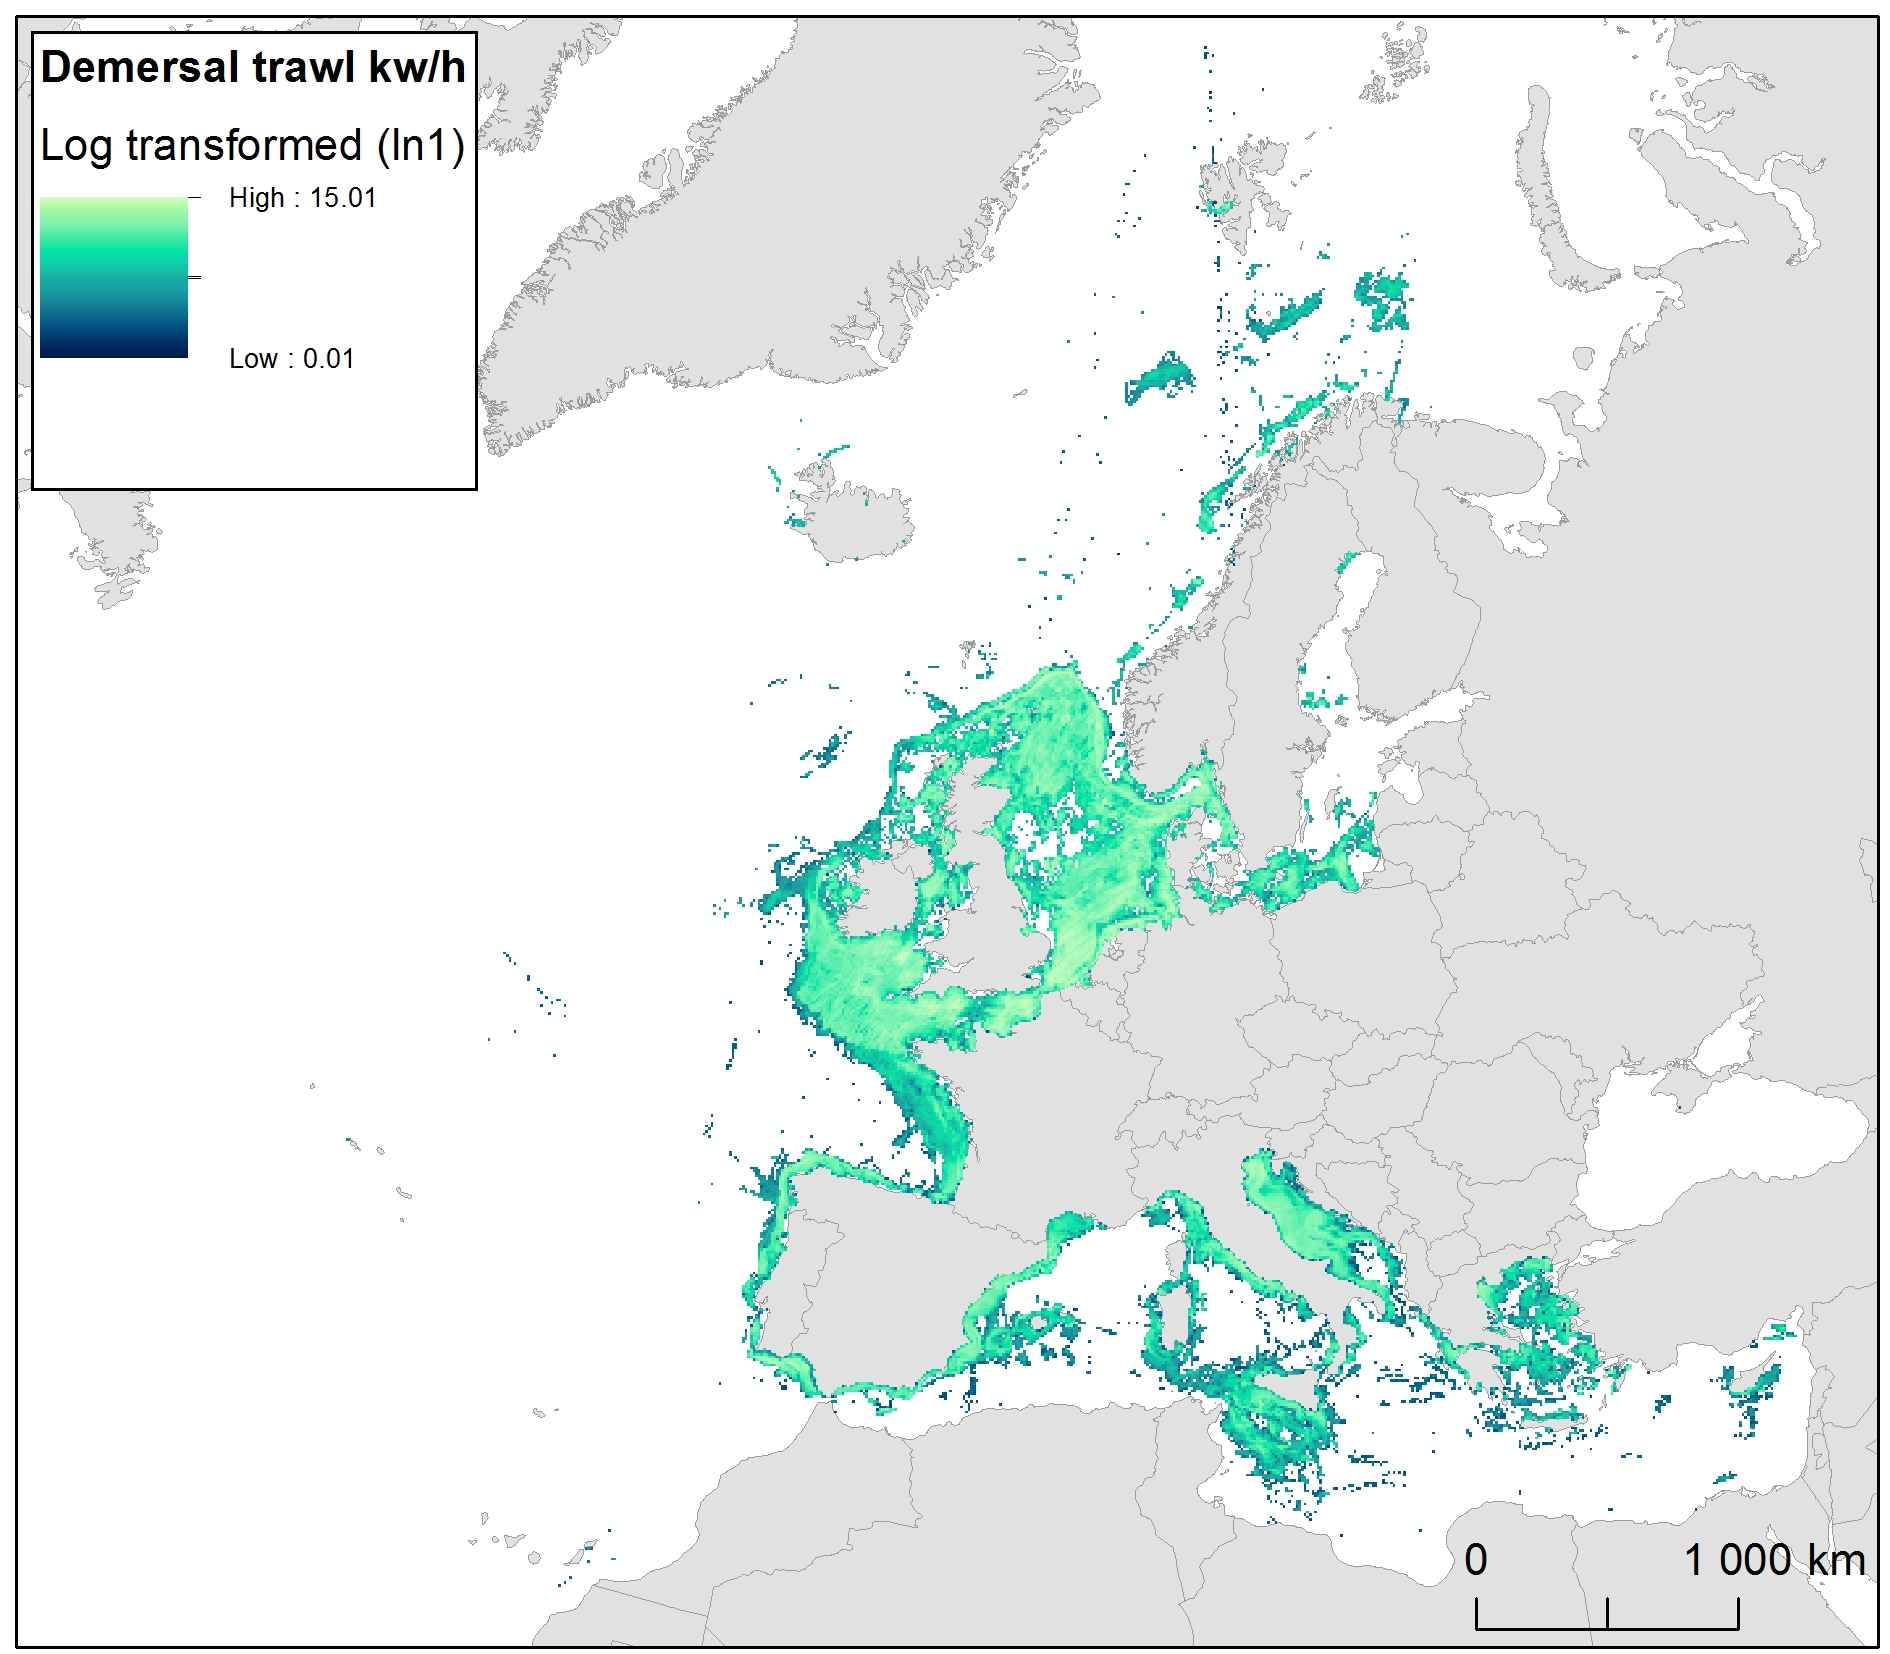
The raster dataset represents bycatch fishing intensity (kilowatt per fishing hour) from bottom touching mobile gears in the European seas. The dataset has been derived from Automatic Identification System (AIS) based demersal fishing intensity data received from the European Commission’s Joint Research Centre - Independent experts of the Scientific, Technical and Economic Committee for Fisheries (JRC STECF) as well as Vessel Monitoring System (VMS) and logbook based demersal fishing intensity data downloaded from from OSPAR and HELCOM Commissions. The temporal extent varies between the data sources (between 2014 and 2017). OSPAR and HELCOM data superseded the JRC STECF data where they overlapped spatially. The cell values have been transformed into a logarithmic scale (ln1). This dataset has been prepared for the calculation of the combined effect index, produced for the ETC/ICM Report 4/2019 "Multiple pressures and their combined effects in Europe's seas" available on: https://www.eionet.europa.eu/etcs/etc-icm/etc-icm-report-4-2019-multiple-pressures-and-their-combined-effects-in-europes-seas-1.
-
The GEBCO_2022 Grid is a global continuous terrain model for ocean and land with a spatial resolution of 15 arc seconds. In regions outside of the Arctic Ocean area, the grid uses as a base Version 2.4 of the SRTM15_plus data set (Tozer, B. et al, 2019). This data set is a fusion of land topography with measured and estimated seafloor topography. Included on top of this base grid are gridded bathymetric data sets developed by the four Regional Centers of The Nippon Foundation-GEBCO Seabed 2030 Project. The GEBCO_2022 Grid represents all data within the 2022 compilation. The compilation of the GEBCO_2022 Grid was carried out at the Seabed 2030 Global Center, hosted at the National Oceanography Centre, UK, with the aim of producing a seamless global terrain model. Outside of Polar regions, the Regional Centers provide their data sets as sparse grids i.e. only grid cells that contain data are populated. These data sets were included on to the base using a remove-restore blending procedure. This is a two-stage process of computing the difference between the new data and the base grid and then gridding the difference and adding the difference back to the existing base grid. The aim is to achieve a smooth transition between the new and base data sets with the minimum of perturbation of the existing base data set. The data sets supplied in the form of complete grids (primarily areas north of 60N and south of 50S) were included using feather blending techniques from GlobalMapper software. The GEBCO_2022 Grid has been developed through the Nippon Foundation-GEBCO Seabed 2030 Project. This is a collaborative project between the Nippon Foundation of Japan and the General Bathymetric Chart of the Oceans (GEBCO). It aims to bring together all available bathymetric data to produce the definitive map of the world ocean floor by 2030 and make it available to all. Funded by the Nippon Foundation, the four Seabed 2030 Regional Centers include the Southern Ocean - hosted at the Alfred Wegener Institute, Germany; South and West Pacific Ocean - hosted at the National Institute of Water and Atmospheric Research, New Zealand; Atlantic and Indian Oceans - hosted at the Lamont-Doherty Earth Observatory, Columbia University, USA; Arctic and North Pacific Oceans - hosted at Stockholm University, Sweden and the Center for Coastal and Ocean Mapping at the University of New Hampshire, USA.
-
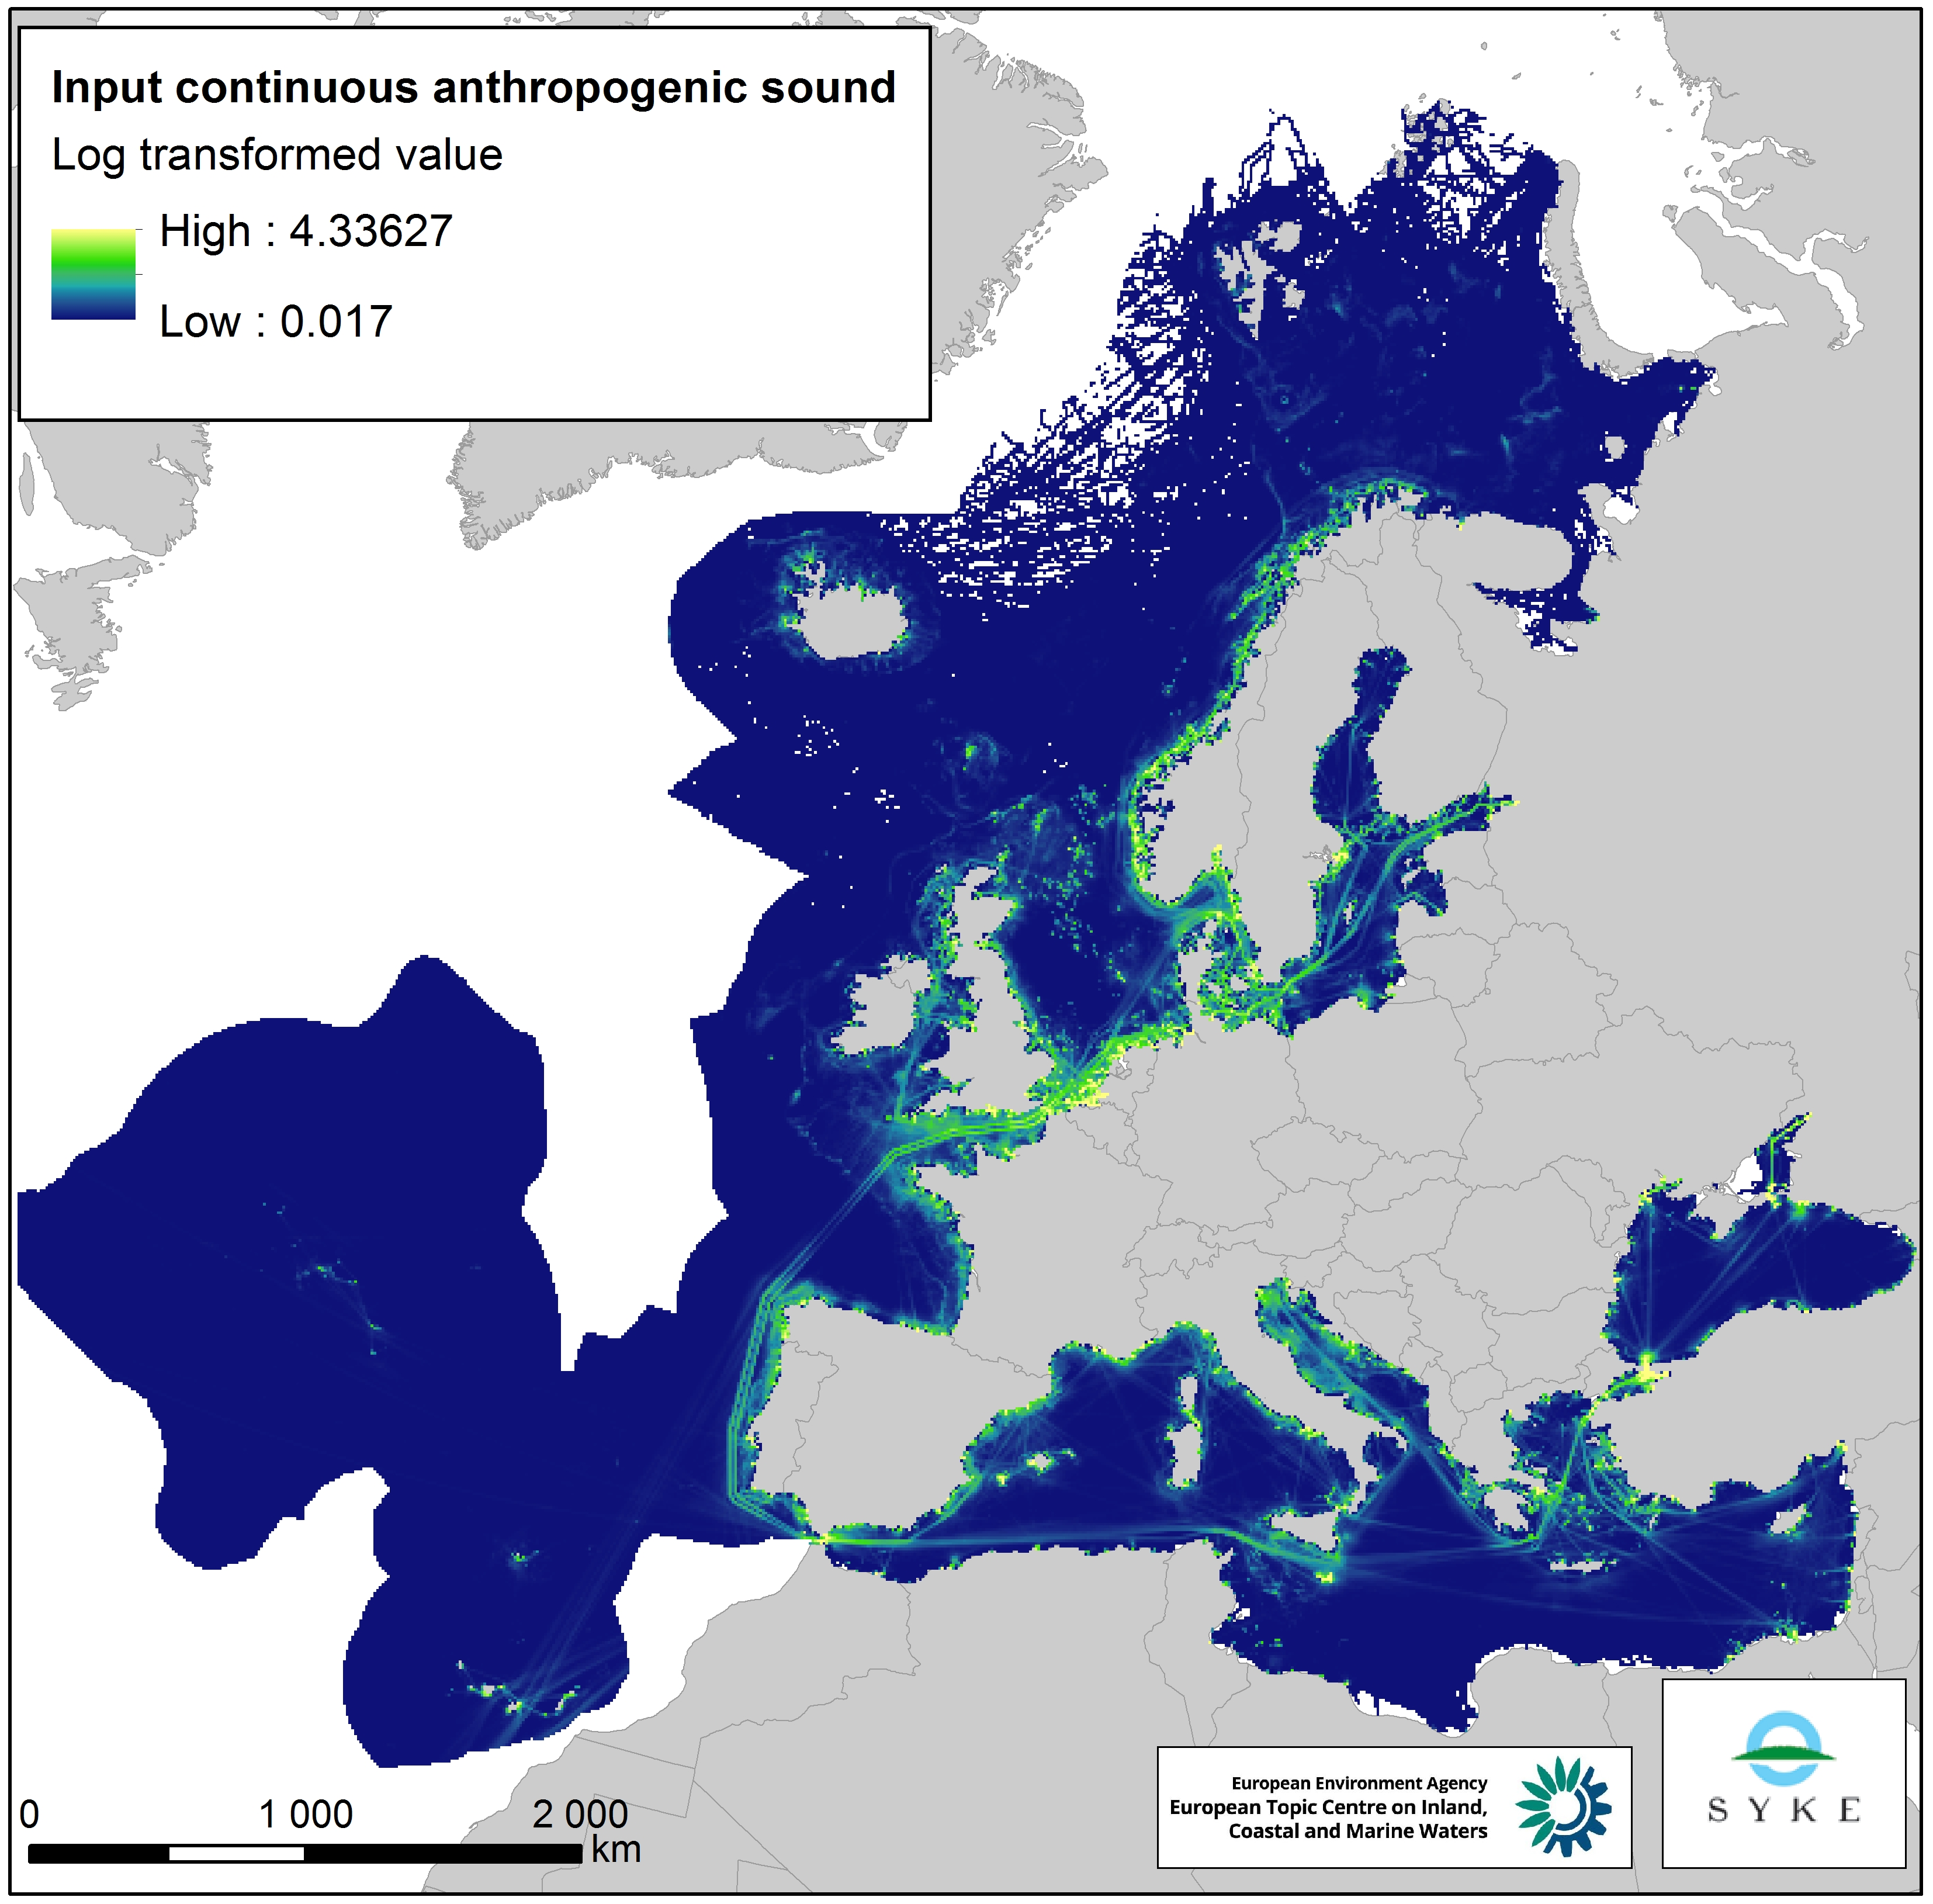
This raster dataset represents the input of continuous anthropogenic sound in the European Seas. Continuous anthropogenic underwater noise is found in the entire European marine area and is mainly produced by maritime traffic. As no thresholds for pressure have been agreed yet, even areas of low or infrequent maritime traffic are included as pressures. This dataset uses shipping density as a representation of distribution of continuous underwater noise. This dataset is based on a truncated version of the EMODnet (Automatic Identification System) AIS based vessel density dataset for 2017 (all ships, year average). The vessel density was rescaled from a 1 km to 10 km resolution (mean values) using the EEA 10 km grid. The dataset has been transformed to a logarithmic scale (ln1). This dataset has been prepared for the calculation of the combined effect index, produced for the ETC/ICM Report 4/2019 "Multiple pressures and their combined effects in Europe's seas" available on: https://www.eionet.europa.eu/etcs/etc-icm/etc-icm-report-4-2019-multiple-pressures-and-their-combined-effects-in-europes-seas-1.
-
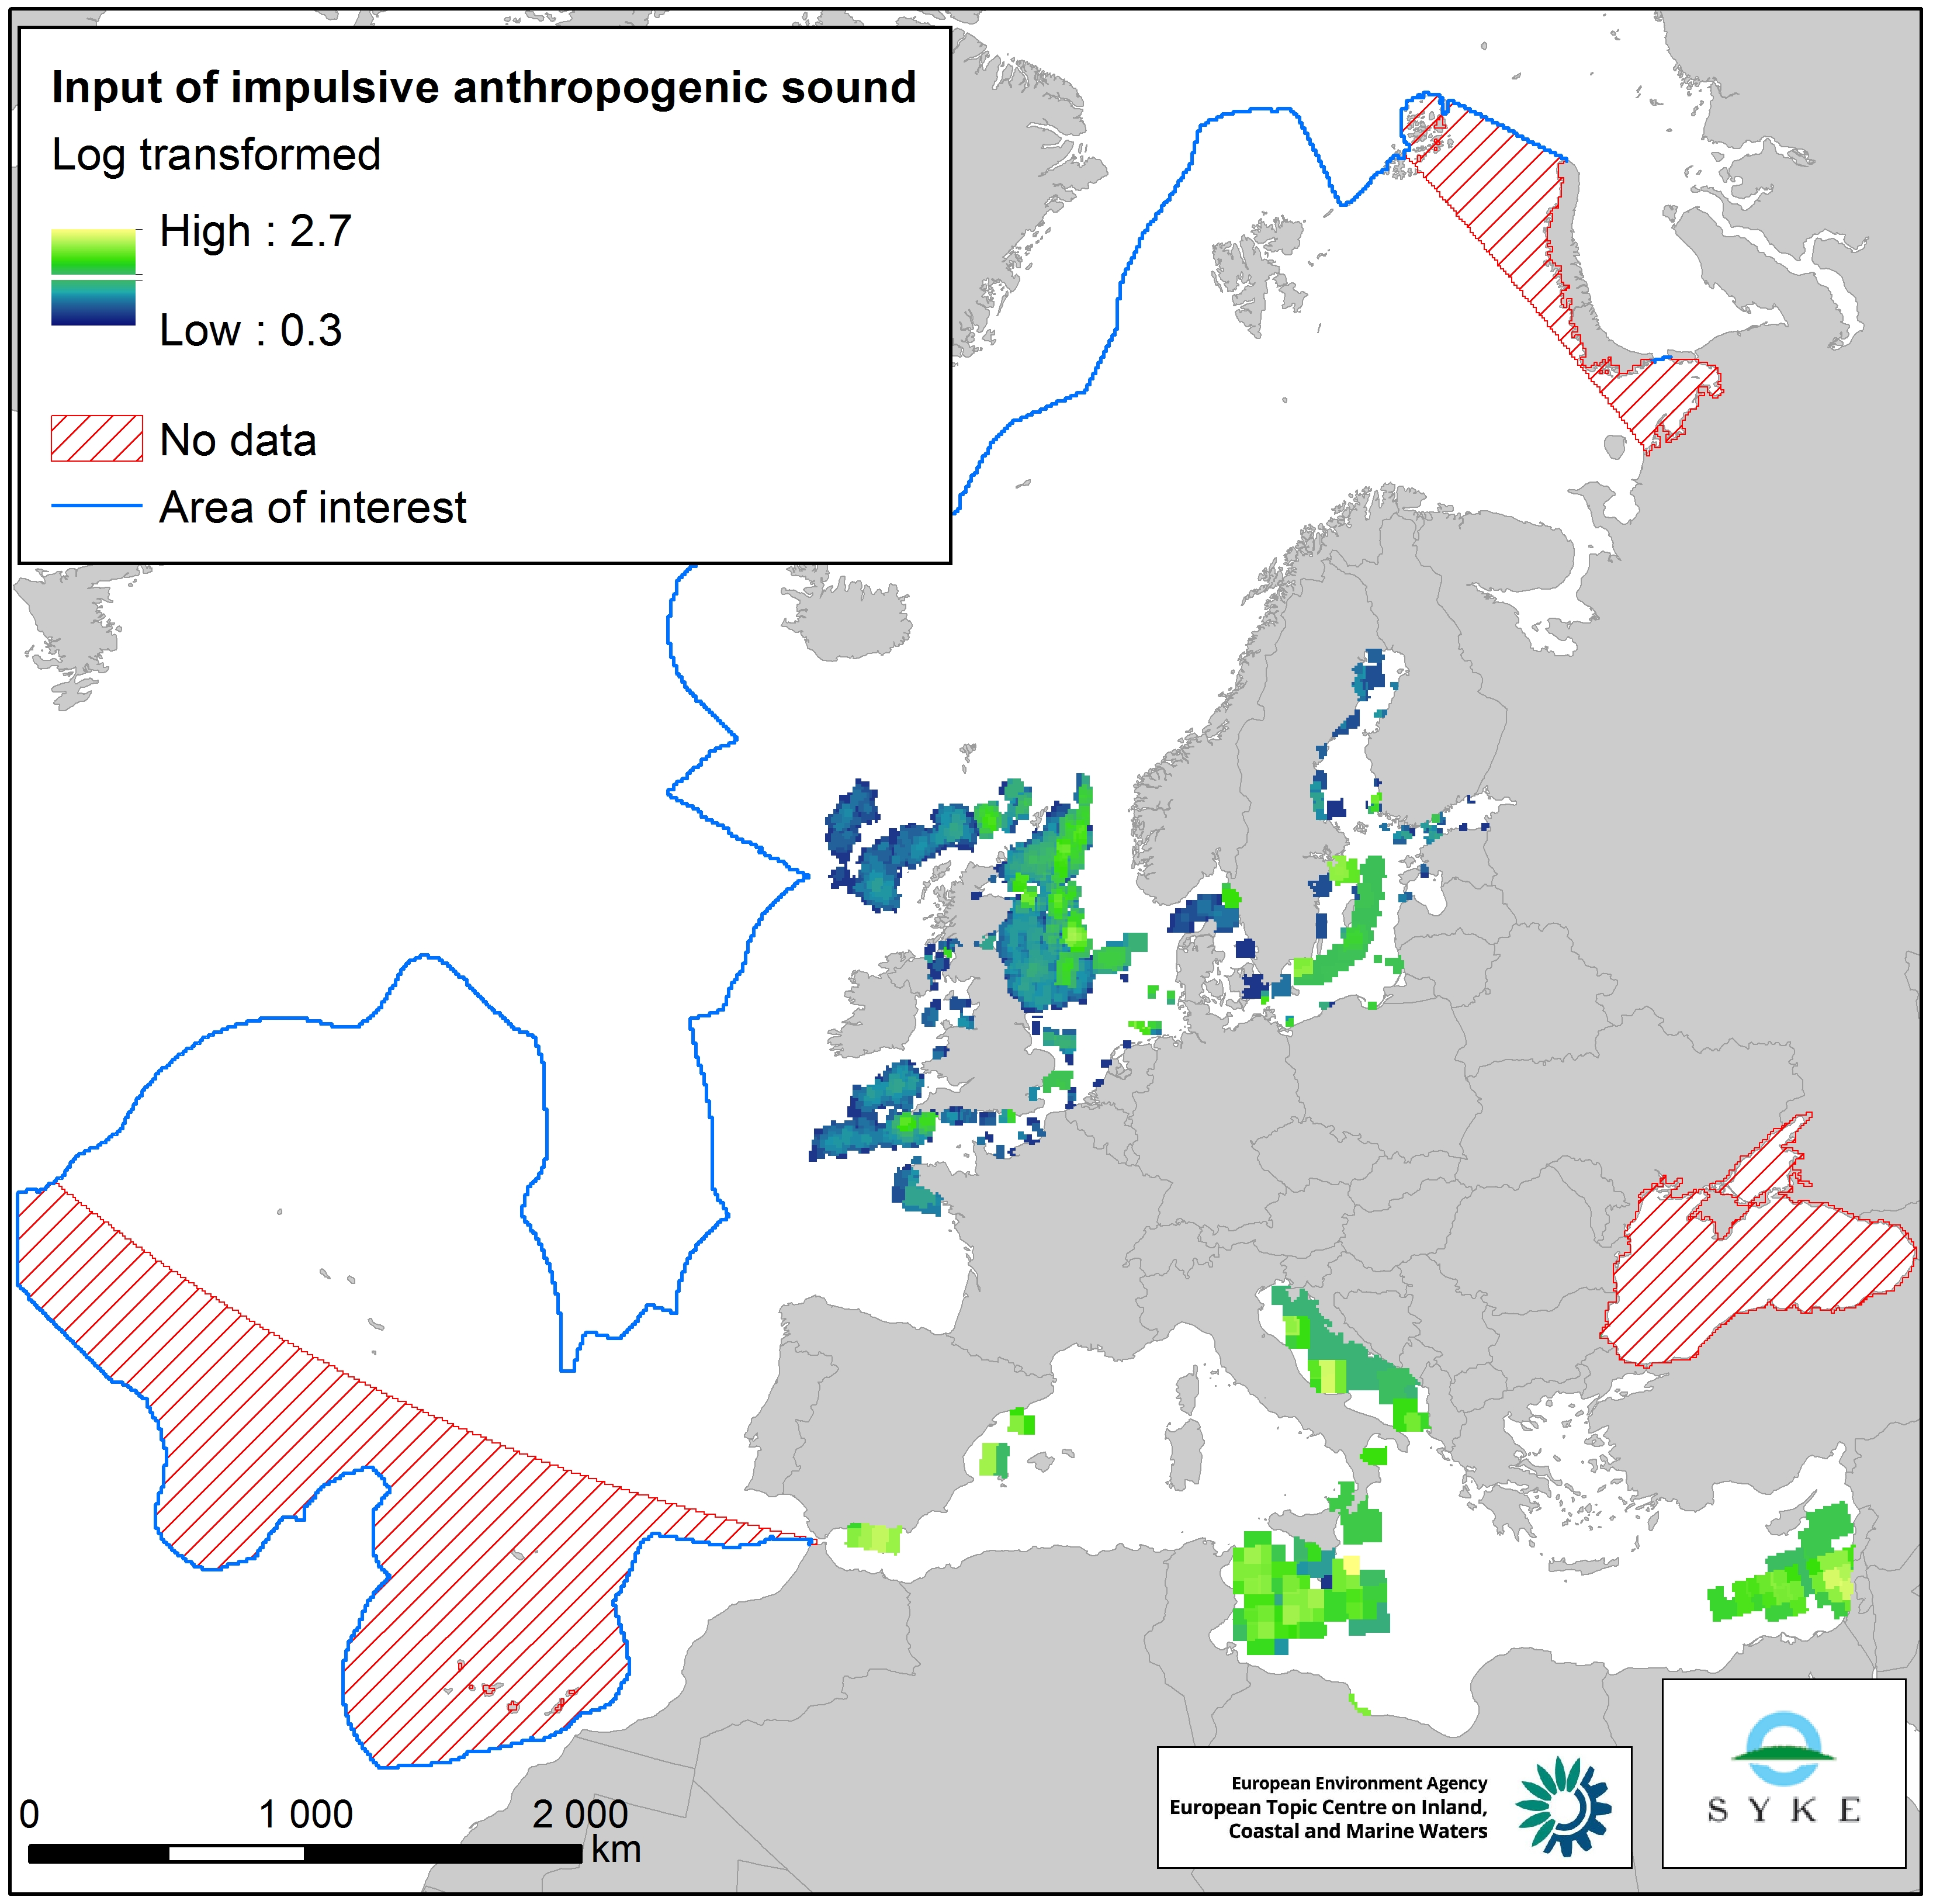
This raster dataset represents input of impulsive anthropogenic sound in Europe Seas. Impulsive sounds are typically brief with a rapid rise time, i.e. a great change in amplitude over a short period of time. The main anthropogenic sources of impulsive underwater noise are typically impact pile driving for inshore and offshore construction, seismic exploration with airguns, explosions and sonar systems. The dataset was created by combining pulse-block-days (PBD) data from the ICES Registry (for HELCOM and OSPAR areas) and ACCOMBAS (for the Mediterranean Sea), resampled using the EEA 10 km grid. The dataset does not include the Black Sea. The temporal reference of this dataset is the period 2014-2016. The cell values have been transformed into a logarithmic scale (log10). This dataset has been prepared for the calculation of the combined effect index, produced for the ETC/ICM Report 4/2019 "Multiple pressures and their combined effects in Europe's seas" available on: https://www.eionet.europa.eu/etcs/etc-icm/etc-icm-report-4-2019-multiple-pressures-and-their-combined-effects-in-europes-seas-1.
-
Coastal zones are presented as a series of 10 consecutive buffers of 1km width each (towards inland). For this dataset, were treated as sea data all areas with class values of 52x (521: coastal lagoons, 522: estuaries, 523: sea and ocean) in Corine Land Cover (details in lineage).
-

Species distribution models (GAM, Maxent and Random Forest ensemble) predicting the distribution of Solitary Scleractinian fields assemblage in the Celtic Sea. This community is considered ecologically coherent according to the cluster analysis conducted by Parry et al. (2015) on image sample. Modelling its distribution complements existing work on their definition and offers a representation of the extent of the areas of the north-east Atlantic where they can occur based on the best available knowledge. This work was performed at the University of Plymouth in 2021.
-
Maps of seasonal p90 (percentile 90) of Chla on the North Atlantic basin for the past ten years (2005-2014) using the Global Copernicus chla level 4 (L4) products (resolution of 4 km). Method as Gohin Francis, Saulquin Bertrand, Bryere Philippe (2010) Atlas de la Température, de la concentration en Chlorophylle et de la Turbidité de surface du plateau continental français et de ses abords de l’Ouest européen. Ifremer. http://archimer.ifremer.fr/doc/00057/16840/
-
Coastal zones are presented as a series of 10 consecutive buffers of 1km width each (towards inland). For this dataset, were treated as sea data all areas with class values of 52x (521: coastal lagoons, 522: estuaries, 523: sea and ocean) in Corine Land Cover (details in lineage).