 Catalogue PIGMA
/Activités et Usages/Urbanisation et Artificialisation
Type of resources
Available actions
Topics
Keywords
Contact for the resource
Provided by
Years
Formats
Representation types
Update frequencies
status
Scale
Resolution
-
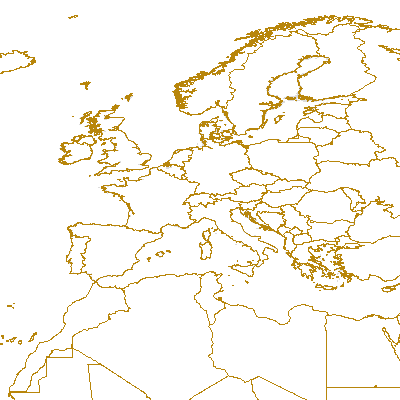
Complete Coastline Features for all the countries that produced Corine Land Cover 2000 and have a coastline, with detailed descriptions on the environment and type of coastal areas. Each coast segment has inherited CLC 2000 class, and also the attributes from Eurosion Coastline version 2.1 2004, regarding geomorphology, type of coast and erosion trends.
-
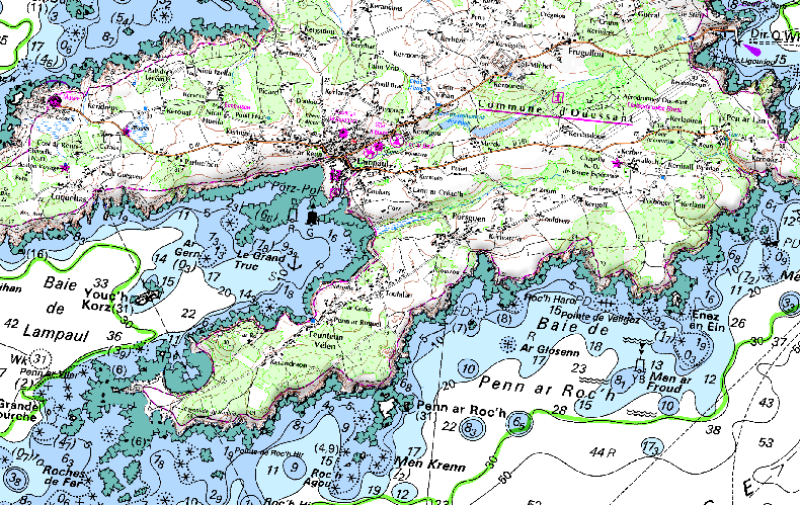
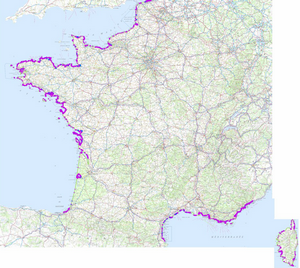
Le produit SCAN Littoral est une collection d'images cartographiques numériques continues du littoral en couleur, obtenue par assemblage géoréférencé et dallé des données raster des cartes marines du SHOM et terrestres de l'IGN. Le produit SCAN Littoral se compose d'images numériques sans habillage ni légende ni indications de géoréférencement.
-
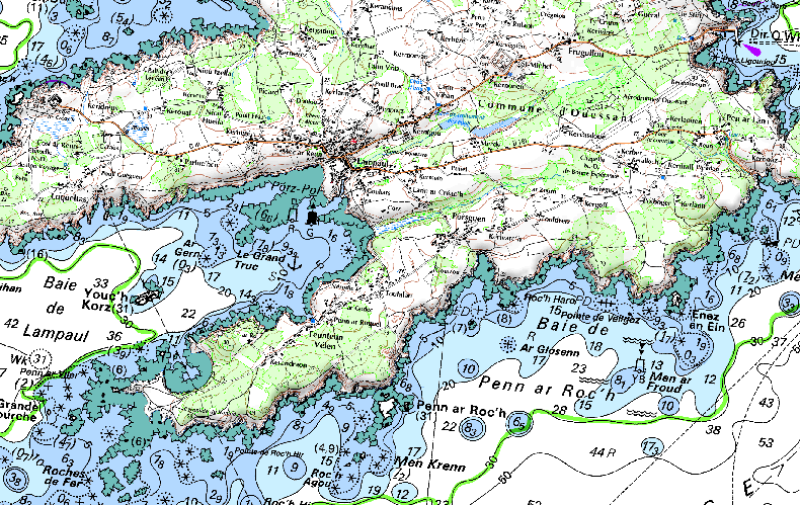
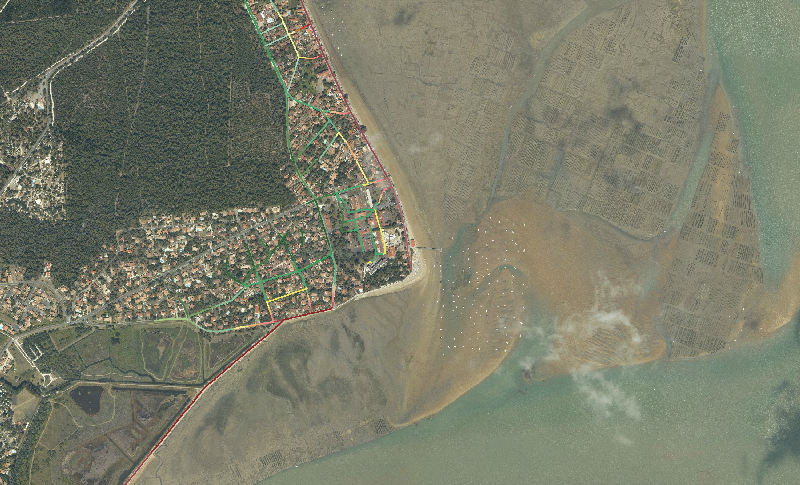
route_distAlti_300m renseigne sur l'altitude et la distance au trait de côte des routes dans une bande de 300m de large sur les 4 communes d'étude du programme de recherche RISKS : Saint-Pierre-d'Oléron, Le Château-d'Oléron, Saint-Georges-d'Oléron et Saint-Trojan-les-Bains.
-
This data set corresponds to the global offshore wind farm boundaries with the following attributes for each project: + WindfarmId (ID of the windfarm) + Name (Name of the windfarm) + Country (Country code) + Status (Status code) + WindfarmStatus (Windfarm Status or Project Status) + StatusComments (Comments on the Windfarm Status or Project Status) + CapacityMWMin (Capacity of the windfarm - Min) + CapacityMWMax (Capacity of the windfarm - Max) + NoTurbinesMin (Number of turbines - Min) + NoTurbinesMax (Number of turbines - Max) + Comments (Comments) + TurbineMWMin (Capacity of the turbine (set-up in the windfarm) - Min) + TurbineMWMax (Capacity of the turbine (set-up in the windfarm) - Max) + OtherNames (Other name of the windfarm) + CountryName (Country where the windfarm is set) + Lat (Geographic coordinate - centre latitude) + Lon (Geographic coordinate - centre longitude) + IsEstimatedLocation (This is where we know that a project exists but we don't know its exact location.) + IsOnHold + Developers (Developer(s) of the windfarm) + Owners (Owner of the windfarm) + Operators (Operator of the windfarm) + OffshoreConstructionStarts The frequency of the database release is monthly. This data set corresponds to the release of January 2020. This data set is strictly for internal EEA use as is subjected to a commercial license. Given the limited user subscriptions available, interested users should contact the SDI Team (sdi@eea.europa.eu) to be granted access to the data set.
-
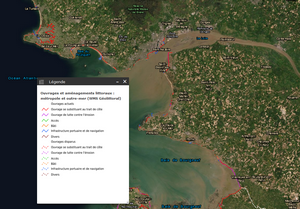
Cette couche cartographie les ouvrages et les aménagements littoraux situés au niveau du trait de côte, principalement à partir de l'observation de photographies aériennes traitées. L'étude a été réalisée dans le cadre de la stratégie nationale de gestion intégrée du trait de côte (SNGITC). Les données concernent la métropole et les cinq (5) départements d'outre-mer (Guadeloupe, Martinique, Guyane, Mayotte et Réunion).
-
Le trait de côte est considéré comme artificialisé lorsqu'il supporte des ouvrages et des aménagements littoraux ou que son évolution est potentiellement influencée par ces constructions. La cartographie de l'artificialisation du trait de côte a été réalisée principalement à partir de la "cartographie nationale des ouvrages et aménagements littoraux" produite dans le cadre de la Stratégie nationale de gestion intégrée du trait de côte. Cette cartographie couvre l'ensemble du littoral de la métropole et des départements et régions d'outre-mer (Guadeloupe, Martinique, Guyane, La Réunion, Mayotte).
-
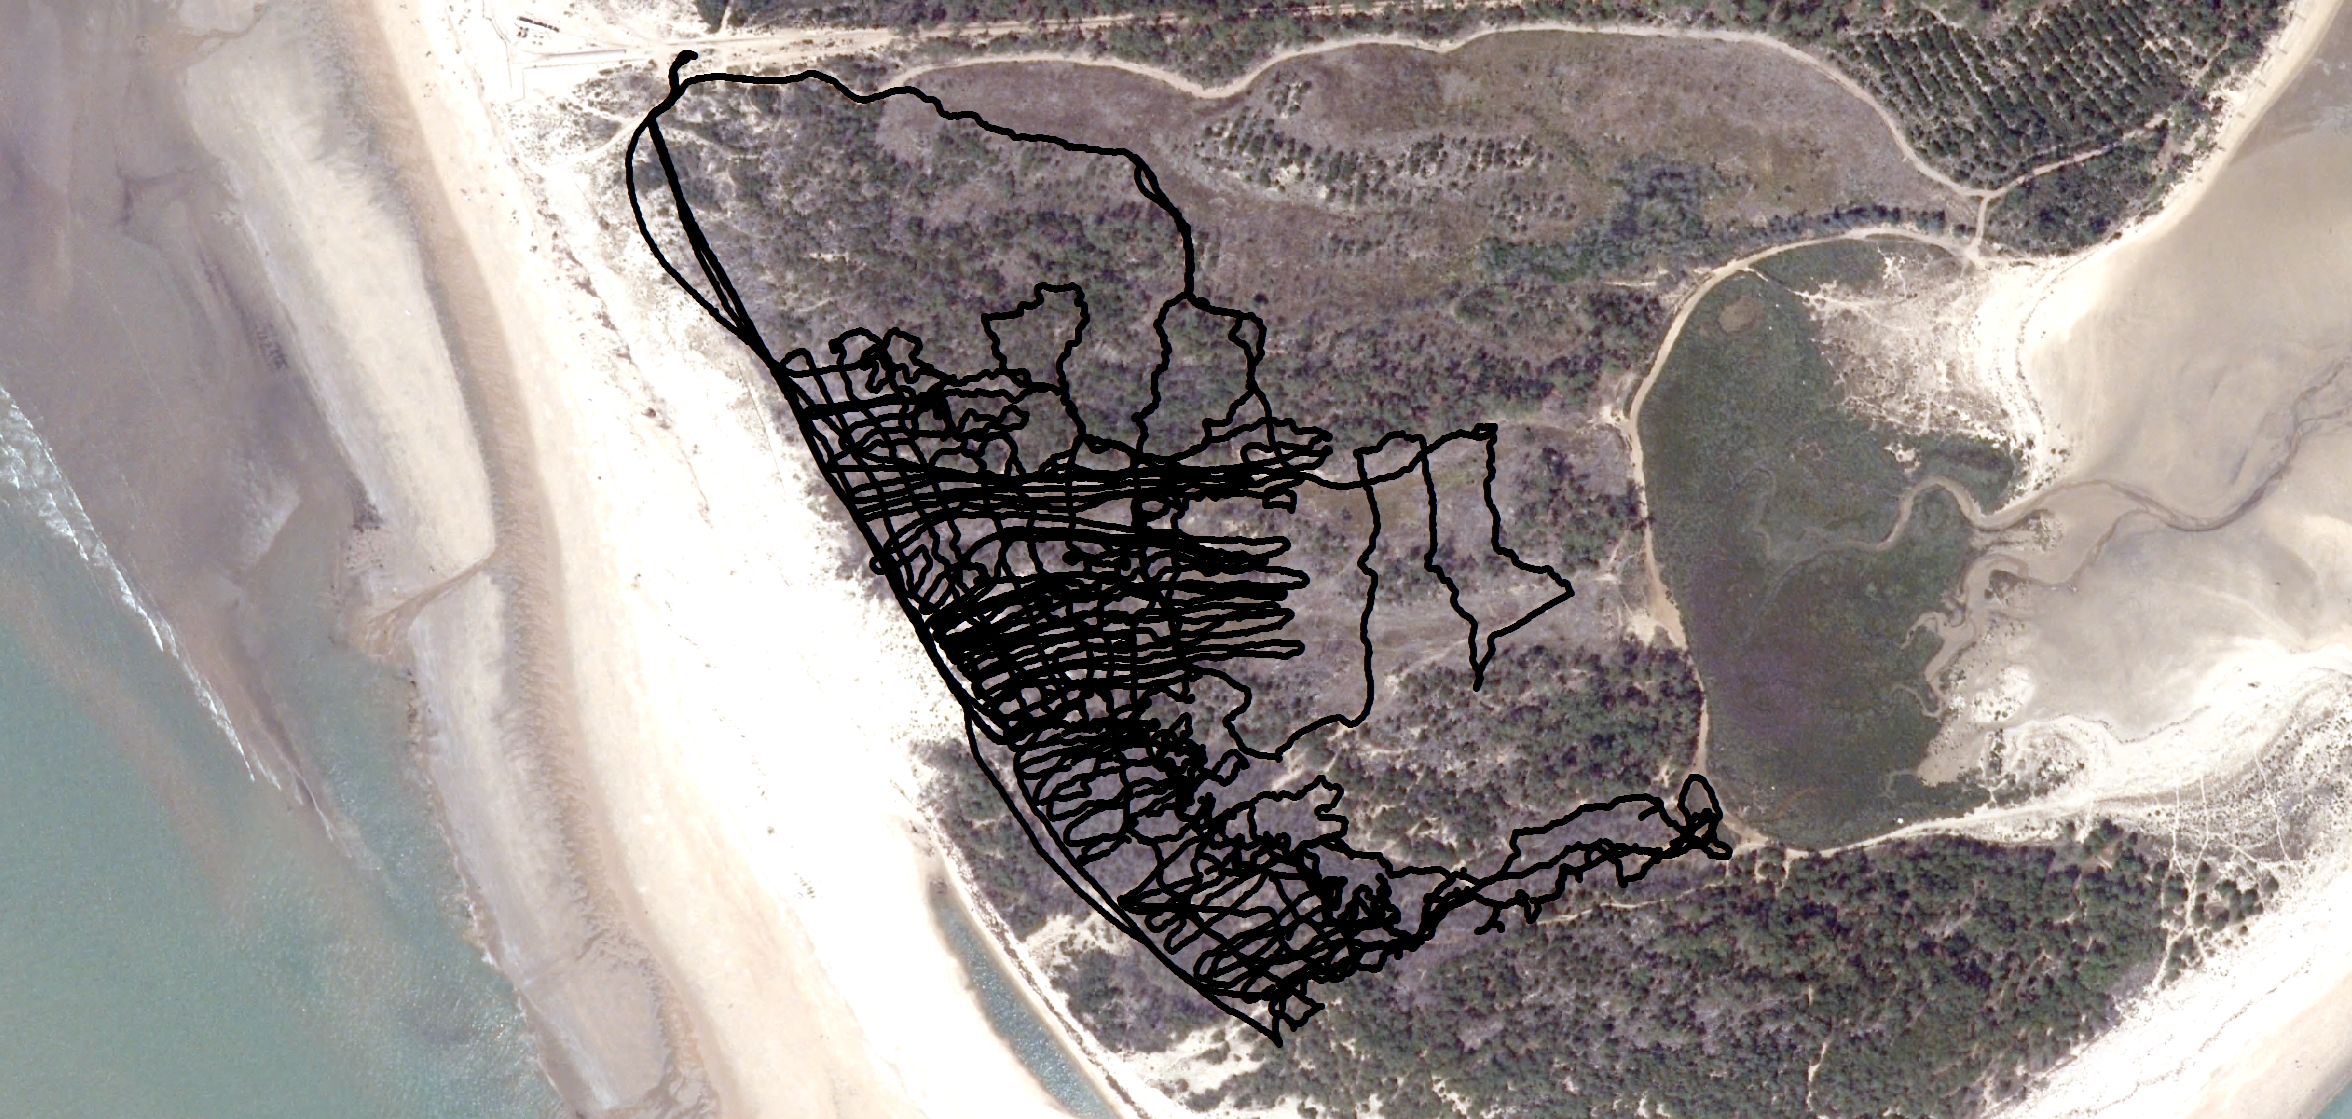
Levé GPS réalisé le 05/05/2014 sur la pointe de Gatseau afin d'étudier les dépôts de washover.
-
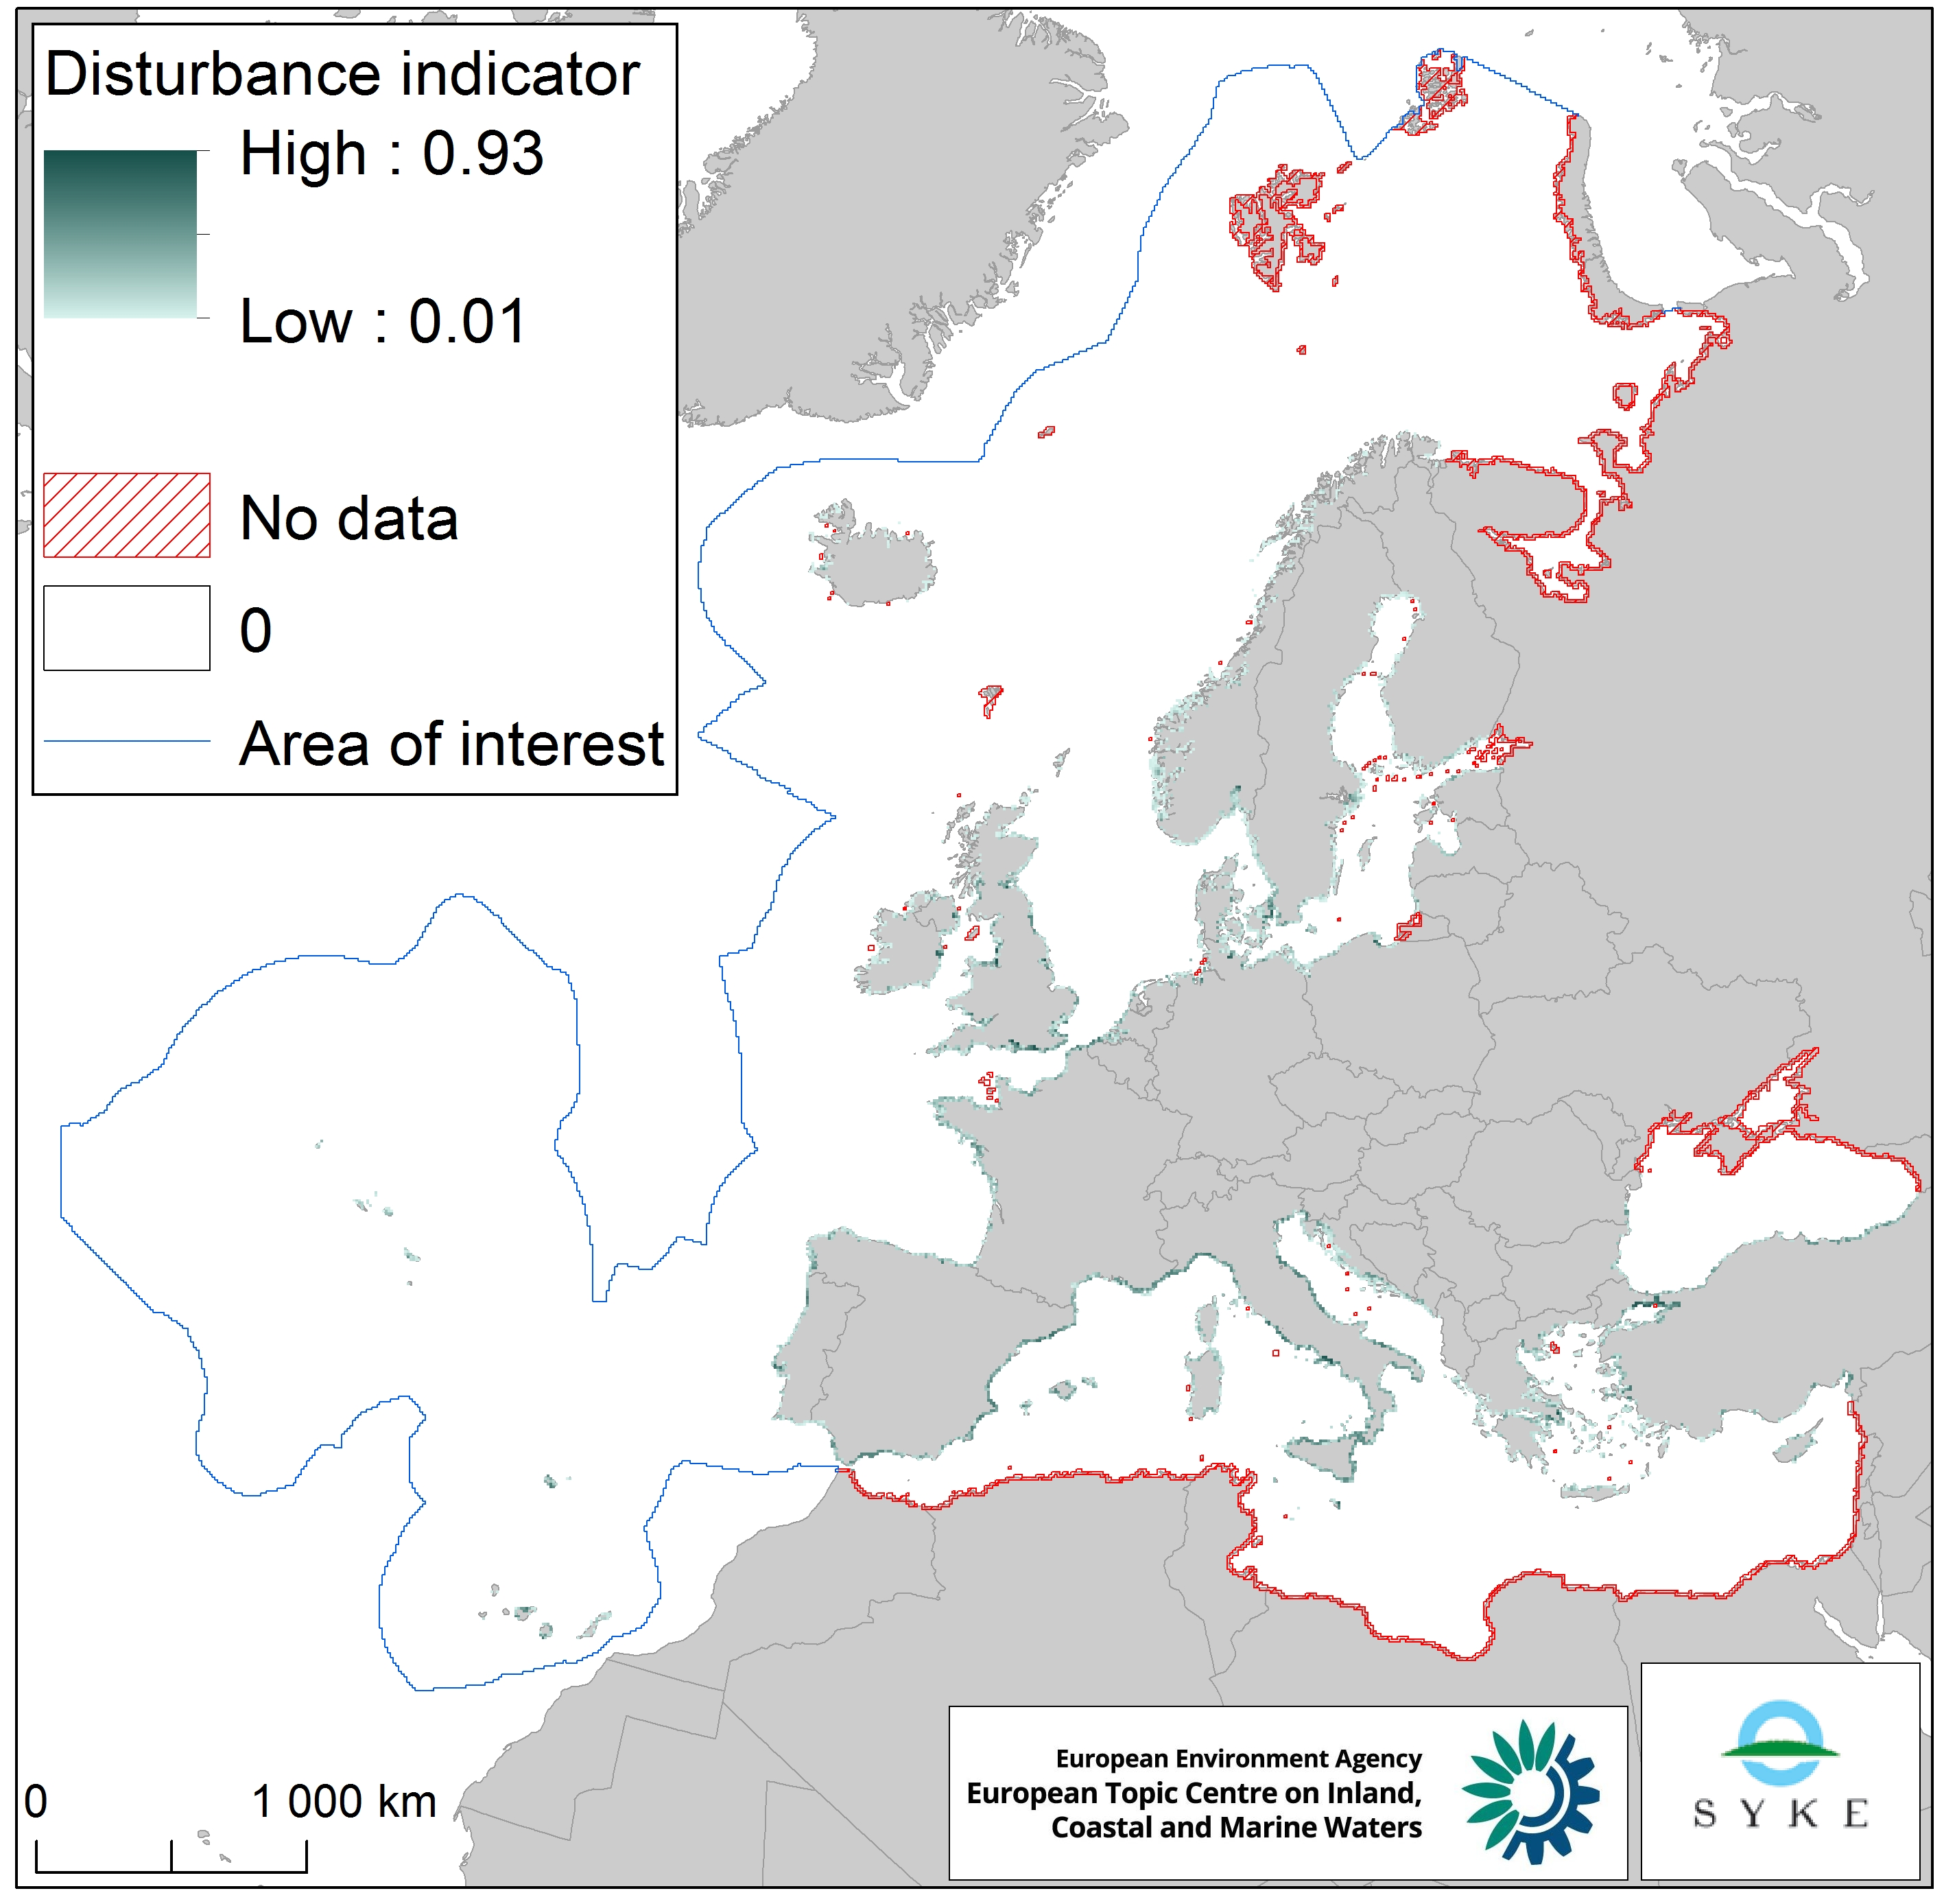
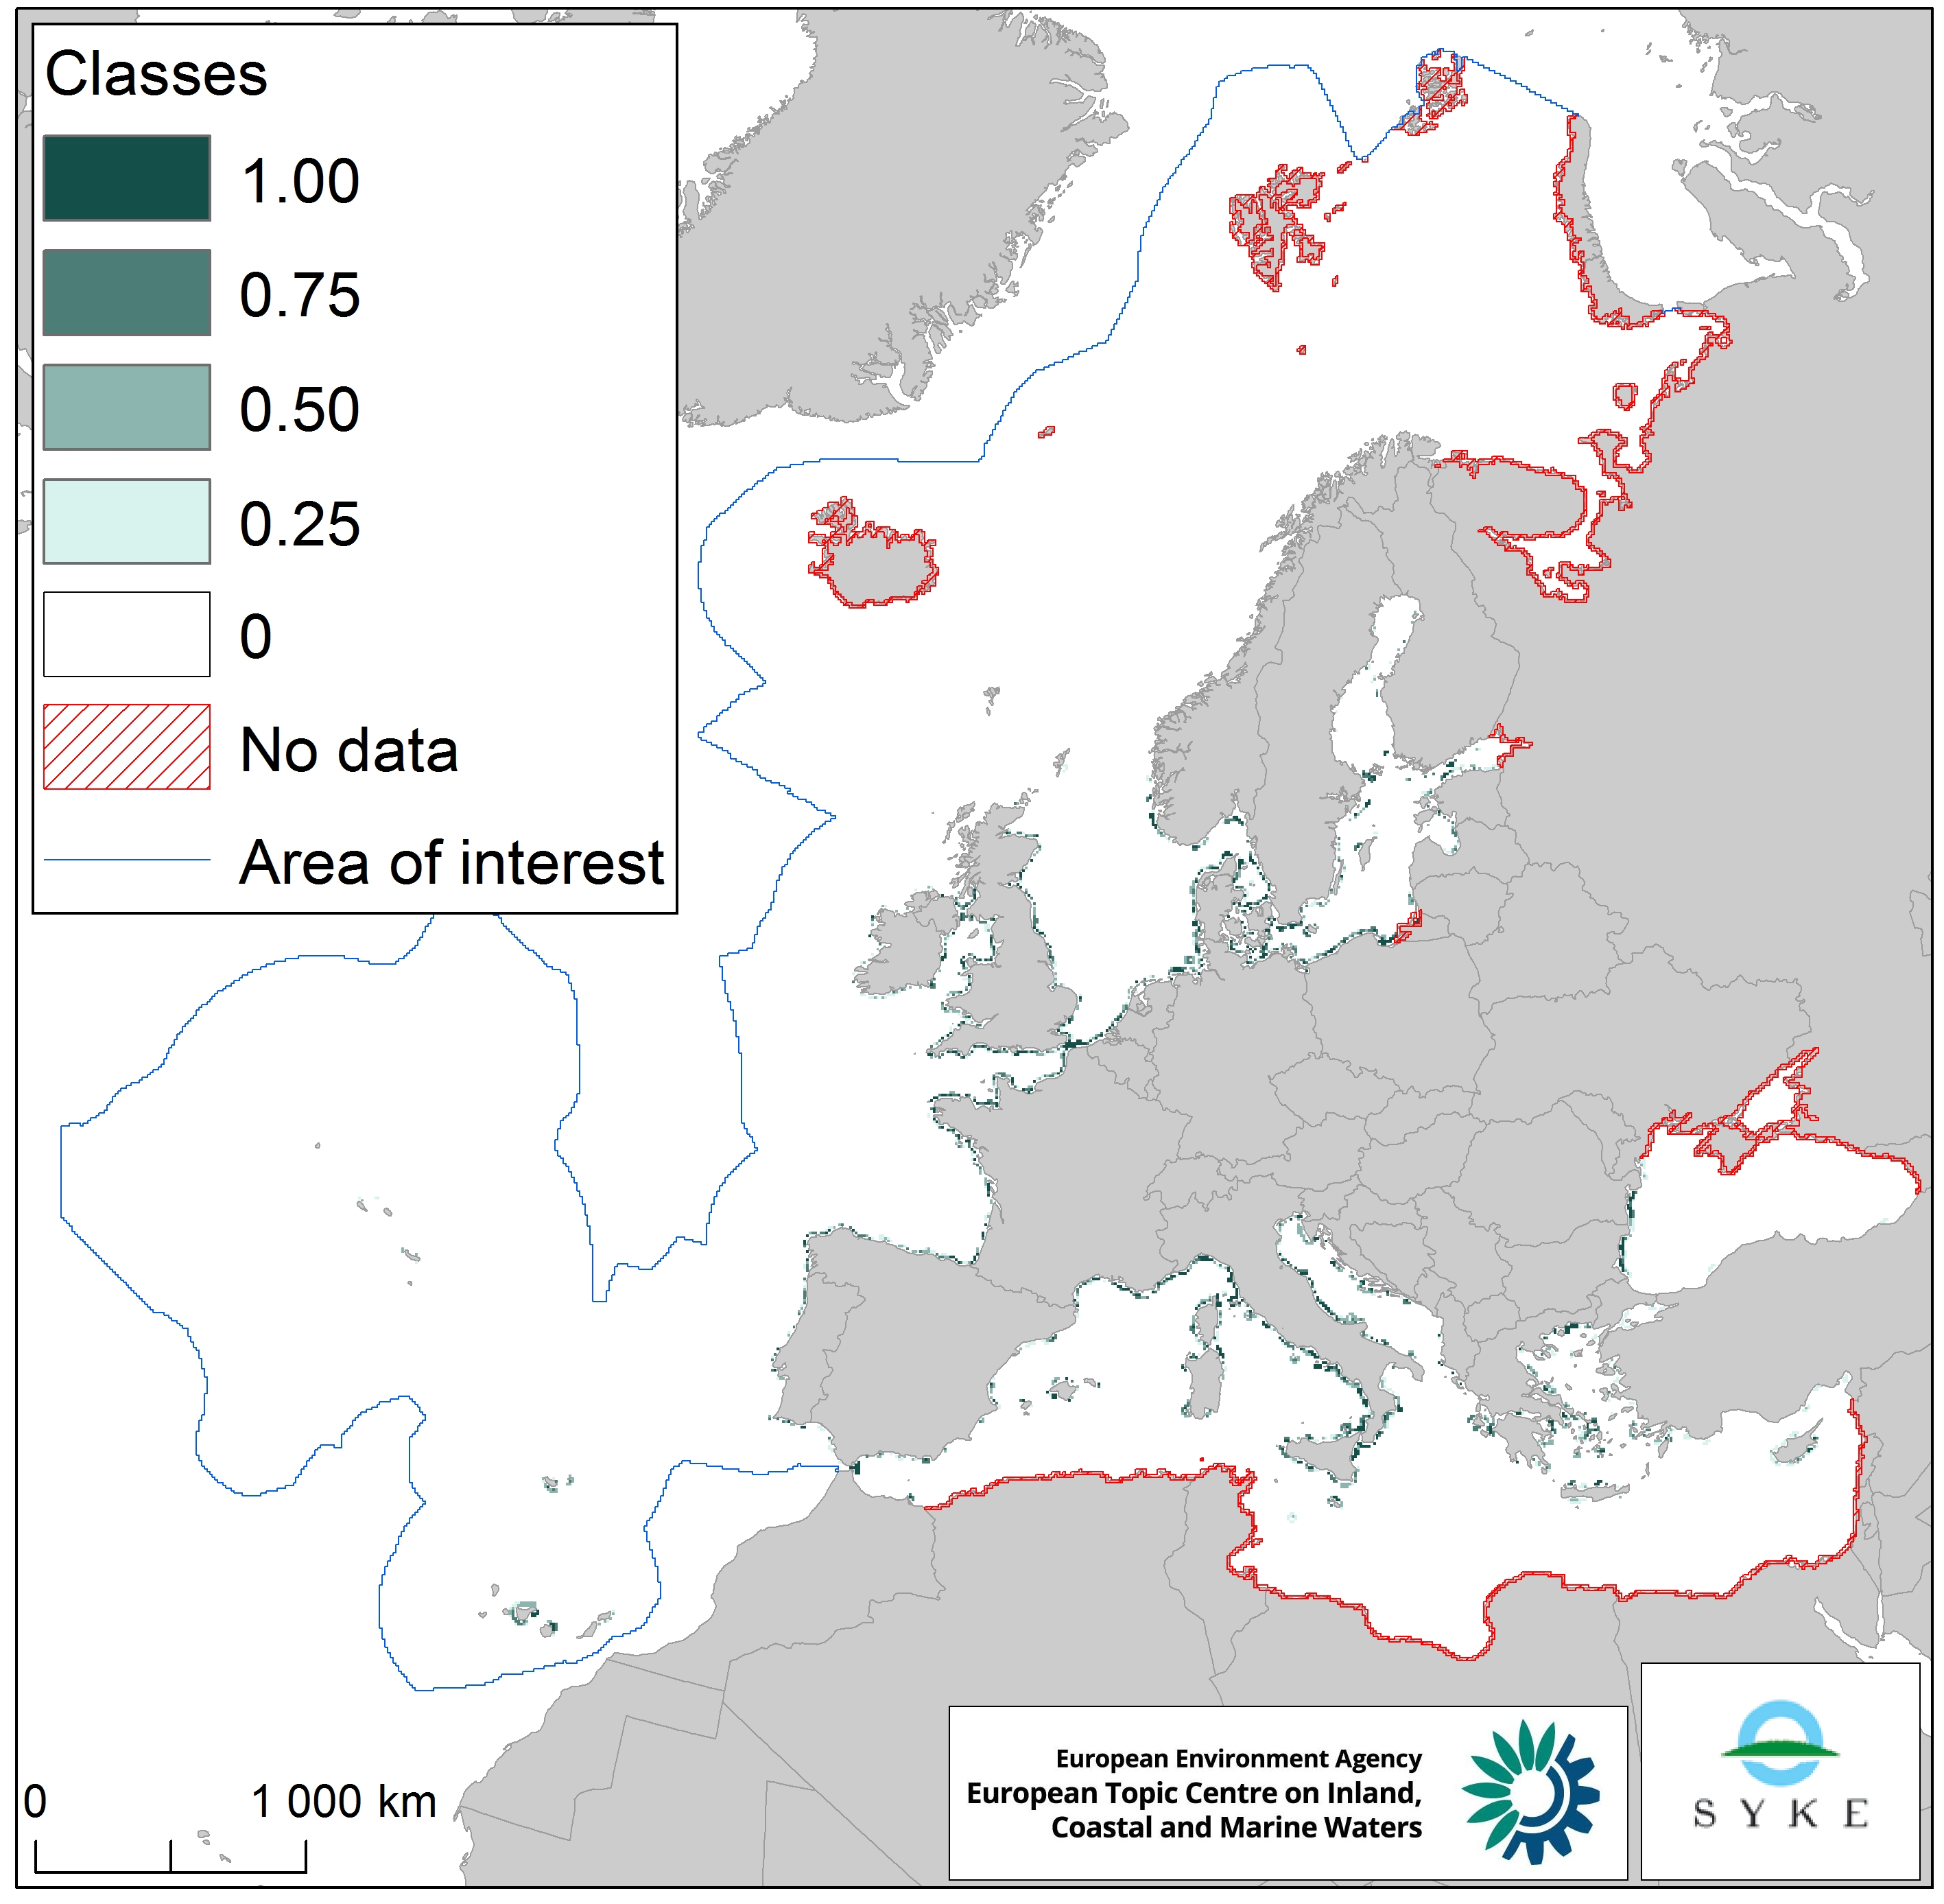
The raster dataset represents the intensity of species disturbance due to human presence along European coastlines. The dataset was created by combining the coastal urbanisation layer derived from Corine Land Cover 2012 (with the percentage of urbanised coastline per EEA 10 km grid cell) and the population density layer based on EUROSTAT NUTS 2016 data (with the population density in the NUTS 3 region corresponding to the coastal EEA 10 km grid cell). The dataset does not cover southern and western Mediterranean Sea, northern Black Sea and northernmost Atlantic Ocean. The dataset was prepared for the combined effect index produced for the ETC/ICM Report 4/2019 "Multiple pressures and their combined effects in Europe's seas" available on: https://www.eionet.europa.eu/etcs/etc-icm/etc-icm-report-4-2019-multiple-pressures-and-their-combined-effects-in-europes-seas-1.
-
This raster dataset represents the input of microbial pathogens along the European coastlines. The pressure layer was created using three different datasets rasterized using the EEA 10 km grid: urban agglomerations reported under the Urban Waste Water Treatment Directive (2017), EMODnet dataset of ports lying on the sea coast together with passenger information (annual average 2006-2016) and Intestinal enterococci and Escherichia coli data at bathing sites as measured under the Bathing Water Directive reporting obligation (average 2008-2016). All three datasets were then classified into four classes, aggregated and classified again (quantile classes between 0 and 1, with the latter being the highest pathogen pressure). This dataset has been prepared for the calculation of the combined effect index, produced for the ETC/ICM Report 4/2019 "Multiple pressures and their combined effects in Europe's seas" available on: https://www.eionet.europa.eu/etcs/etc-icm/etc-icm-report-4-2019-multiple-pressures-and-their-combined-effects-in-europes-seas-1.