 Catalogue PIGMA
Ocean colour
Type of resources
Available actions
Topics
Keywords
Contact for the resource
Provided by
Years
Formats
Representation types
Update frequencies
status
Scale
Resolution
-
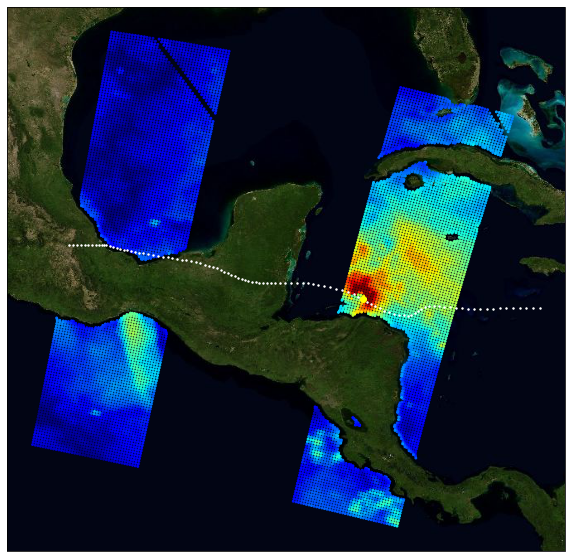
This Level 2 product provides marine reflectances from the VENµS mission, processed with the Polymer algorithm, on a subset of sites with coastal or inland areas. VENµS (Vegetation and Environment monitoring on a New Micro-Satellite) is a Franco-Israeli satellite launched in 2017, dedicated to the fine and regular monitoring of terrestrial vegetation, in particular cultivated areas, forests, protected natural areas, etc. The images acquired in 12 spectral bands by a camera provided by CNES, on a selection of about one hundred scientific sites spread over the planet, are of high spatial (5 m) and temporal resolution. The lifetime of the VENµS satellite has been divided into two phases: a first phase VM1 at an altitude of 720 km with a 2-day revisit, a native spatial resolution of 5.3 m and a swath of 27.6 km from August 2017 to November 2020, and a second phase VM5 at an altitude of 560 km with a daily revisit, a native spatial resolution of 4.1 m and a swath of 21.3 km from March 2022 to July 2024. VENµS is the first sensor on board an orbiting satellite to combine such revisit frequency and spatial finesse for vegetation monitoring. A subset of sites with coastal areas or inland waters have been identified to generate Level 2 data dedicated to marine reflectance. The geographical areas covered are given through a kmz file, see below to download it. This Level 2 data product has been processed using the Polymer algorithm developed by Hygeos (https://hygeos.com/en/polymer/) and provides marine reflectances for the VENµS bands from 420 to 865 nm. These reflectances, without units, include a bidirectional normalization for the Sun at nadir and the observer at nadir. VENµS data products (Level-1, Level-2 and Level-3) are primarily generated with the MAJA algorithm, further information can be found on THEIA website: https://www.theia-land.fr/en/product/venus/
-
The database here presented includes quality-controlled bio-optical and biogeochemical variables derived from autonomous profiling Biogeochemical Argo float measurements, and supports field and remote ocean color applications. Data represent the first optical depth (i.e., the layer of interest for satellite remote sensing) and have been collected between October 2012 and January 2016, around local noon, in several oceanic areas encompassing the diversity of ocean’s trophic environments. In addition to the first optical depth (as derived from the in situ measured depth of the euphotic layer), the presented database is compiled with data of diffuse light attenuation coefficients of photosynthetically available radiation and downward irradiance at 3 wavelengths (380, 412 and 490 nm), chlorophyll a concentration, fluorescent dissolved organic matter, and particle light backscattering at 700 nm. Associated errors to each variable are also reported.
-
Atmosphere optical parameters: aerosol thickness, cloud fraction, water vapour column…
-
This benchmark dataset contains the physical data used as predictors to reconstruct global chlorophyll-a concentrations (Chl, a proxy of phytoplankton biomass) in Roussillon et al., as well as the reference satellite Chl target fields. The nine physical predictors' data (Short-Wave radiations, Sea Surface Temperature, Sea Level Anomaly, Zonal and meridional surface currents, Zonal and meridional surface wind stress, Bathymetry, Binary continental mask) were extracted from publicly available datasets over [1998-2015] and resampled to the same spatio-temporel resolution as Chl, i.e. monthly on a 1°x1° grid between 50°N and 50°S. Missing values were gap-filled using the heat diffusion equation. Each variable was normalized by substracting its mean from the original values and dividing by its standard deviation over [1998-2015]. This dataset was used to train and validate the Multi-Mode Convolutional Neural network (CNNMM8) introduced in Roussillon et al. ; reconstructed monthly Chl fields over the [2012-2015] test period are also provided here. We hope this benchmark dataset can help to promote the improvements of methods as well as the emergence of new ideas, as building datasets is sometimes more time-consuming than the implementation of machine learning tools themselves. This would also facilitate the quantitative comparison of models performances' on the exact same datasets.
-

The ODATIS Ocean Color MR product provides optical reflectance measurements as well as related physical, subsurface and biogeochemical parameters at 300 m spatial resolution along the entire French metropolitan coastal zone, according to the criteria defined by the ODATIS Scientific Expert Consortium (CES) dedicated to ocean color : https://www.odatis-ocean.fr/activites/consortium-dexpertise-scientifique/ces-couleur-de-locean. Product processing is performed from Level 1 to Level 3, and is reprojected on a regular square grid format. Data are temporally aggregated and provided as daily, 8 day and monthly products. The "Basic" version of the ODATIS MR product includes data from the MODIS sensor processed with the "NIR/SWIR" atmospheric correction method (Wang and Shi, 2007), as well as data from the MERIS and OLCI-A/B sensors processed with the Polymer atmospheric correction (Hygeos, https://www.hygeos.com/polymer). List of available parameters for each sensor: • MODIS : NRRS555, CHL-OC5, SPM-G, CDOM, T-FNU, SST-NIGHT • OLCI-A/B / MERIS : NRRS560, CHL-OC5, SPM-G, CDOM, T-FNU
-

Coastal Surveillance Through Observation of Ocean Color (COASTlOOC) oceanographic expeditions were conducted in 1997 and 1998 to examine the relationship between the optical properties of seawater and related biological and chemical properties across the coastal-to-open ocean gradient in various European seas. A total of 379 stations were visited along the coasts of the Gulf of Lion in the Mediterranean Sea (n = 61), Adriatic Sea (n = 39), Baltic Sea (n = 57), North Sea (n = 99), English Channel (n = 85) and Atlantic Ocean (n = 38). Particular emphasis was dedicated to the collection of a comprehensive set of apparent (AOPs) and inherent (IOPs) optical properties to support the development of ocean color remote sensing algorithms. The data were collected in situ using traditional ship-based sampling, but also from a helicopter, which is a very efficient means for that type of coastal sampling. The dataset collected during the COASTlOOC campaigns is unique in that it is fully consistent in terms of operators, protocols, and instrumentation. This rich and historical dataset is still today frequently requested and used by other researchers. Therefore, we present the result of an effort to compile and standardize a dataset which will facilitate its use in future development and evaluation of new bio-optical models adapted for optically-complex waters.
-
This dataset contains bio-optical measurements from BioGeoChemical-Argo (BGC-Argo) profiling floats complemented with ocean-colour satellite matchups of variables related to the detection of coccolithophore blooms dominated by Emiliania huxleyi. BGC-Argo float data cover the global ocean from November 2012 to December 2018 and include measurements of the particulate backscattering coefficient (BBP_float in m-1), the concentration of Chlorophyll-a (CHLA_float in mg m-3), and the particulate beam attenuation coefficient (CP_float in m-1) with data processing and quality control described in the manuscript entitled “Detection of coccolithophore blooms with BioGeoChemical-Argo floats” submitted to Geophysical Research Letters. The data represent near-surface ocean conditions, calculated as the average value in the top 15m of the water column. Daily ocean-colour satellite data were downloaded from the GlobColour project (ftp://ftp.hermes.acri.fr) with a spatial resolution of 4km and matched with every BGC-Argo float observation by using a 5x5 pixel box and a 9-day temporal window. For each float observation, we extracted concurrent satellite data of the concentrations of Particulate Inorganic Carbon (PIC_sat in mmol m-3) and Particulate Organic Carbon (POC_sat in mmol m-3), from which we derived the proportion of PIC_sat to the total particulate carbon concentration (PIC_POC_sat in % and defined as PIC_sat / [PIC_sat+POC_sat]). Coccolithophore bloom periods were identified using annual times series of PIC_sat and PIC_POC_sat at each profile location as described in the submitted manuscript, and the column “inside_coccolithophore_bloom” reports the float observations occurring inside such blooms.
-
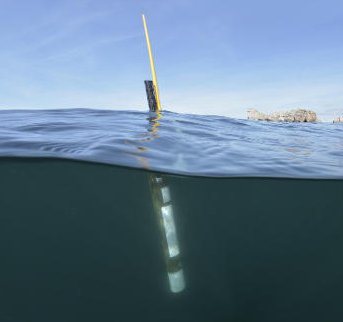
Argo is a global array of 3,000 free-drifting profiling floats that measures the temperature and salinity of the upper 2000 m of the ocean. This allows, for the first time, continuous monitoring of the temperature, salinity, and velocity of the upper ocean, with all data being relayed and made publicly available within hours after collection. The array provides 100,000 temperature/salinity profiles and velocity measurements per year distributed over the global oceans at an average of 3-degree spacing. Some floats provide additional bio-geo parameters such as oxygen or chlorophyll. All data collected by Argo floats are publically available in near real-time via the Global Data Assembly Centers (GDACs) in Brest (France) and Monterey (California) after an automated quality control (QC), and in scientifically quality controlled form, delayed mode data, via the GDACs within six months of collection.
-
The primary objective of the ESA Marine Atmosphere eXtreme Satellite Synergy (MAXSS) project is to provide guidance and innovative methodologies to maximize the synergetic use of available Earth Observation data (satellite, in situ) to improve understanding about the multi-scale dynamical characteristics of extreme air-sea interaction. This dataset, produced in the frame of MAXSS project, provides multi-variate observations for Arctic polar lows (PL), for a selection of storm tracks extracted from Rojo et al (2019) during the period 2010-2018. The observations are taken from more than 35 satellite, numerical model and in situ sources, providing the inner and surface ocean conditions for a comprehensive range of parameters (sea surface height, surface winds, waves, precipitation, temperature, salinity, ocean colour, ...) before, during and after the storm passage. Different colocation radii and time windows are used depending on the parameter and observation dataset. The assembled data are stored in a standardized NetCDF4 file format and organised per basin, year, and storm name to ease data manipulation for users that are not used to work with this wealth of data.