 Catalogue PIGMA
Sea temperature
Type of resources
Available actions
Topics
Keywords
Contact for the resource
Provided by
Years
Formats
Representation types
Update frequencies
status
Scale
Resolution
-
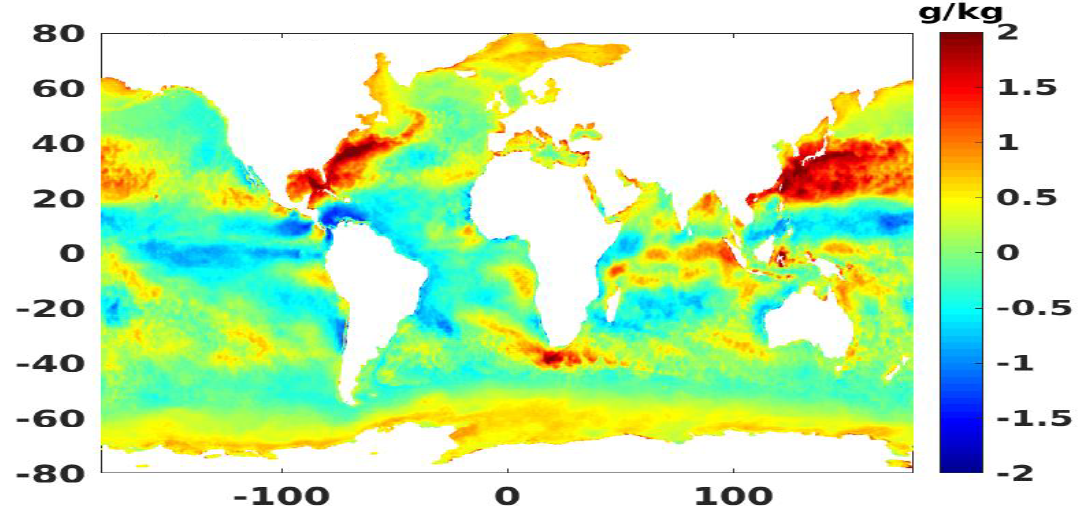
Daily air-sea heat fluxes dataset on the last 27 years (1992-2018). Global coverage with 0.25° resolution. Data is mainly coming from aggregated calibrated scatterometer datasets and numerical models. Main geophysical parameters are: sensible heat flux, latent heat flux, wind speed, SST, air temperature. Latest version : 4.1 released in June 2019.
-
The European Union’s Copernicus-funded TRUSTED project (Towards Fiducial Reference Measurements of Sea-Surface Temperature by European Drifters) has deployed over 100 state of the art drifting buoys for improved validation of Sea Surface Temperature (SST) from the Sentinel-3 Sea and Land Surface Temperature Radiometers (SLSTR). These buoys are manufactured by NKE. The TRUSTED drifting buoys data and metadata are distributed in qualtity control NetCDF files, as a subset of DBCP drifting buoys GDAC (Global Data Assembly Centre). Coriolis DAC (Data Assembly Centre) routinely collects, decodes, quality controls, preserves and distributes data and metadata as NetCDF-CF files. The TRUSTED buoys have specific features managed by Coriolis DAC python data processing chain: a high resolution temperature sensor in addition to the classic drifting buoy temperature sensor. The high sampling and high resolution observations are distributed in specific variables TEMP_HR, TEMP_HR_SPOT, TEMP_HR_XX (XX is the percentile sample).
-
Archive de toutes les données de température de surface (SST) satellite produites dans le cadre du projet international GHRSST. Ifremer est un GDAC pour ces données, miroir du GDAC NASA/JPL. Ces données sont utilisées pour la génération de produits multi-capteurs (CMEMS, Medspiration) mais également dans le cadre d'un grand nombre d'études ou projets nécessitant l'utilisation de mesures de SST. L'archive regroupe plusieurs jeux de données provenant de différents satellite ainsi que des données in situ de référence pour leur validation. Elle est mise à jour en temps quasi-réel depuis 10 ans, avec service de diffusion opérationnelle associé (FTP et HTTP). Une fiche sextant (issue du catalogue CERSAT) sera fournie pour chaque dataset dans cette archive.
-
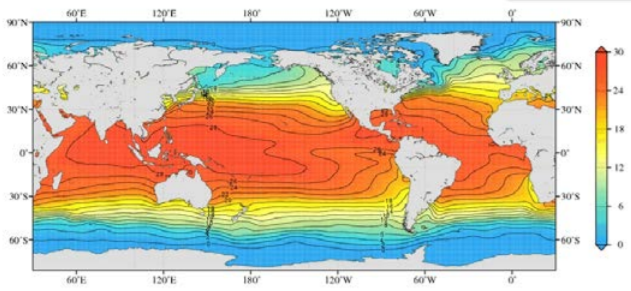
Climatologie de température/salinité de l'océan global basée sur une analyse objective: résolution 1/4° et 1°
-
Routine operation over a period shorter than 5 years (Enhanced Observation Period, EOP)
-
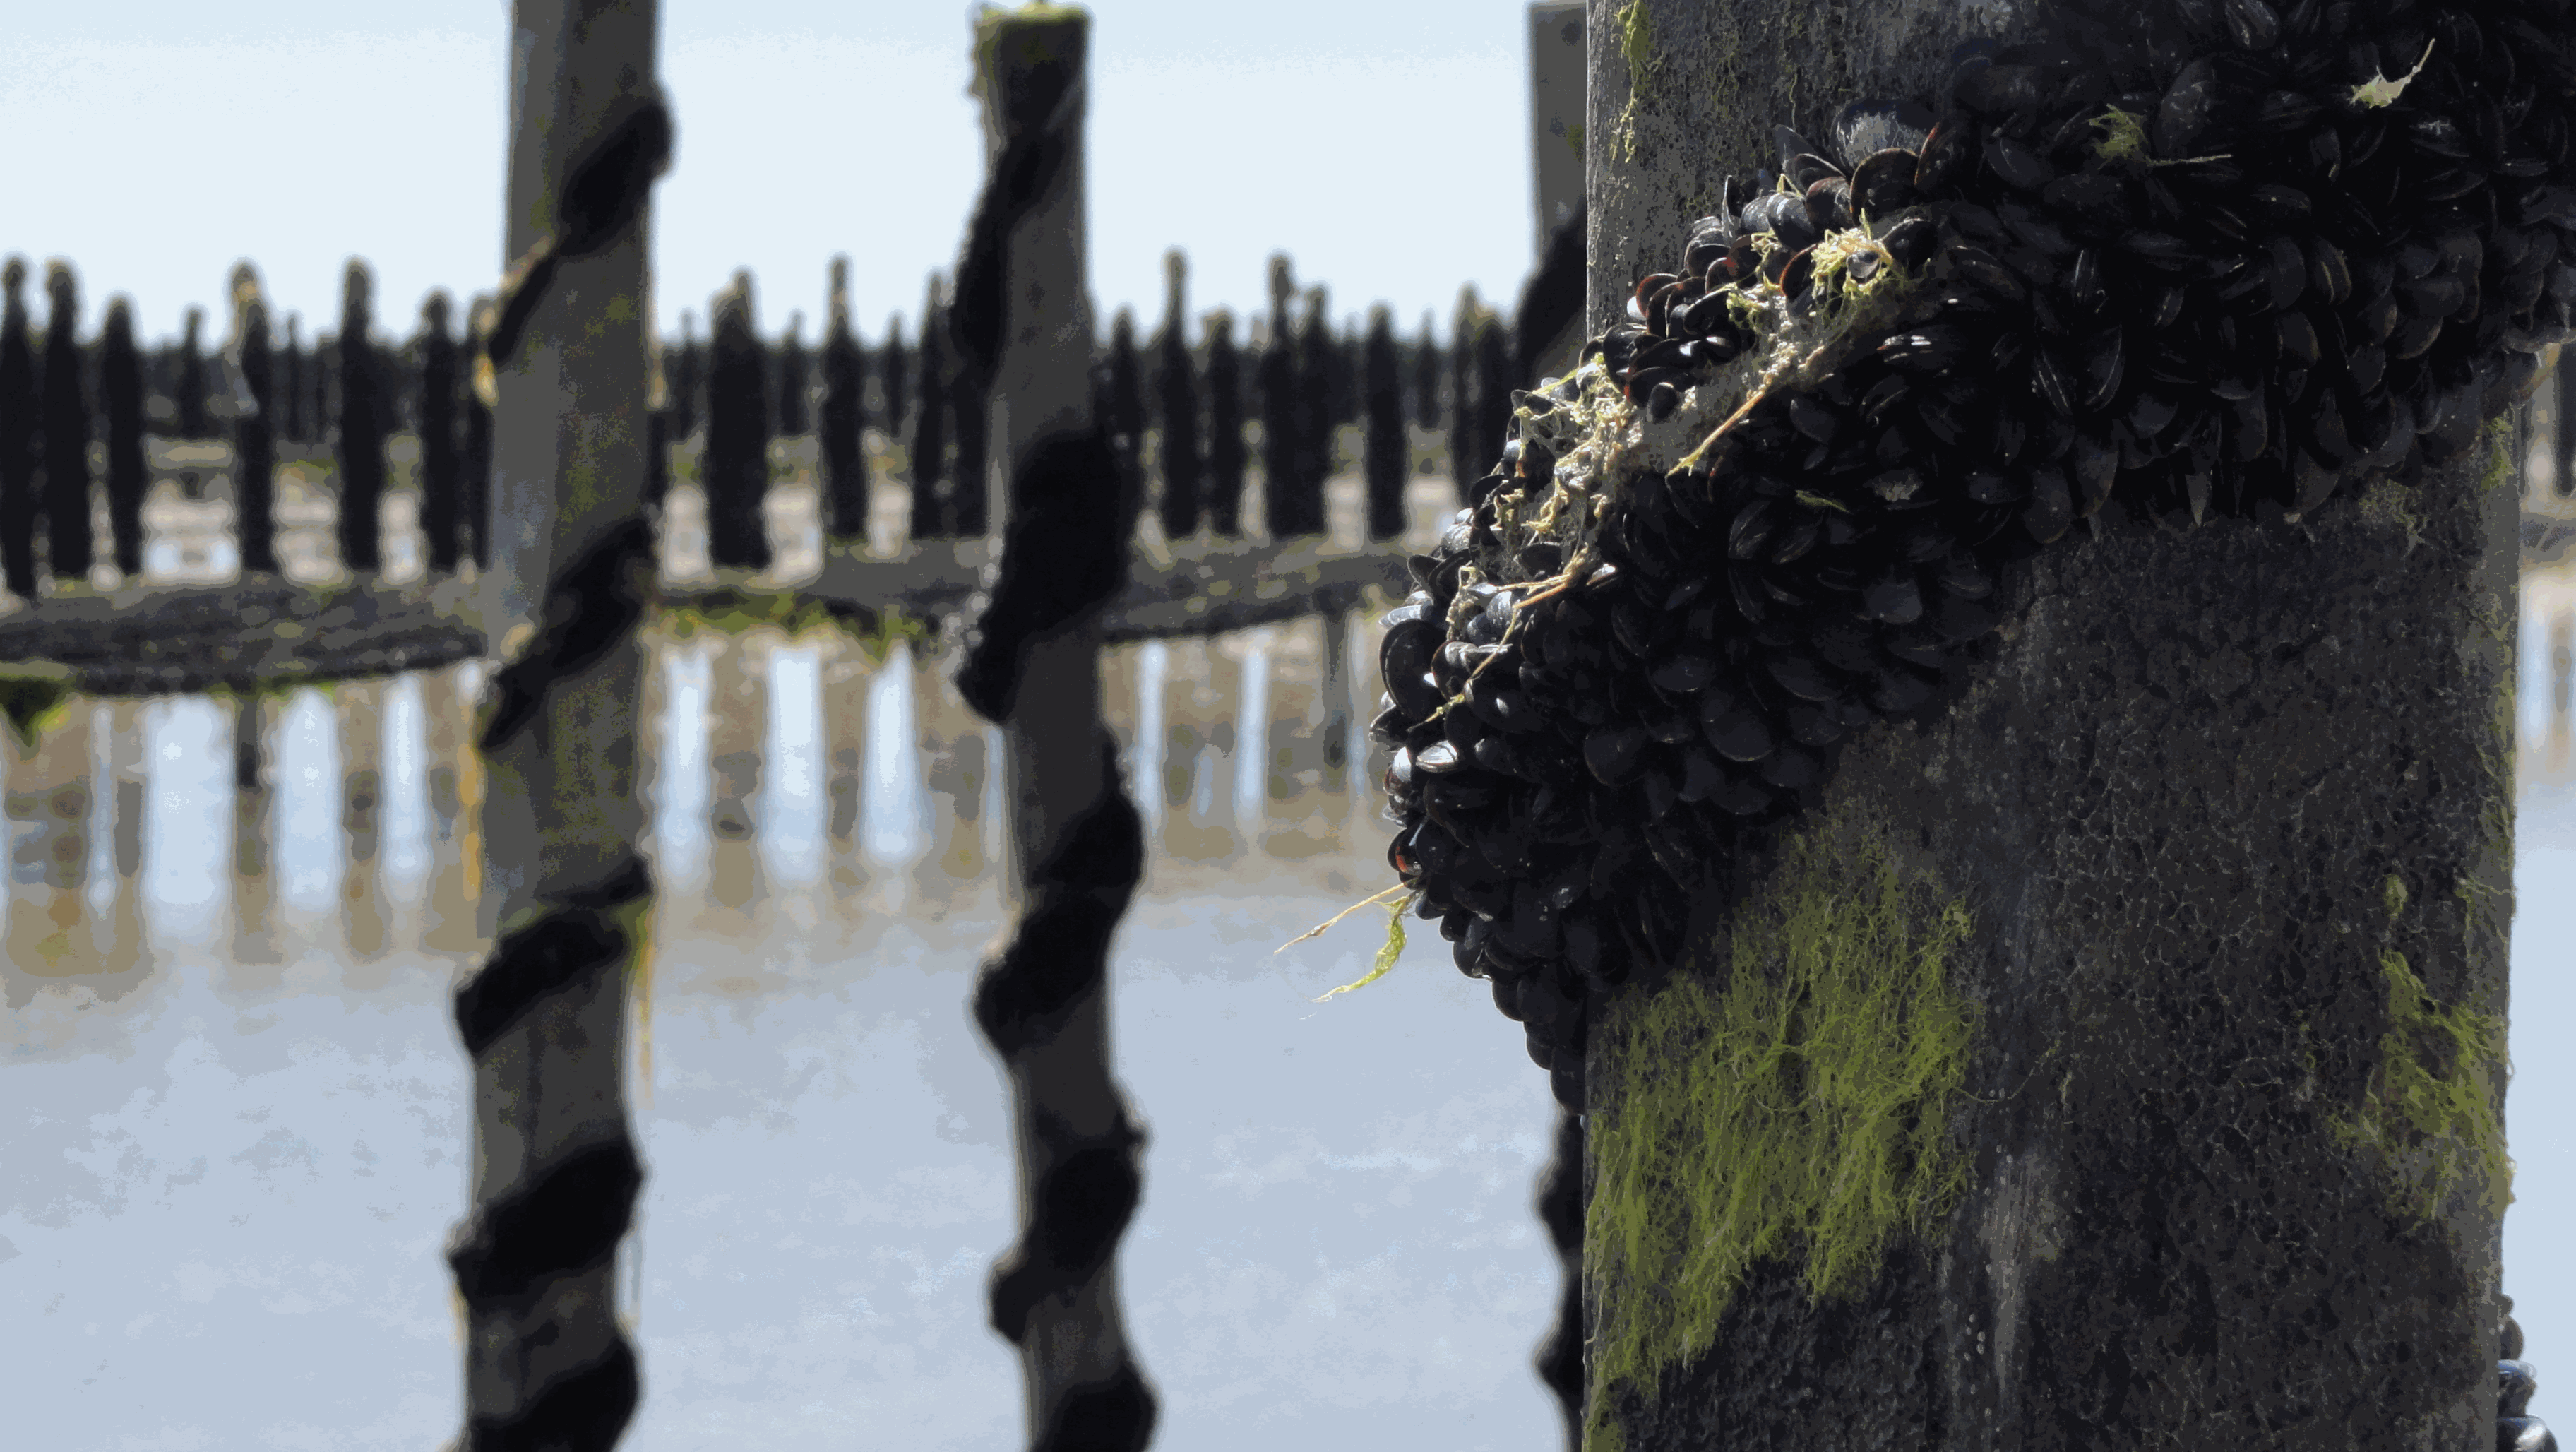
The Mytilobs network, carried out by IFREMER (French Research Institute for Exploitation of the Sea), is a national network dedicated to building long-term physiological variations time series of blue mussels (Mytilus edulis), across a large spatial scale. This observation network, initially designed to survey production yields, also provides valuable data to track environmental variations of coastal ecosystems. Mussels exhibit high phenotypic plasticity in response to environmental variations. Collection of data describing phenotypic variations, over an extended period, reveals small-scale climate and habitat variations. With its broad deployment across time and space, the data produced under Mytilobs will be useful for the establishment of a baseline condition when studying the effect of a perturbation affecting an ecosystem’s functioning. Finally, the monitoring of mussel biometric traits and mortality was coupled with high-frequency measurements of salinity, temperature, and sea level, complementing this multi-layer observational framework.
-
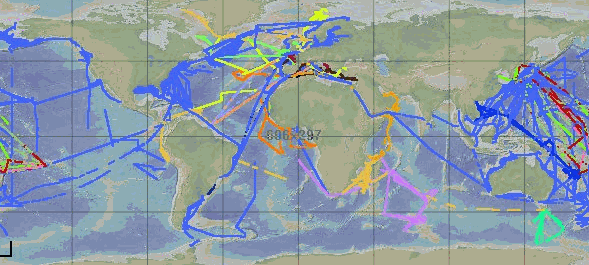
GOSUD aims at assembling in-situ observations of the world ocean surface collected by a variety of ships and at distributing quality controlled datasets. At present time the variables considered by GOSUD are temperature and salinity. The GOSUD data are mostly collected using thermosalinographs (TSG) installed on research vessels, on commercial ships and in some cases on sailing exploration ships GOSUD manages both near-real time data and delayed mode (reprocessed) data.
-
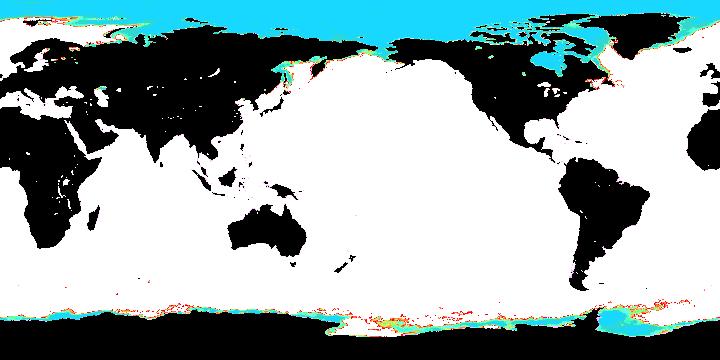
The National Centers for Environmental Prediction (NCEP) Climate Forecast System (CFS) is initialized four times per day (0000, 0600, 1200, and 1800 UTC). NCEP upgraded their operational CFS to version 2 on March 30, 2011. This is the same model that was used to create the NCEP Climate Forecast System Reanalysis (CFSR), and the purpose of this dataset is to extend CFSR. The 6-hourly atmospheric, oceanic and land surface analyzed products and forecasts, available at 0.2, 0.5, 1.0, and 2.5 degree horizontal resolutions, are archived here beginning with January 1, 2011 as an extension of CFSR.
-
Routine operation over a period shorter than 5 years (Enhanced Observation Period, EOP)
-
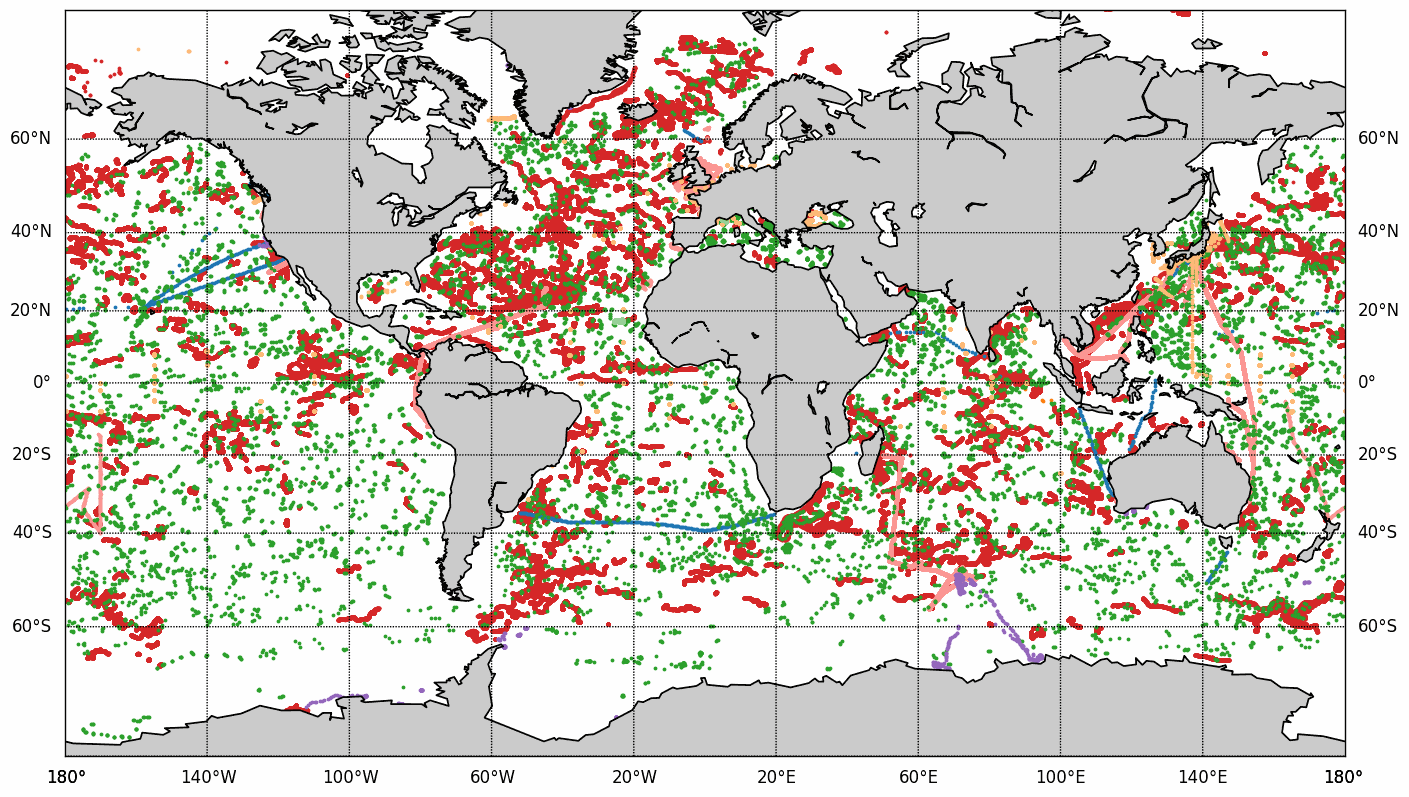
The COriolis Ocean Dataset for Reanalysis (hereafter "CORA") product is a global dataset of in situ temperature and salinity measurements. The CORA observations comes from many different sources collected by Coriolis data centre in collaboration with the In Situ Thematic Centre of the Copernicus Marine Service (CMEMS INSTAC). The observation integrated in the CORA product have been acquired both by autonomous platforms (Argo profilers, fixed moorings , gliders , drifters, sea mammals) , research or opportunity vessels (CTDs, XBTs, ferrybox). From the near real time CMEMS In Situ Thematic Centre product validated on a daily and weekly basis for forecasting purposes, a scientifically validated product is created. It s a "reference product" updated on a yearly basis since 2007. This product has been controlled using an objective analysis (statistical tests) method and a visual quality control (QC). This QC procedure has been developed with the main objective to improve the quality of the dataset to the level required by the climate application and the physical ocean re-analysis activities. It provides T and S weekly gridded fields and individual profiles both on their original level with QC flags and interpolated level. The measured parameters, depending on the data source, are : temperature, salinity. The reference level of measurements is immersion (in meters) or pressure (in decibars). CORA contains historical profiles extracted from the EN.4 global T&S dataset, World Ocean Atlas, SeaDataNet, ICES and other data aggregators . The last version of the CORA product are also available freely from the Copernicus WEB site : - Global Ocean- CORA- In-situ Observations Yearly Delivery in Delayed Mode - Global Ocean- Delayed Mode gridded CORA- In-situ Observations objective analysis in Delayed Mode