 Catalogue PIGMA
Species distribution
Type of resources
Available actions
Topics
Keywords
Contact for the resource
Provided by
Years
Formats
Representation types
Update frequencies
status
Scale
Resolution
-
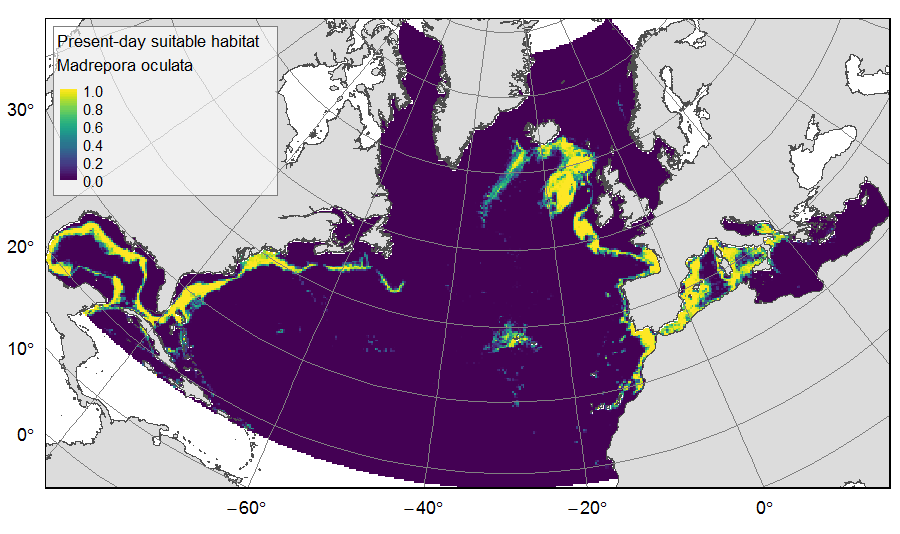
Distribution of predicted suitable habitat for six cold-water-coral, six deep-water fish and one sponge species, on the North Atlantic (18°N to 76°N and 36°E to 98°W). For each species, predicted habitat distribution was obtained for present-day conditions (1951-2000) and for the future climate refugias, i.e. the areas that were predicted as suitable both for present-day and forecasted future (2081-2010) conditions. The dataset gathers 26 raster layers created on the same grid of 25km * 25km resolution, downgraded from source layers (3km *3km resolution) that were created within the work package 3 of EU ATLAS project. The presence (value=1) of climate refugia and the relative cover (value ranging from 0 to 1) of present-day suitable habitat was extracted in gridsquares. This dataset was built to feed a basin-wide spatial conservation planning exercise, targeting the deep sea of the North Atlantic. The goal of this approach was to identify conservation priority areas for Vulnerable Marine Ecosystems (VMEs) and deep fish species, based on the distribution of species and habitats, human activities and current spatial management.
-
Annual time series of eel recruitement, (2005-2014) • Time series of glass and yellow eel for those rivers used in the annual ICES advice to the EU • Location, data availability and long term annual (LTA) eel recruiment per river mouth
-
Phyto plankton Abundance: Identify the 3 most abundant phytoplankton species in the North Atlantic and calculate a timeseries of their abundance within the basin.
-
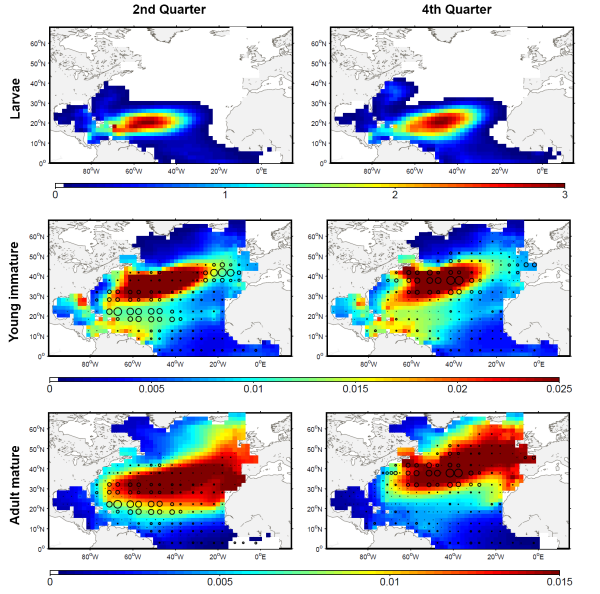
The development of the ecosystem approach and models for the management of ocean marine resources requires easy access to standard validated datasets of historical catch data for the main exploited species. They are used to measure the impact of biomass removal by fisheries and to evaluate the models skills, while the use of standard dataset facilitates models inter-comparison. North Atlantic albacore tuna is exploited all year round by longline and in summer and autumn by surface fisheries and fishery statistics compiled by the International Commission for the Conservation of Atlantic Tunas (ICCAT). Catch and effort with geographical coordinates at monthly spatial resolution of 1° or 5° squares were extracted for this species with a careful definition of fisheries and data screening. In total, thirteen fisheries were defined for the period 1956-2010, with fishing gears longline, troll, mid-water trawl and bait fishing. However, the spatialized catch effort data available in ICCAT database represent a fraction of the entire total catch. Length frequencies of catch were also extracted according to the definition of fisheries above for the period 1956-2010 with a quarterly temporal resolution and spatial resolutions varying from 1°x 1° to 10°x 20°. The resolution used to measure the fish also varies with size-bins of 1, 2 or 5 cm (Fork Length). The screening of data allowed detecting inconsistencies with a relatively large number of samples larger than 150 cm while all studies on the growth of albacore suggest that fish rarely grow up over 130 cm. Therefore, a threshold value of 130 cm has been arbitrarily fixed and all length frequency data above this value removed from the original data set.
-
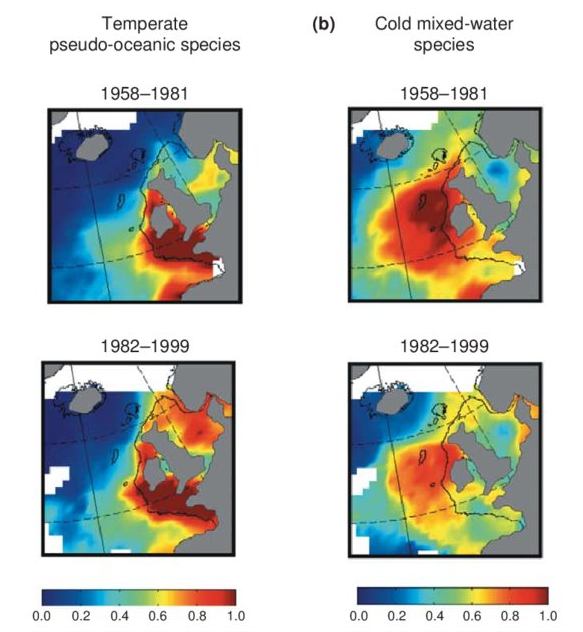
Excel file containing CPR data from Standard Areas B4,C3,C4,D3,D4,D5,E4,F4 for the plankton Calanus finmarchicus and helgolandicus, total traverse (small) copepods, total large copepods, Phytoplankton Colour Index and Cnidaria (presence denoted by a 1, absence by a zero). All taxa are from 1980, except Cnidaria which are from 2011. Dataset is in the format of sample level data, with each row being a discrete sample, with a sample being 3m3 filtered seawater, and 10nm of tow. For each row, a sample has the following information, starting at column a: Standard area of sample, sample id, latitude (decimal degrees) of sample mid point, longitude (decimal degrees) of sample midpoint, sample midpoint date and local time, year of sample, month of sample, then plankton abundance values (or PCI index or cnidaria presence/absence). All taxa have been looked for during the period this dataset spans, so zero values represent true absence.
-
-
-

The Commission for the Conservation Southern Bluefin Tuna collects a variety of data types from its Members and Cooperating Non-Members, including total catch, catch and effort data, and catch at size data. Catch, size and trade information is also collected through the Commission's Catch Documentation Scheme, Japanese import statistics, and other monitoring programs. Annual catches provided on this page are reported on a calendar year basis. CCSBT Members use quota years (not calendar years) for managing catching limits, but quota years differ between Members, so calendar years are used to provide catches on a common timescale. Relevant subsets and summaries of these data are provided below. All figures are subject to change as improved data or estimates become available. In particular, reviews of SBT data in 2006 indicated that southern bluefin tuna catches may have been substantially under-reported over the previous 10-20 years and the data presented here do not include estimates for this unreported catch. Also, data for the last reported year of catch (2020) are preliminary and are subject to revision. Any latitudes and longitudes presented in these summaries represent the north western corner of the relevant grid, which is a 5*5 grid unless otherwise specified. Other information on Members and Cooperating Non-Members fishing activities appears in the reports of the Extended Scientific Committee, Compliance Committee and Extended Commission.