Turbidity
Type of resources
Available actions
Topics
Keywords
Contact for the resource
Provided by
Years
Formats
Representation types
Update frequencies
status
Scale
-
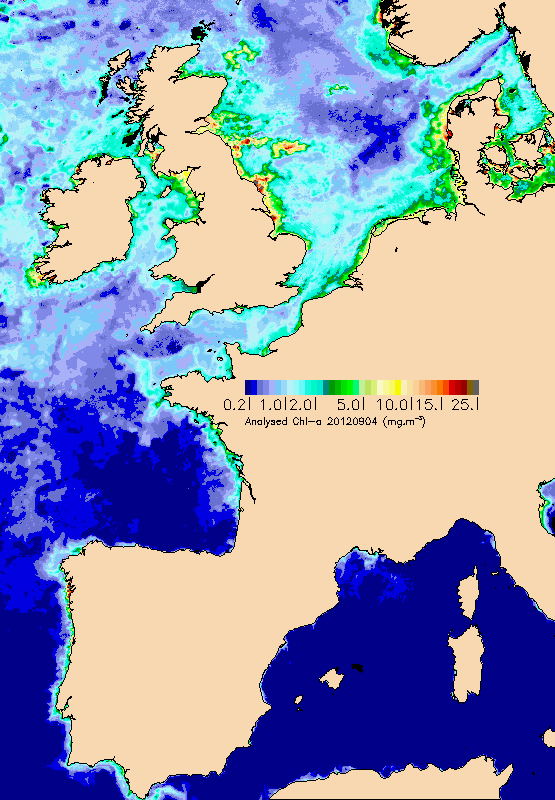
Daily maps of chlorophyll, mineral materials in suspension and turbidity (in addition to the KPAR attenuation coefficient) in photosynthesis wavelength) are drawn up from marine reflectance data (water colour) provided directly by space agencies (NASA, Agence Spatiale Européenne, EUMETSAT), or by the MyOcean/GMES project on which Ifremer collaborates. Multi sensor maps are also offered by interpolation in order to provide information, even in the presence of cloud cover. Reflectance data is processed by Ifremer algorithms and will enhance an archive which began in 1998. The data is continuously validated thanks to in situ measurements which are mostly provided by equipped buoys or the REPHY network.
-
CTD data collected during the French oceanographic cruises or joint programs.
-

In the framework of the ANR AMORAD project, the METEOR cruises (Grasso, 2017) aimed at deploying the ‘Gironde Estuary Mouth MEasurement Stations’ (GEMMES) to measure hydrodynamics and sediment dynamics at the mouth of the Gironde Estuary and on the West Gironde Mud Patch (SW France, Bay of Biscay). Measurements were carried out between November 2016 and December 2017: i) from a buoy station around 20-m water depth (GEMMES-20), collecting sub-surface data of temperature, salinity and turbidity; and ii) a benthic station around 40-m water depth (GEMMES-40), collecting data of current velocity and turbidity. Bottom and surface water samples were regularly collected to calibrate turbidity measurements to SPM concentrations.
-
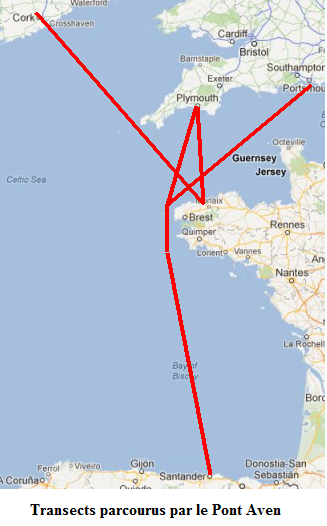
The Ferry Box onboard Brittany Ferries’ Pont Aven vessel, which was installed in collaboration with Roscoff Marine Station, was financed by the Previmer project (CPER Bretagne funding). Within the context of this project, the data acquired by the device is used in the Previmer oceanographic models. The data can be accessed with the Coriolis oceanographic data server. Six surface parameters (temperature, salinity, oxygen content, chlorophyll fluorescence, turbidity and CDOM) are regularly measured during transects through a given area. In addition to these observations, plankton (both phyto and zooplankton are counted in the same way as for the Marine Station FerryBox installed onboard the Armorique ferry.
-
The MAGEST observation network aims to continuously monitor the physico-chemical quality of the waters of the estuaries of Northern Aquitaine. In 2023, this regional network is composed of 12 stations.
-
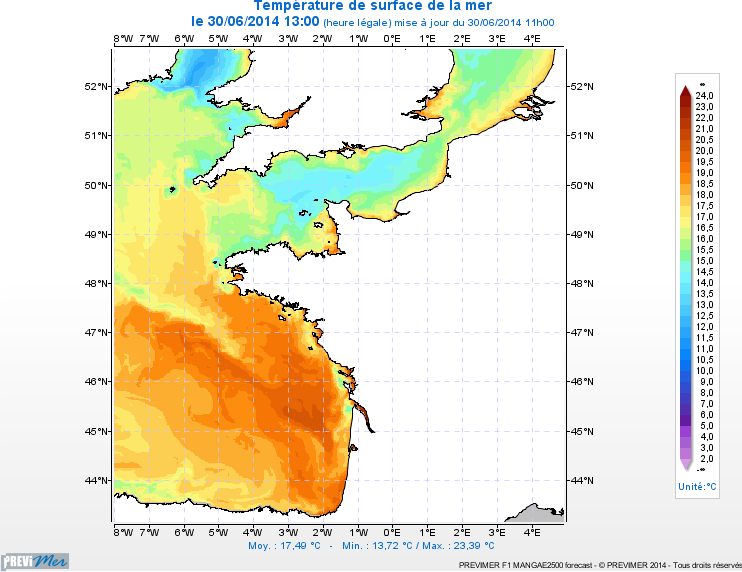
3D PREVIMER Modelling : current, temperature, salinity and turbidity in the English Channel and Bay of Biscay Modélisation Period 2010-2013 + 4-day forecasts
-
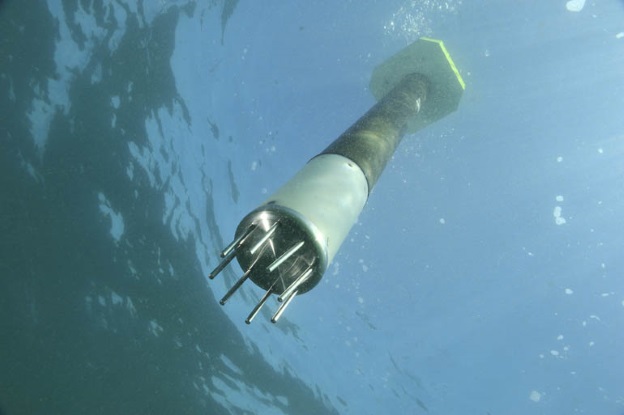
ARVOR-C is a subsurface profiling float designed to operate in coastal environments and to perform oceanographic measurements like a moored installation. Its design has been improved to reduce its drift thanks to a seabed claw and anti-drift claws, an optimized profile speed (~ 25 cm / s) and a short-period data transmission. It is able to process more than 300 profiles and real-time data transmission via Iridium satellite system.
-

This REPHY dataset includes long-term time series on marine phytoplankton and physico-chemical measures, since 1987, along the whole French metropolitan coast. Some of these data are shared with those of the following regional networks: SRN (Hauts-de-France), RHLN (Normandy), ARCHYD (Arcachon), RSLHYD (Mediterranean lagoons). REPHY dataset from overseas departments (Martinique, Guadeloupe and French Guiana in West Atlantic waters; Reunion Island and Mayotte in Indian Ocean) will be available later. Phytoplankton data essentially cover microscopic taxonomic identifications and counts, but also pigments measures and flux cytometry measures in few regions. Physico-chemical measures include temperature, salinity, turbidity, dissolved oxygen, nutrients and chlorophylle a. The whole dataset is available, but is also divided into regions: North Sea + Channel + Atlantic, Mediterranean. For each of these two regional datasets, one includes only phytoplankton counts (PHYTO), the other (HYDRO) includes physico-chemical measures, pigments and flux cytometry measures.
-

The Greenland-Portugal A25 OVIDE line is carried out biennially since 2002. The section is composed of 98 stations where hydrographic, biogeochemical and current measurements are carried out down to the bottom. OVIDE is a contribution to the international programs Go-Ship, IOCCP, and CLIVAR. This data set contains the final (adjusted) CTDO2 data.
-
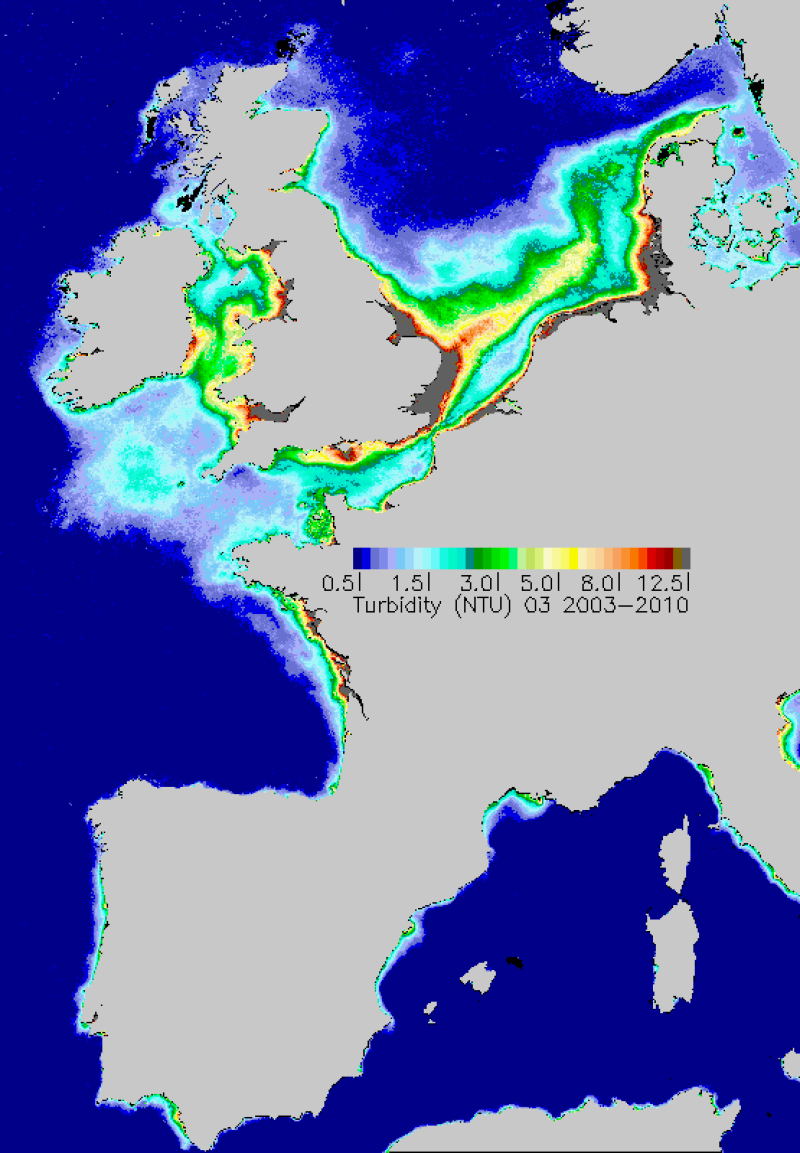
Average monthly turbidity maps made during the period 2003-2010. Turbidity is estimated from the concentrations of inorganic suspended materials and chlorophyll-a.
 Catalogue PIGMA