 Catalogue PIGMA
2022
Type of resources
Available actions
Topics
Keywords
Contact for the resource
Provided by
Years
Formats
Representation types
Update frequencies
status
Service types
Scale
Resolution
-
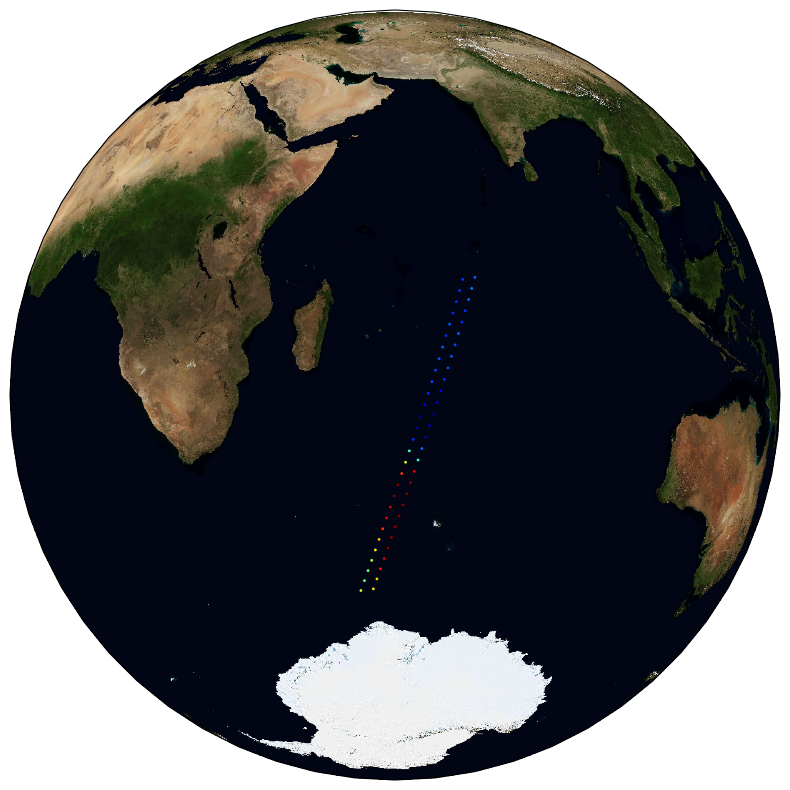
The ESA Sea State Climate Change Initiative (CCI) project has produced global multi-sensor time-series of along-track satellite synthetic aperture radar (SAR) integrated sea state parameters (ISSP) data from ENVISAT (referred to as SAR Wave Mode onboard ENVISAT Level 2P (L2P) ISSP data) with a particular focus for use in climate studies. This dataset contains the ENVISAT Remote Sensing Integrated Sea State Parameter product (version 1.1), which forms part of the ESA Sea State CCI version 3.0 release. This product provides along-track significant wave height (SWH) measurements at 5km resolution every 100km, processed using the Li et al., 2020 empirical model, separated per satellite and pass, including all measurements with flags and uncertainty estimates. These are expert products with rich content and no data loss. The SAR Wave Mode data used in the Sea State CCI SAR WV onboard ENVISAT Level 2P (L2P) ISSP v3 dataset come from the ENVISAT satellite mission spanning from 2002 to 2012.
-
Understanding the dynamics of species interactions for food (prey-predator, competition for resources) and the functioning of trophic networks (dependence on trophic pathways, food chain flows, etc.) has become a thriving ecological research field in recent decades. This empirical knowledge is then used to develop population and ecosystem modelling approaches to support ecosystem-based management. The TrophicCS data set offers spatialized trophic information on a large spatial scale (the entire Celtic Sea continental shelf and upper slope) for a wide range of species. It combines ingested prey (gut content analysis) and a more integrated indicator of food sources (stable isotope analysis). A total of 1337 samples of large epifaunal invertebrates (bivalve mollusks and decapod crustaceans), zooplankton, fish and cephalopods, corresponding to 114 species, were collected and analyzed for stable isotope analysis of their carbon and nitrogen content. Sample size varied between taxa (from 1 to 52), with an average of 11.72 individuals sampled per species, and water depths ranged from 57 to 516 m. The gut contents of 1026 fish belonging to ten commercially important species: black anglerfish (Lophius budegassa), white anglerfish (Lophius piscatorius), blue whiting (Micromesistius poutassou), cod (Gadus morhua), haddock (Melanogrammus aeglefinus), hake (Merluccius merluccius), megrim (Lepidorhombus whiffiagonis), plaice (Pleuronectes platessa), sole (Solea solea) and whiting (Merlangius merlangus) were analyzed. The stomach content data set contains the occurrence of prey in stomach, identified to the lowest taxonomic level possible. To consider potential ontogenetic diet changes, a large size range was sampled. The TrophicCS data set was used to improve understanding of trophic relationships and ecosystem functioning in the Celtic Sea. When you use the data in your publication, we request that you cite this data paper. If you use the present data set (TrophicCS) for the majority of the data analyzed in your study, you may wish to consider inviting at least one author of the core team of this data paper to become a collaborator /coauthor of your paper.
-
The GEBCO_2022 Grid is a global continuous terrain model for ocean and land with a spatial resolution of 15 arc seconds. In regions outside of the Arctic Ocean area, the grid uses as a base Version 2.4 of the SRTM15_plus data set (Tozer, B. et al, 2019). This data set is a fusion of land topography with measured and estimated seafloor topography. Included on top of this base grid are gridded bathymetric data sets developed by the four Regional Centers of The Nippon Foundation-GEBCO Seabed 2030 Project. The GEBCO_2022 Grid represents all data within the 2022 compilation. The compilation of the GEBCO_2022 Grid was carried out at the Seabed 2030 Global Center, hosted at the National Oceanography Centre, UK, with the aim of producing a seamless global terrain model. Outside of Polar regions, the Regional Centers provide their data sets as sparse grids i.e. only grid cells that contain data are populated. These data sets were included on to the base using a remove-restore blending procedure. This is a two-stage process of computing the difference between the new data and the base grid and then gridding the difference and adding the difference back to the existing base grid. The aim is to achieve a smooth transition between the new and base data sets with the minimum of perturbation of the existing base data set. The data sets supplied in the form of complete grids (primarily areas north of 60N and south of 50S) were included using feather blending techniques from GlobalMapper software. The GEBCO_2022 Grid has been developed through the Nippon Foundation-GEBCO Seabed 2030 Project. This is a collaborative project between the Nippon Foundation of Japan and the General Bathymetric Chart of the Oceans (GEBCO). It aims to bring together all available bathymetric data to produce the definitive map of the world ocean floor by 2030 and make it available to all. Funded by the Nippon Foundation, the four Seabed 2030 Regional Centers include the Southern Ocean - hosted at the Alfred Wegener Institute, Germany; South and West Pacific Ocean - hosted at the National Institute of Water and Atmospheric Research, New Zealand; Atlantic and Indian Oceans - hosted at the Lamont-Doherty Earth Observatory, Columbia University, USA; Arctic and North Pacific Oceans - hosted at Stockholm University, Sweden and the Center for Coastal and Ocean Mapping at the University of New Hampshire, USA.
-
This dataset consists of metatranscriptomic sequencing reads corresponding to coastal micro-eukaryote communities sampled in Western Europe in 2018 and 2019.
-

Raw reads for the assembly of Gambusia holbrooki genome.
-
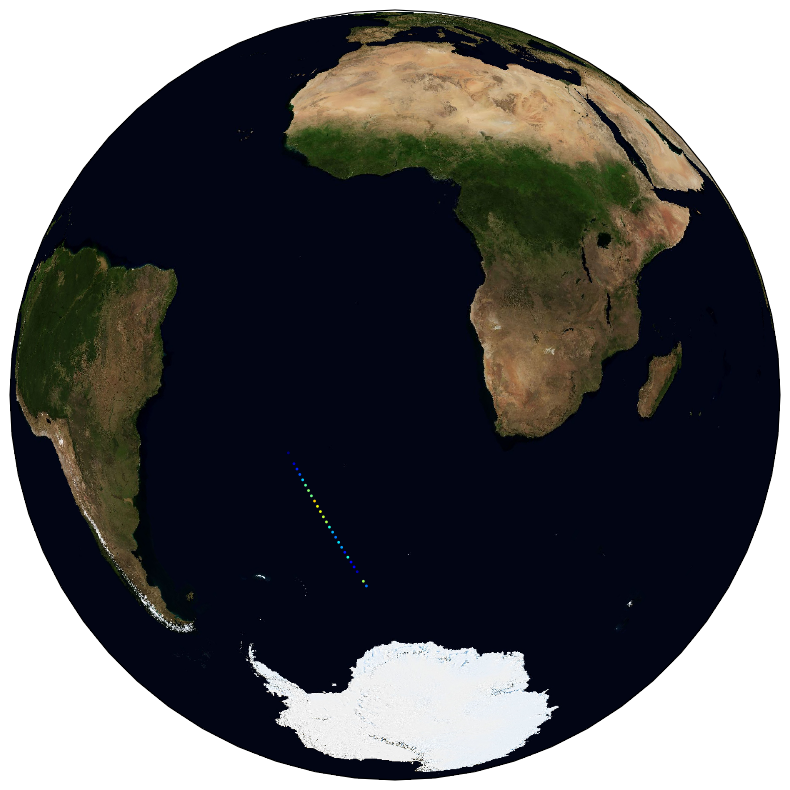
The ESA Sea State Climate Change Initiative (CCI) project has produced global multi-sensor time-series of along-track satellite synthetic aperture radar (SAR) integrated sea state parameters (ISSP) data from Sentinel-1 (referred to as SAR WV onboard Sentinel-1 Level 2P (L2P) ISSP data) with a particular focus for use in climate studies. This dataset contains the Sentinel-1 SAR Remote Sensing Integrated Sea State Parameter product (v1.0), which forms part of the ESA Sea State CCI version 3.0 release. This product provides along-track primary significant wave height measurements and secondary sea state parameters, calibrated with CMEMS model data and reference in situ measurements at 20km resolution every 100km, processed using the Pleskachevsky et. al., 2021 emprical model, separated per satellite and pass, including all measurements with flags and uncertainty estimates. These are expert products with rich content and no data loss. The SAR Wave Mode data used in the Sea State CCI SAR WV onboard Sentinel-1 Level 2P (L2P) ISSP v3 dataset come from the Sentinel-1 satellite missions spanning from 2014 to 2021 (Sentinel-1 A, Sentinel-1 B).
-
The SARWAVE project is developing a new sea state processor from SAR images to be applied over open ocean, sea ice, and coastal areas, and exploring potential synergy with other microwave and optical EO products.
-
French benthic invertebrates composition and abundance taxa data are collected during monitoring surveys on the English Channel / Bay of Biscay coasts and Mediterranean coast (Quadrige program code : REBENT_FAU, RSL_FAU). Protocols are implemented in the Water Framework Directive. Data are transmitted in a Seadatanet format (CDI + ODV) to EMODnet Biology european database. 498 ODV files have been generated from period 01/01/2003 to 31/12/2021.
-
New results acquired in south-Brittany (MD08-3204 CQ core: Bay of Quiberon and VK03-58bis core: south Glénan islands) allow depicting Holocene paleoenvironmental changes from 8.5 ka BP to present through a multi-proxy dataset including sedimentological and palynological data. First, grain-size analyses and AMS-14C dates highlight a common sedimentary history for both study cores. The relative sea level (RSL) slowdown was accompanied by a significant drop of the sedimentation rates between ca. 8.3 and 5.7 ka BP, after being relatively higher at the onset of the Holocene. This interval led to the establishment of a shell-condensed level, identified in core VK03-58bis by the “Turritella layer” and interpreted as a marker for the maximum flooding surface. Palynological data (pollen grains and dinoflagellate cyst assemblages) acquired in core MD08-3204 CQ argue for an amplification of the fluvial influence since 5.7 ka BP; the establishment of the highstand system tract (i.e., mixed marine and fluviatile influences on the platform) then accompanying the slowdown of the RSL rise-rates. On the shelf, the amplification of Anthropogenic Pollen Indicators (API) is then better detected since 4.2 ka BP, not only due to human impact increase but also due to a stronger fluvial influence on the shelf during the Late Holocene. Palynological data, recorded on the 8.5–8.3 ka BP interval along an inshore-offshore gradient, also demonstrate the complexity of the palynological signal such as i) the fluvial influence that promotes some pollinic taxa (i.e., Corylus, Alnus) from proximal areas and ii) the macro-regionalization of palynomorph sources in distal cores. In addition, the comparison of palynological tracers, including API, over the last 7 kyrs, with south-Brittany coastal and mid-shelf sites subjected to northern vs. southern Loire catchment areas, allowed discussing a major hydro-climatic effect on the reconstructed palynological signals. Strengthened subpolar gyre dynamics (SPG), combined with recurrent positive North Atlantic Oscillation (NAO) configurations, appear responsible for increased winter precipitations and fluvial discharges over northern Europe, such as in Brittany. Conversely, weakened SPG intervals, associated with negative NAO-like modes, are characterized by intensified winter fluvial discharges over southern Europe. Interestingly, we record, at an infra-orbital timescale, major peaks of API during periods of strengthened (/weakened) SPG dynamics in sites subjects to Brittany watersheds (/Loire watersheds) inputs.
-
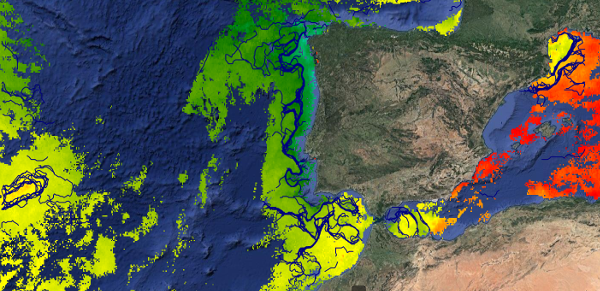
This dataset provides detections of fronts derived from high resolution remote sensing SST observations by SEVIRI L3C from OSISAF over Western Europe region. The data are available through HTTP and FTP; access to the data is free and open. In order to be informed about changes and to help us keep track of data usage, we encourage users to register at: https://forms.ifremer.fr/lops-siam/access-to-esa-world-ocean-circulation-project-data/ This dataset was generated by OceanDataLab and is distributed by Ifremer / CERSAT in the frame of the World Ocean Circulation (WOC) project funded by the European Space Agency (ESA).