Catalogue PIGMA
CSV
Type of resources
Available actions
Topics
Keywords
Contact for the resource
Provided by
Years
Formats
Representation types
Update frequencies
status
Scale
Resolution
-
The ICES Working Group on Fisheries Benthic Impact and Trade-offs (WGFBIT) has developed an assessment framework based on the life history trait longevity, to evaluate the benthic impact of fisheries at the regional scale. In order to apply this framework to the Mediterranean sea, several Mediterranean longevity databases were merged together with existing North-East Atlantic ones to develop a common database. Longevity was fuzzy coded into four longevity classes: <1, 1-3, 3-10 and >10 years. Both benthic mega and macrofauna organisms are included in this dataset. Further details about both the purpose and the methodology may be found in ICES (2022) and Cuyvers et al. (2023). The result of the final dataset merging is one dataset containing the fuzzy coded average longevity (and standard deviation) for 2264 taxa and for each, the number of databases used.
-
The dataset includes age- and length-based catch per unit effort data for commercial fish species collected by the French trawl survey EVHOE.
-
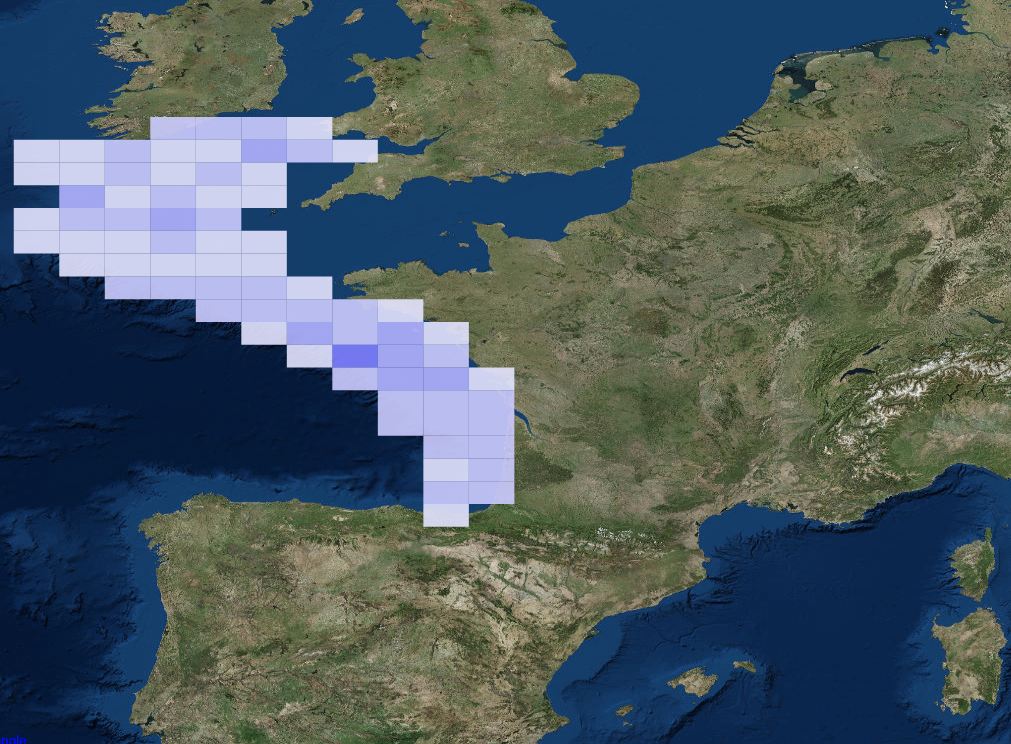
Understanding the dynamics of species interactions for food (prey-predator, competition for resources) and the functioning of trophic networks (dependence on trophic pathways, food chain flows, etc.) has become a thriving ecological research field in recent decades. This empirical knowledge is then used to develop population and ecosystem modelling approaches to support ecosystem-based management. The TrophicCS data set offers spatialized trophic information on a large spatial scale (the entire Celtic Sea continental shelf and upper slope) for a wide range of species. It combines ingested prey (gut content analysis) and a more integrated indicator of food sources (stable isotope analysis). A total of 1337 samples of large epifaunal invertebrates (bivalve mollusks and decapod crustaceans), zooplankton, fish and cephalopods, corresponding to 114 species, were collected and analyzed for stable isotope analysis of their carbon and nitrogen content. Sample size varied between taxa (from 1 to 52), with an average of 11.72 individuals sampled per species, and water depths ranged from 57 to 516 m. The gut contents of 1026 fish belonging to ten commercially important species: black anglerfish (Lophius budegassa), white anglerfish (Lophius piscatorius), blue whiting (Micromesistius poutassou), cod (Gadus morhua), haddock (Melanogrammus aeglefinus), hake (Merluccius merluccius), megrim (Lepidorhombus whiffiagonis), plaice (Pleuronectes platessa), sole (Solea solea) and whiting (Merlangius merlangus) were analyzed. The stomach content data set contains the occurrence of prey in stomach, identified to the lowest taxonomic level possible. To consider potential ontogenetic diet changes, a large size range was sampled. The TrophicCS data set was used to improve understanding of trophic relationships and ecosystem functioning in the Celtic Sea. When you use the data in your publication, we request that you cite this data paper. If you use the present data set (TrophicCS) for the majority of the data analyzed in your study, you may wish to consider inviting at least one author of the core team of this data paper to become a collaborator /coauthor of your paper.
-
EVHOE (« Evaluation Halieutique de l’Ouest Européen ») surveys provide observational data on bentho-demersal communities on the continental shelves of the Bay of Biscay and the Celtic Sea for more than 30 years. The surveys operate a standardized bottom trawling gear and are conducted from 15 to 600 m depth, usually in the fourth quarter of the year, starting at the end of October. The main objectives are the monitoring of 22 commercial stocks of fish species and 10 cephalopods from the North-East Atlantic. The dataset also provide a description of regional diversity, including 250 taxa of fish, 45 taxa of cephalopods and others “commercial” invertebrates and, from 2008, more than 350 other taxa of benthic invertebrates. The acquisition of this dataset, organised by IFREMER, is steered by the IBTS working group organised within the framework of ICES. It is being funded by the European DCMAP programme, in coordination with the French Directorate-General for Maritime Affairs, Fisheries and Aquaculture (DGAMPA). This dataset is of great interest for the long-term monitoring of the continental shelves of the Bay of Biscay and the Celtic Sea. Moreover, on a larger scale, by being integrated into a European network of bottom trawl surveys, these data play an essential role in studying the evolution of ecosystems from continental shelves to the scale of the eastern North Atlantic. From April 2025, the proposed data have been updated in the latest standard format recognised by IFREMER (‘ELFIC’ format). The 5 data tables are compiled in a .zip file which also contains a document detailing the content of each table and their respective data fields.
-
Bivalves carbon and nitrogen elemental and isotopic ratios (δ13C, δ15N, C and N%, C:N) times series (1981-2021) from 33 sites in France. Bivalve species are the Pacific oyster Crassostrea gigas, and the mussels Mytilus edulis and Mytilus galloprovincialis. This extensive dataset offers a comprehensive view spanning multiple decades and ecosystems, allowing to track how coastal ecosystems and marine species record changing climate, physical-chemical environments and organic matter cycles. This dataset may also be used to study bivalve physiology. Additionally, these data are crucial for establishing isotope baselines for studying food webs. Ultimately, this data set provide valuable information for more effective ecosystem conservation and management strategies in our rapidly changing world.
-

In October 2019 we chose 15 sites from the 2019 EVHOE survey for environmental DNA (eDNA) sampling. The French international EVHOE bottom trawl survey is carried out annually during autumn in the BoB to monitor demersal fish resources. At each site, we sampled seawater using Niskin bottles deployed with a circular rosette. There were nine bottles on the rosette, each of them able to hold ∼5 l of water. At each site, we first cleaned the circular rosette and bottles with freshwater, then lowered the rosette (with bottles open) to 5 m above the sea bottom, and finally closed the bottles remotely from the boat. The 45 l of sampled water was transferred to four disposable and sterilized plastic bags of 11.25 l each to perform the filtration on-board in a laboratory dedicated to the processing of eDNA samples. To speed up the filtration process, we used two identical filtration devices, each composed of an Athena® peristaltic pump (Proactive Environmental Products LLC, Bradenton, Florida, USA; nominal flow of 1.0 l min–1 ), a VigiDNA 0.20 μm filtration capsule (SPYGEN, le Bourget du Lac, France), and disposable sterile tubing. Each filtration device filtered the water contained in two plastic bags (22.5 l), which represent two replicates per sampling site. We followed a rigorous protocol to avoid contamination during fieldwork, using disposable gloves and single-use filtration equipment and plastic bags to process each water sample. At the end of each filtration, we emptied the water inside the capsule that we replaced by 80 ml of CL1 conservation buffer and stored the samples at room temperature following the specifications of the manufacturer (SPYGEN, Le Bourget du Lac, France). We processed the eDNA capsules at SPYGEN, following the protocol proposed by Polanco-Fernández et al., (2020). Half of the extracted DNA was processed by Sinsoma using newly developped ddPCR assays for European seabass (Dicentrachus labrax), European hake (Merluccius merluccius) and blackspot seabream (Pagellus bogaraveo). The other half of the extracted DNA was analysed using metabarcoding with teleo primer. The raw metabarcoding data set is available at https://www.doi.org/10.16904/envidat.442 Bottom trawling using a GOV trawl was carried out before or after water sampling. The catch was sorted by species and catches in numbers and weight were recorded. No blackspot seabream individuals were caught. Data content: * ddPCR/: contains the ddPCR counts and DNA concentrations for each sample and species. * SampleInfo/: contains the filter volume for each eDNA sample. * StationInfo/: contains metadata related to the data collected in the field for each filter. * Metabarcoding/: contains metabarcoding results for teleoprimer. * Trawldata/: contains catch data in numbers and weight (kg).
-
The PHYTOBS-MARCOBOLO dataset comprises long-term time series on marine microphytoplankton, from 2003 to 2021, along the entire French metropolitan coastline. Microphytoplankton data cover microscopic taxonomic identifications and counts. The PHYTOBS-MARCOBOLO dataset corresponds to a dataset extracted from the PHYTOBS network (DOI:10.17882/85178). The PHYTOBS network provides the scientific community and stakeholders with validated and qualified data on the biomass, abundance and composition of marine microphytoplankton in coastal and lagoon waters, with the aim of supporting scientific research. PHYTOBS-MARCOBOLO is a dataset used as part of the Horizon Europe MARCO-BOLO project (https://marcobolo-project.eu/), in which we are currently working to understand and analyze multi-decadal trends in coastal and marine biodiversity on a European scale. The PHYTOBS-MARCOBOLO dataset gathers data from 18 sampling sites, selected from the PHYTOBS-Network dataset according to requirements of time series quality and geographical location of sampling sites established as part of the MARCO-COLO project. This dataset was also formatted according to a template imposed for the European project.
-

The Commission for the Conservation Southern Bluefin Tuna collects a variety of data types from its Members and Cooperating Non-Members, including total catch, catch and effort data, and catch at size data. Catch, size and trade information is also collected through the Commission's Catch Documentation Scheme, Japanese import statistics, and other monitoring programs. Annual catches provided on this page are reported on a calendar year basis. CCSBT Members use quota years (not calendar years) for managing catching limits, but quota years differ between Members, so calendar years are used to provide catches on a common timescale. Relevant subsets and summaries of these data are provided below. All figures are subject to change as improved data or estimates become available. In particular, reviews of SBT data in 2006 indicated that southern bluefin tuna catches may have been substantially under-reported over the previous 10-20 years and the data presented here do not include estimates for this unreported catch. Also, data for the last reported year of catch (2020) are preliminary and are subject to revision. Any latitudes and longitudes presented in these summaries represent the north western corner of the relevant grid, which is a 5*5 grid unless otherwise specified. Other information on Members and Cooperating Non-Members fishing activities appears in the reports of the Extended Scientific Committee, Compliance Committee and Extended Commission.
-
Diet and stable isotopes of the European eel (Anguilla anguilla L.) in six northern France estuaries
The diet and stable isotopic (i.e. δ15N and δ13C values) compositions of eels have been studied during each season of 2019 with a fyke net in six estuaries located along the French coast of the eastern English Channel (Slack, Wimereux, Liane, Canche, Authie and Somme estuaries) (10.1371/journal.pone.0270348).
-