From 1 - 10 / 19
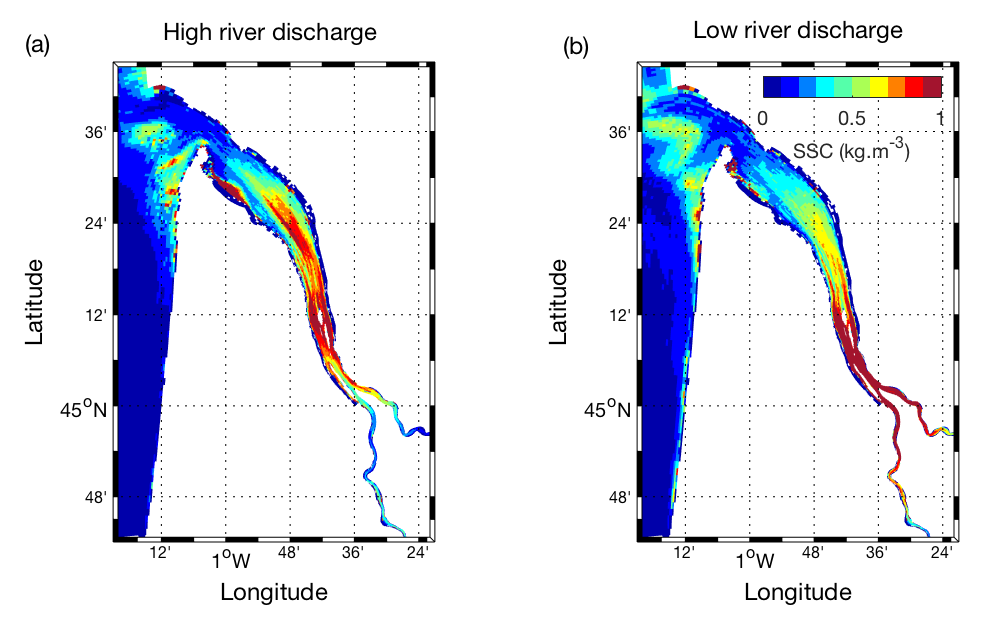
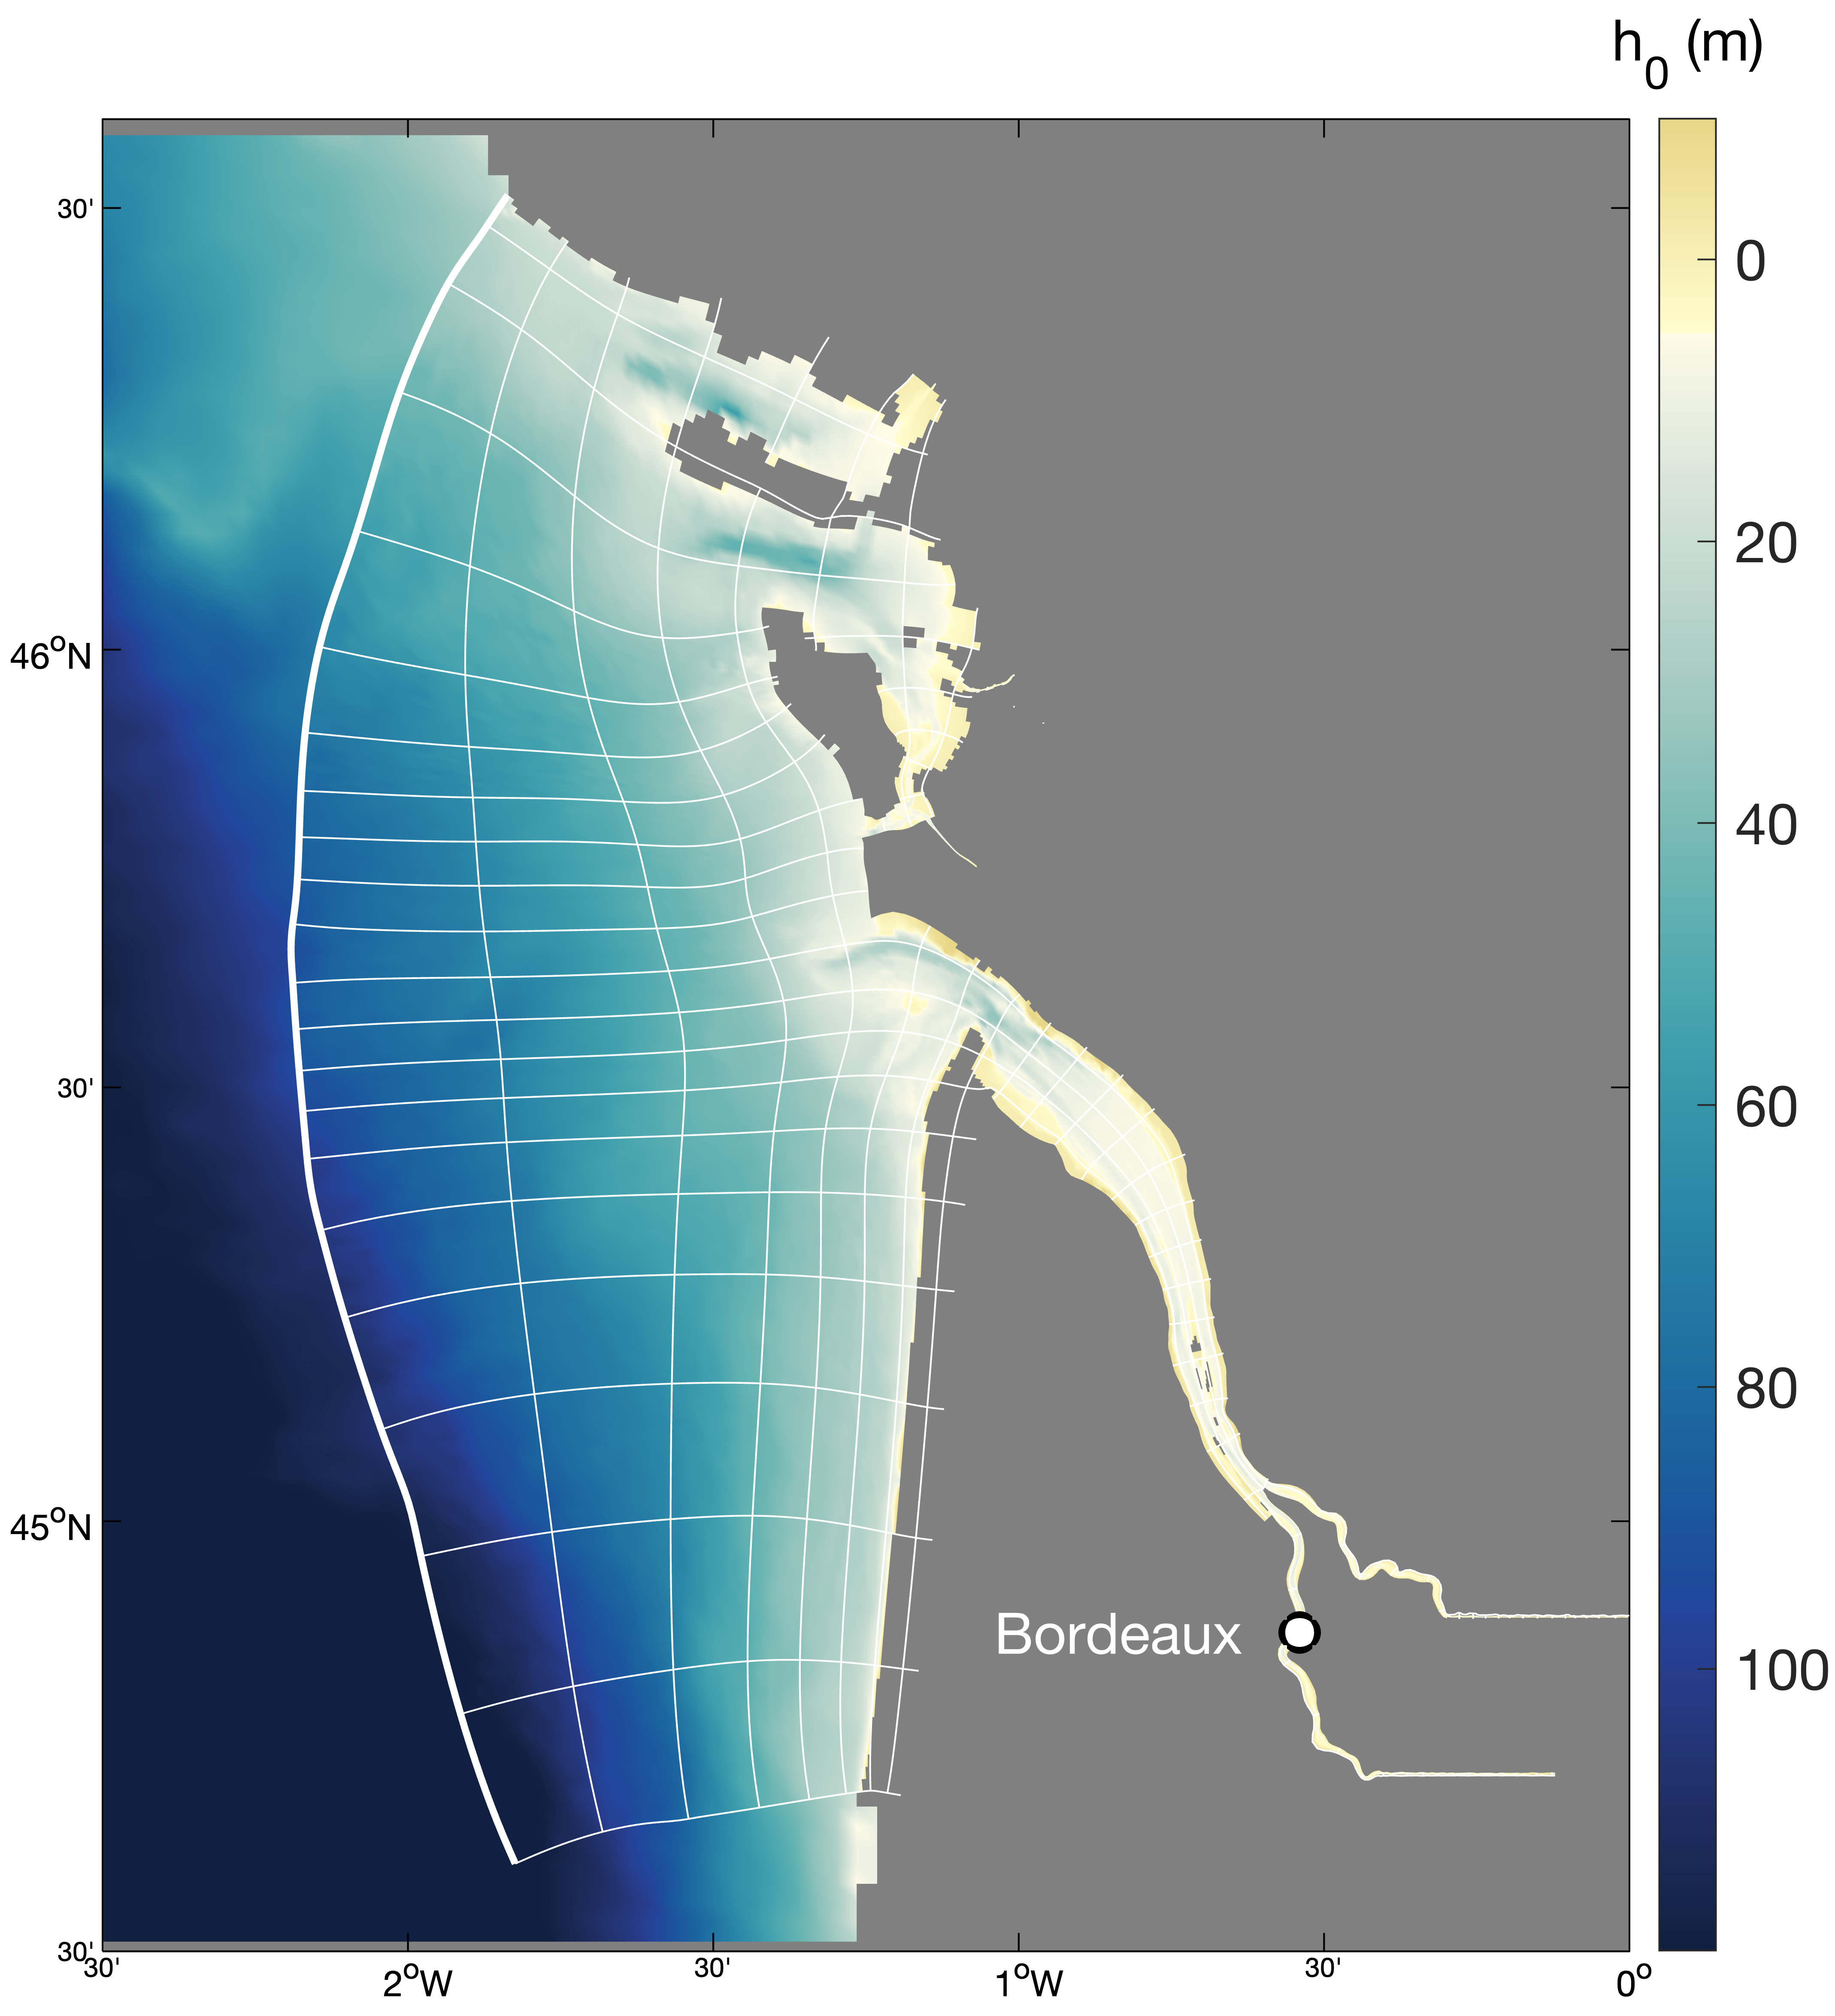
  • Hydrodynamics and sediment dynamics hindcast in the Gironde Estuary (France), produced by coupling the hydrodynamics model MARS3D (with sediment dynamics module MUSTANG) and wave spectral model WAVEWATCH III®.

  • A ten-year numerical hindcast of hydrodynamics, hydrology and sediment dynamics in the Loire Estuary (France), produced by coupling the hydrodynamics model MARS3D with the sediment dynamics module MUSTANG and the wave spectral model WAVEWATCH III®. Numerical simulations are based on the same model chain used in the Seine Estuary (curviseine) and the Gironde Estuary (curvigironde).

  • Hydrodynamic and sediment transport simulations in the Gironde Estuary and the adjacent continental shelf based on MARS3D-MUSTANG model using curvilinear mesh grid, 2015 realistic forcing and hourly output time steps

  • This product contains data in a grid form with all the digital files of the SHOM relating to tides of the Metropolitan French coast in the English Channel and the Atlantic coast. These digital files indicate the components of the tidal surface, hour by hour and for two tidal coefficient characteristics (45 and 95). The current points contained in the files correspond to the arrows shown in the currents atlas.

  • This annual statistics at 500m horizontal resolution was produced from the archived time series of MARS 3D physics model hindcast runs along French Atlantic Coast. The variable that is available here is the Salinity. Values are expressed in psu. The vertical level is the sea surface.

  • This annual statistics at 500m horizontal resolution was produced from the archived time series of MARS 3D physics model hindcast runs along French Atlantic Coast. The variable that is available here is the Temperature. Values are expressed in Celsius Degrees. The vertical level is the sea surface.

  • This annual statistics at 500m horizontal resolution was produced from the archived time series of MARS 3D physics model hindcast runs along French Atlantic Coast. The variable that is available here is the Temperature. Values are expressed in Celcius degrees. The vertical level is the seabed.

  • This annual statistics at 500m horizontal resolution was produced from the archived time series of MARS 3D physics model hindcast runs along French Atlantic Coast. The variable that is available here is the Kinetic Energy induced by currents caused by tide, water density gradients and action of winds. The formula used for the Kinetic Energy calculation is 0.5mv², where m is the density of seawater (1027 kg.m-3) and v is the current-induced velocity. Values are expressed in N.m-2 (Newton per square meter). In each pixel the value is an average of the values of the 40 vertical levels that are considered in the model.

  • This annual statistics at 500m horizontal resolution was produced from the archived time series of MARS 3D physics model hindcast runs along French Atlantic Coast. The variable that is available here is the Kinetic Energy induced by currents caused by tide, water density gradients and action of winds. The formula used for the Kinetic Energy calculation is 0.5mv², where m is the density of seawater (1027 kg.m-3) and v is the current-induced velocity. Values are expressed in N.m-2 (Newton per square meter). The vertical level is the seabed.

  • This annual statistics at 500m horizontal resolution was produced from the archived time series of MARS 3D physics model hindcast runs along French Atlantic Coast. The variable that is available here is the Salinity. Values are expressed in psu. The vertical level is the seabed.