From 1 - 4 / 4
  • The anchovy (Engraulis encrasicolus) and sardine (Sardina pilchardus) populations in the Bay of Biscay are jointly surveyed each year in May since 2000 and in September since 2003 by means of acoustic surveys. The integrated survey PELGAS (Doray et al., 2018) is run in May by France and covers the French shelf of the Bay of Biscay. Its objectives are to monitor the Bay of Biscay pelagic ecosystem in springtime and assess the biomass of its small pelagic fish species, including sardine and anchovy. Amongst many information on the ecosystem, the survey PELGAS provides knowledge on the adults of anchovy and sardine during their spawning in spring. The survey JUVENA (Boyra et al., 2013) is run in September by Spain. It has a larger spatial coverage than PELGAS, including part of the Spanish coast and open ocean outside the shelf because it targets juvenile anchovy. It also provides knowledge on sardine as well as other pelagic species. Both surveys are coordinated by the ICES Working Group on Acoustic and Egg Surveys for Small Pelagic Fish (WGACEGG), together with other pelagic surveys in ICES areas 7, 8 and 9. Survey protocoles are detailed in Doray et al. (2021). Briefly, fish backscatter data are recorded along the survey transect lines and pelagic trawl hauls are undertaken opportunistically to identify the echotraces to species and collect fish samples for biometric data. The trawl haul catches have provided the anchovy and sardine length data, from which the maps presented here are derived. At each trawl haul, the catch is sorted by species and weighted. A subsample by species is measured to estimate the species’ length distribution. The four maps presented here correspond to the average maps of anchovy and sardine length distributions in May and September, derived from the PELGAS and JUVENA trawl haul data series. The maps were obtained by kriging, following the procedure explained in Petitgas et al. (2011) for mapping functions instead of variables. For each species, the experimental length distribution at each haul was fitted by a linear combination of Legendre polynomials, the coefficients of which were co-kriged. The number of polynomials varied from 15 to 22 depending on the survey and species, with a higher number for sardine and in autumn. The length histogram at each grid node was then deduced from the mapped coefficients. When the length distribution at a given haul was estimated with less than 40 individual fish, the haul was not taken into account for mapping. This threshold defined presence and absence of the species in the haul data sets. The trawl hauls from 2000 to 2019 were pooled for the PELGAS series (1965 stations) and from 2003 to 2020 for JUVENA (852 stations). The mapping was performed on the same grid for both PELGAS and JUVENA and both species, and with similar moving kriging neighbourhoods. The grid has a mesh size of 0.25 x 0.25 decimal degree square. In addition to mapping the length distribution, presence/absence was mapped for each species by ordinary kriging on the same grid and with the same neighbourhoods as previously. The computations were performed in R (version 4.0.5) with the RGeostats package (version 13.0.1) freely available at http://rgeostats.free.fr. The map data files comprise for each species the following information: the geographical coordinates of the grid points, the probability of presence and the probability of each length class of width 0.5 cm ranging from 2.5 to 27 cm.

  • This dataset comprises energy density and proximal composition (water, ash, lipid and protein contents) for anchovy (Engraulis encrasicolus) and sardine (Sardina pilchardus) from the Bay of Biscay, the English Channel and the southern North Sea between 2014 and 2017. Fish were sampled throughout various seasons thanks to the PELGAS (May, Bay of Biscay), EVHOE (October-November, Bay of Biscay), CGFS and CAMANOC (September-October, English Channel) surveys conducted by IFREMER on the RV “Thalassa”, to the JUVENA (September-October, Bay of Biscay) survey conducted by AZTI, and from commercial landings within the European Data Collection Framework (DCF) during the CAPTAIN project (France Filière Pêche). During the surveys, pelagic (PELGAS and JUVENA) or demersal (EVHOE and CGFS) trawl hauls are undertaken to identify species and measure individual fish traits. Professional sampling was performed from pelagic trawl or purse-seine catches. From the various surveys, a sub-sampling of the trawls was performed to cover as much as possible the spatial extent of the surveys along the french coast. From the various selected trawls, a sub-sampling of 5 fish per size class (when possible) was performed to cover the size range of each species, based on the following size classes : sardine (1 : <15 cm ; 2 : 15-20 cm ; 3 : >20cm), anchovy (1 : <10cm ; 2 : 10-14 cm ; 3 : >14cm). Each fish was individually measured to the nearest tenth of a centimeter and weighted to the nearest tenth of a gram. These measurements were taken either at sea or later in the laboratory. The collected fish were frozen individually at -20°C before laboratory processing. In the laboratory, maturity stages were determined following ICES guidelines (ICES, 2008) based on macroscopic gonads observation and using a six-stage key as follows: stages 1 & 2 indicate immature and developing individuals, stages 3–5 indicate three steps of increasing gonad development and the spawning period (stage 3: partial pre-spawning; stage 4: spawning (hydrated); stage 5: partial post-spawning), and stage 6 features the final post-spawning period. Fish characterised by maturity stages 3, 4 or 5 were considered as being in an active reproductive period as opposed to fish in stages 1, 2 or 6. Fish were then ground and freeze-dried during at least 48 hours. Water content of the entire fish was determined from dry mass and wet mass ratio. Then, fish were ground again to obtain fine homogeneous dry powder for subsequent analysis. Energy density measurements were performed following the protocols of Gatti et al. (2018). Two subsamples of fish powder were placed in an adiabatic bomb calorimeter (IKA C-4000 adiabatic bomb calorimeter, IKA-WerkeGmbh & co. KG) for energy measurements. The energy density (ED, kJ.g-1 dry mass) was determined by measuring the heat released through the combustion of a small subsample, approximately 200 mg. If the coefficient of variation between the two measurements exceeded 3%, a third measurement was made. Finally, ED subsamples measurements were averaged and assigned to each individual fish. Energy density analyses were conducted on 503 individuals for anchovy and 976 individuals for sardine. Ash content was determined gravimetrically by combusting dried tissue in a muffle furnace at 550°C for six hours. Lipids and proteins were analysed by a certified laboratory (Labocea, Plouzané, France). Protein content was estimated using the Kjeldahl method. It consists in first determining the quantity of nitrogen contained in the sample, and to convert it into protein content using a conversion factor (6.25 here). Lipid content was determined by hydrolysis, using petroleum ether as an organic solvent. Carbohydrates represent less than 1% of fish mass and were thus neglected. Protein, lipid and ash content did not exactly sum to 1 in DW (anchovy: mean = 0.91, sd = 0.04; sardine: mean = 0.90, sd = 0.04). This discrepancy may arise from residual water, measurement uncertainties, or to a lesser extent the exclusion of carbohydrates. Body component contents have been normalised by dividing each component by the sum of lipids, proteins and ash content, to sum to one, enabling comparisons between fishes, assuming proportional errors across the components. A total of 116 and 104 proximate composition analyses were performed for anchovy and sardine, respectively.

  • The objective of the PELGAS cruise is to monitor distribution and abundance of pelagic species fished in the Bay of Biscay, using two direct evaluation methods: acoustics and spawning estimates. The cruise was conducted in coordination with France, Spain and Portugal, in the framework of the European council regulations (EC No 1543/2000 of 29 June 2000 and No 1639/2001 of 25 July 2001).

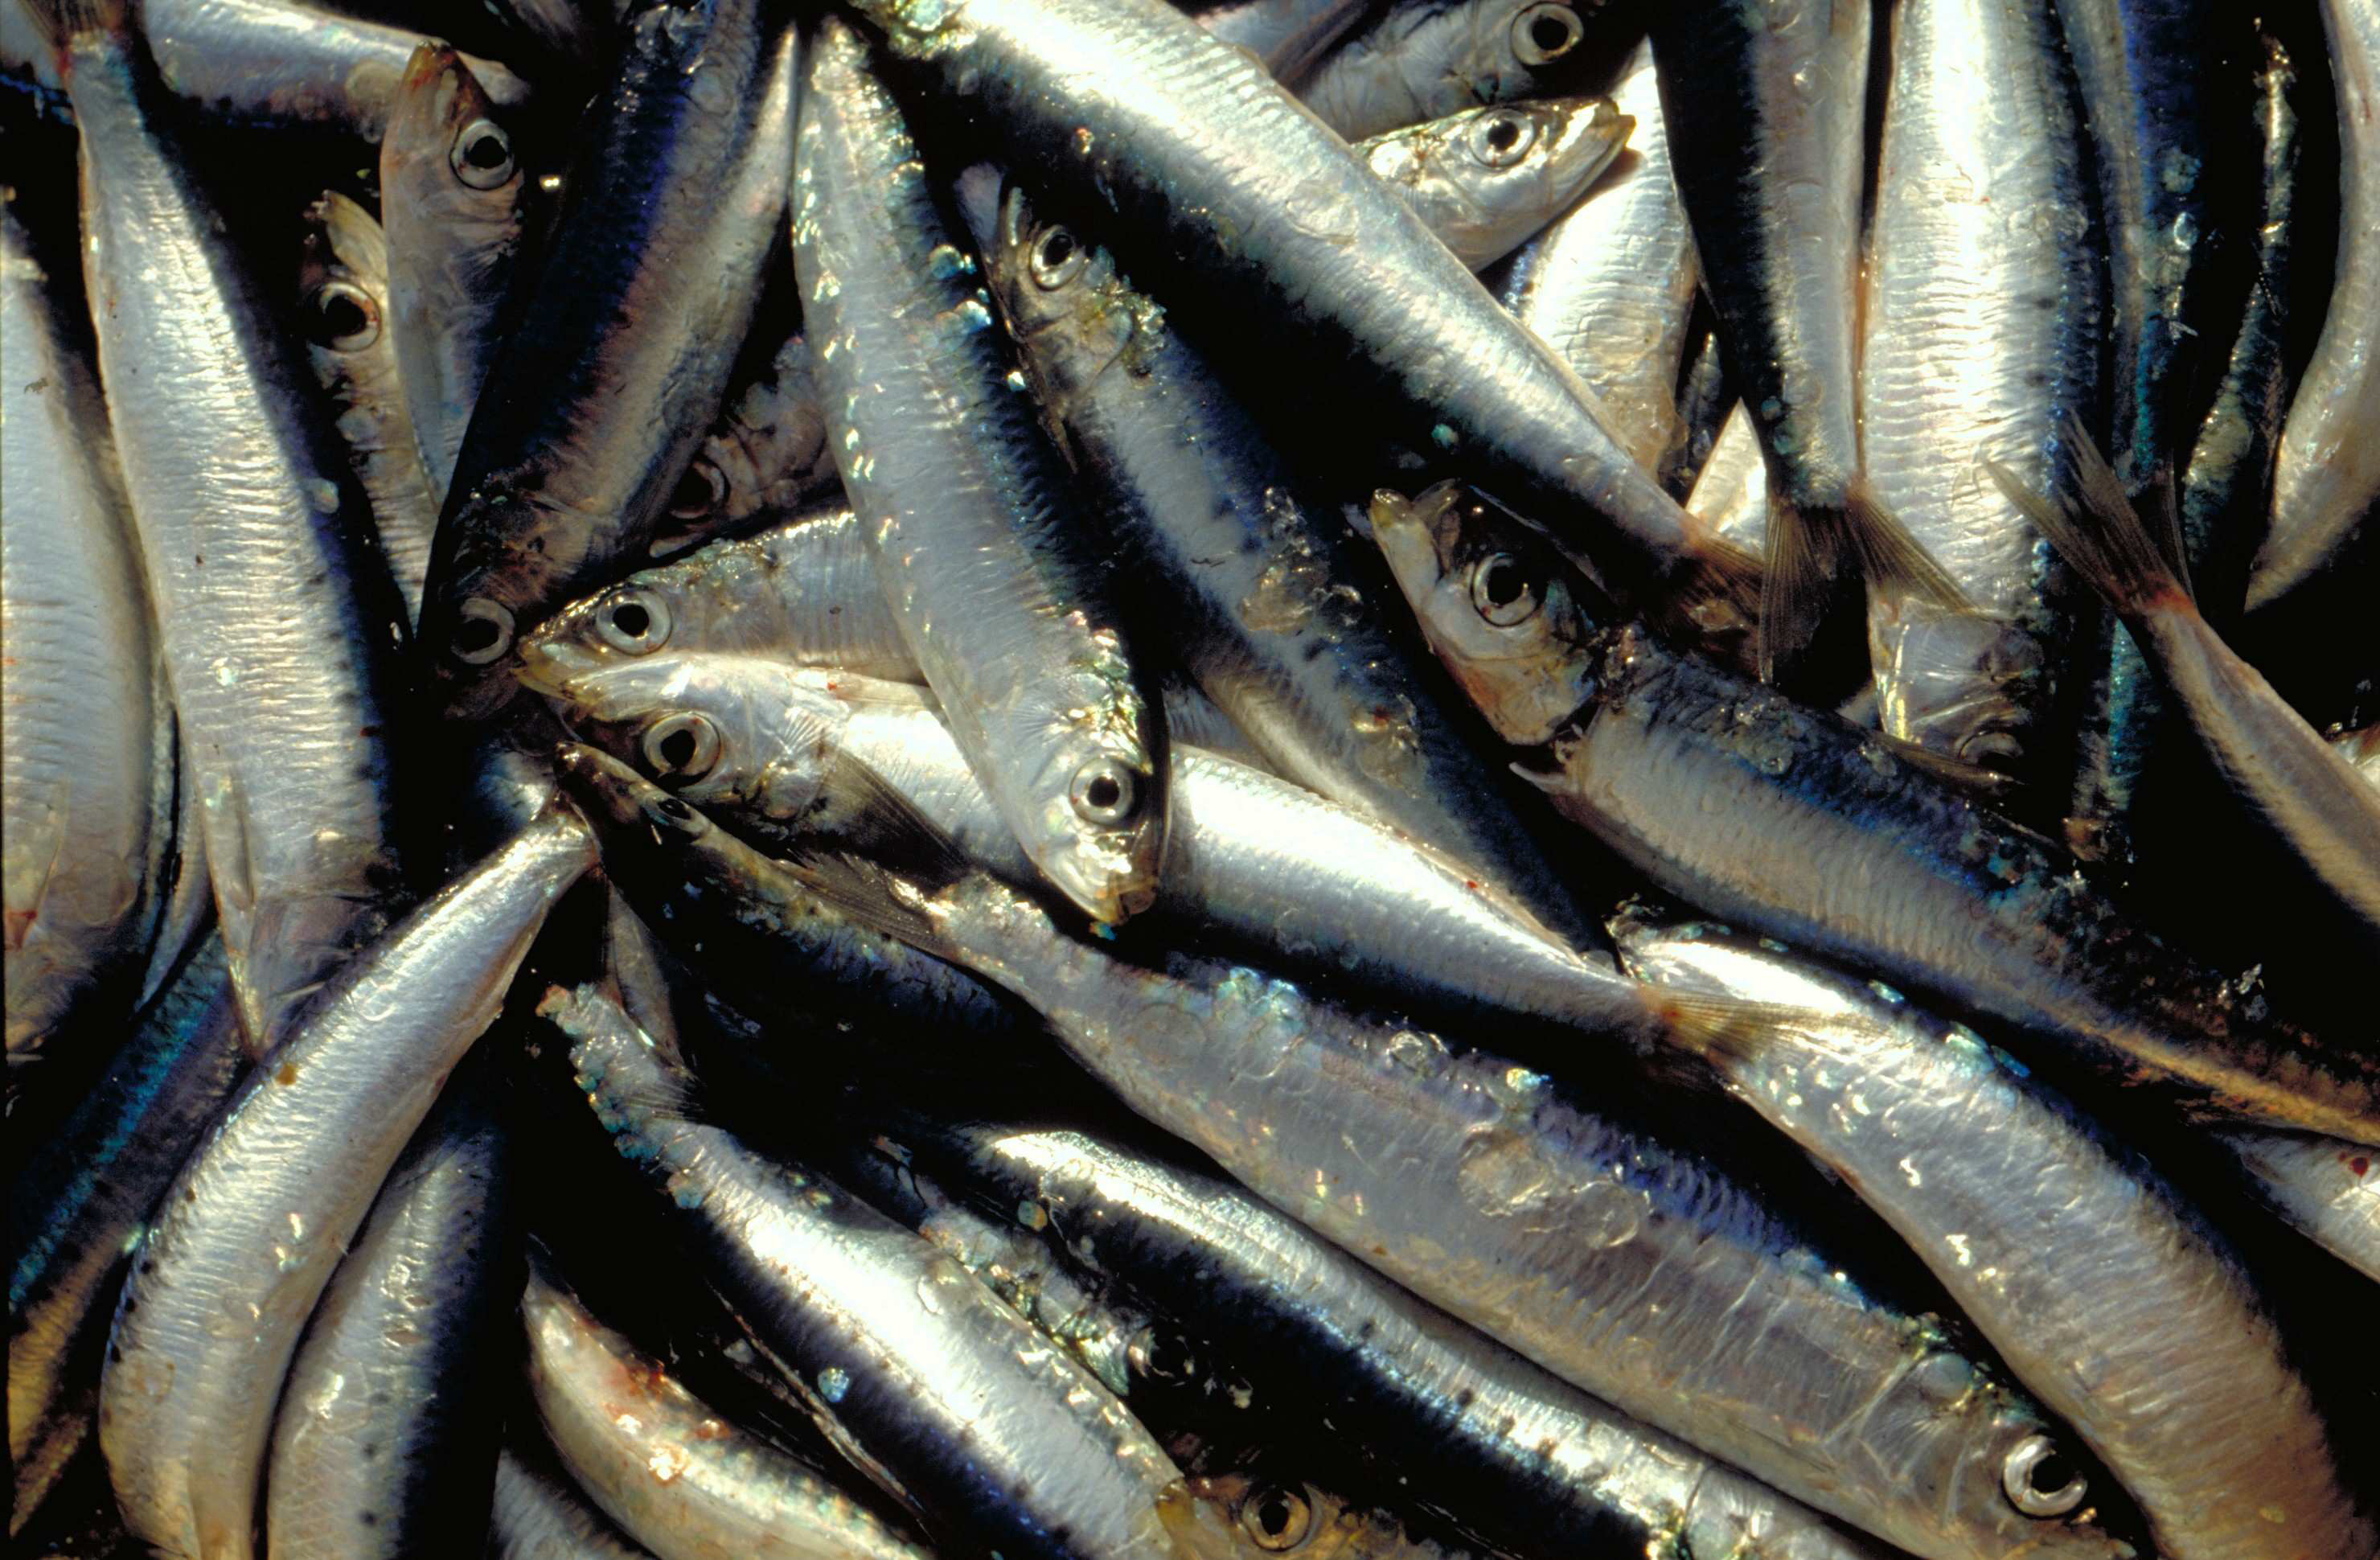
  • The annual PELMED (PELagiques MEDiterranée) fisheries resource assessment campaign is carried out by the Laboratoire Halieutique Méditerranée of the Ifremer station in Sète. The objectives of these cruises are : 1. Evaluate the biomass of small pelagic fish (anchovies, sardines) by direct method. For this, the campaign must alternate between acoustic prospecting and identification trawling. An acoustic signal is sent from a sounder fixed under the vessel and each time it encounters the bottom or schools of fish, it is reflected and retransmitted to the sounder. In this way, the shape and intensity of these echoes that materialize the schools of fish can be observed continuously. Species identification trawls are carried out in order to define the proportion of species present in the echoes detected. 2. Collecting as many biological parameters as possible on the target species of small pelagics (anchovies, sardines, sprats) to better understand the population dynamics of these species. For this purpose, morphometric measurements, as well as the determination of the sex and maturity stage of the fish are carried out. Finally, otoliths are taken in order to determine the age of the fish. These biological parameters are very important to complete the biomass assessment and have a better understanding of the processes underlying the variability of these populations. This allows for example to determine the age structure or size structure of the populations, to have an idea of their energy reserves, etc. 3. To better understand the pelagic ecosystem as a whole, from plankton to top predators. The primary goal of the PELMED cruise is to evaluate small pelagic stocks, but it also aims to accumulate as much data as possible on the different compartments of the pelagic ecosystem, from physical parameters (temperature, salinity) to top predators (marine mammals, birds), through the different lower trophic levels (phyto- and zooplankton, small pelagic fish). Thus, after each trawling, a hydrological station is carried out with the measurement of temperature and salinity along the water column via a CTD, water and phytoplankton samples with a Niskin bottle and zooplankton samples using a vertical line of WP2. Finally, throughout the campaign we carry out the observation and counting of birds and marine mammals. In addition to the understanding of the ecosystem, this should provide a number of indicators necessary for monitoring the marine environment under the MSFD (Marine Framework Directive).