 Catalogue PIGMA
Argo
Type of resources
Available actions
Topics
Keywords
Contact for the resource
Provided by
Years
Formats
Representation types
Update frequencies
status
Scale
-
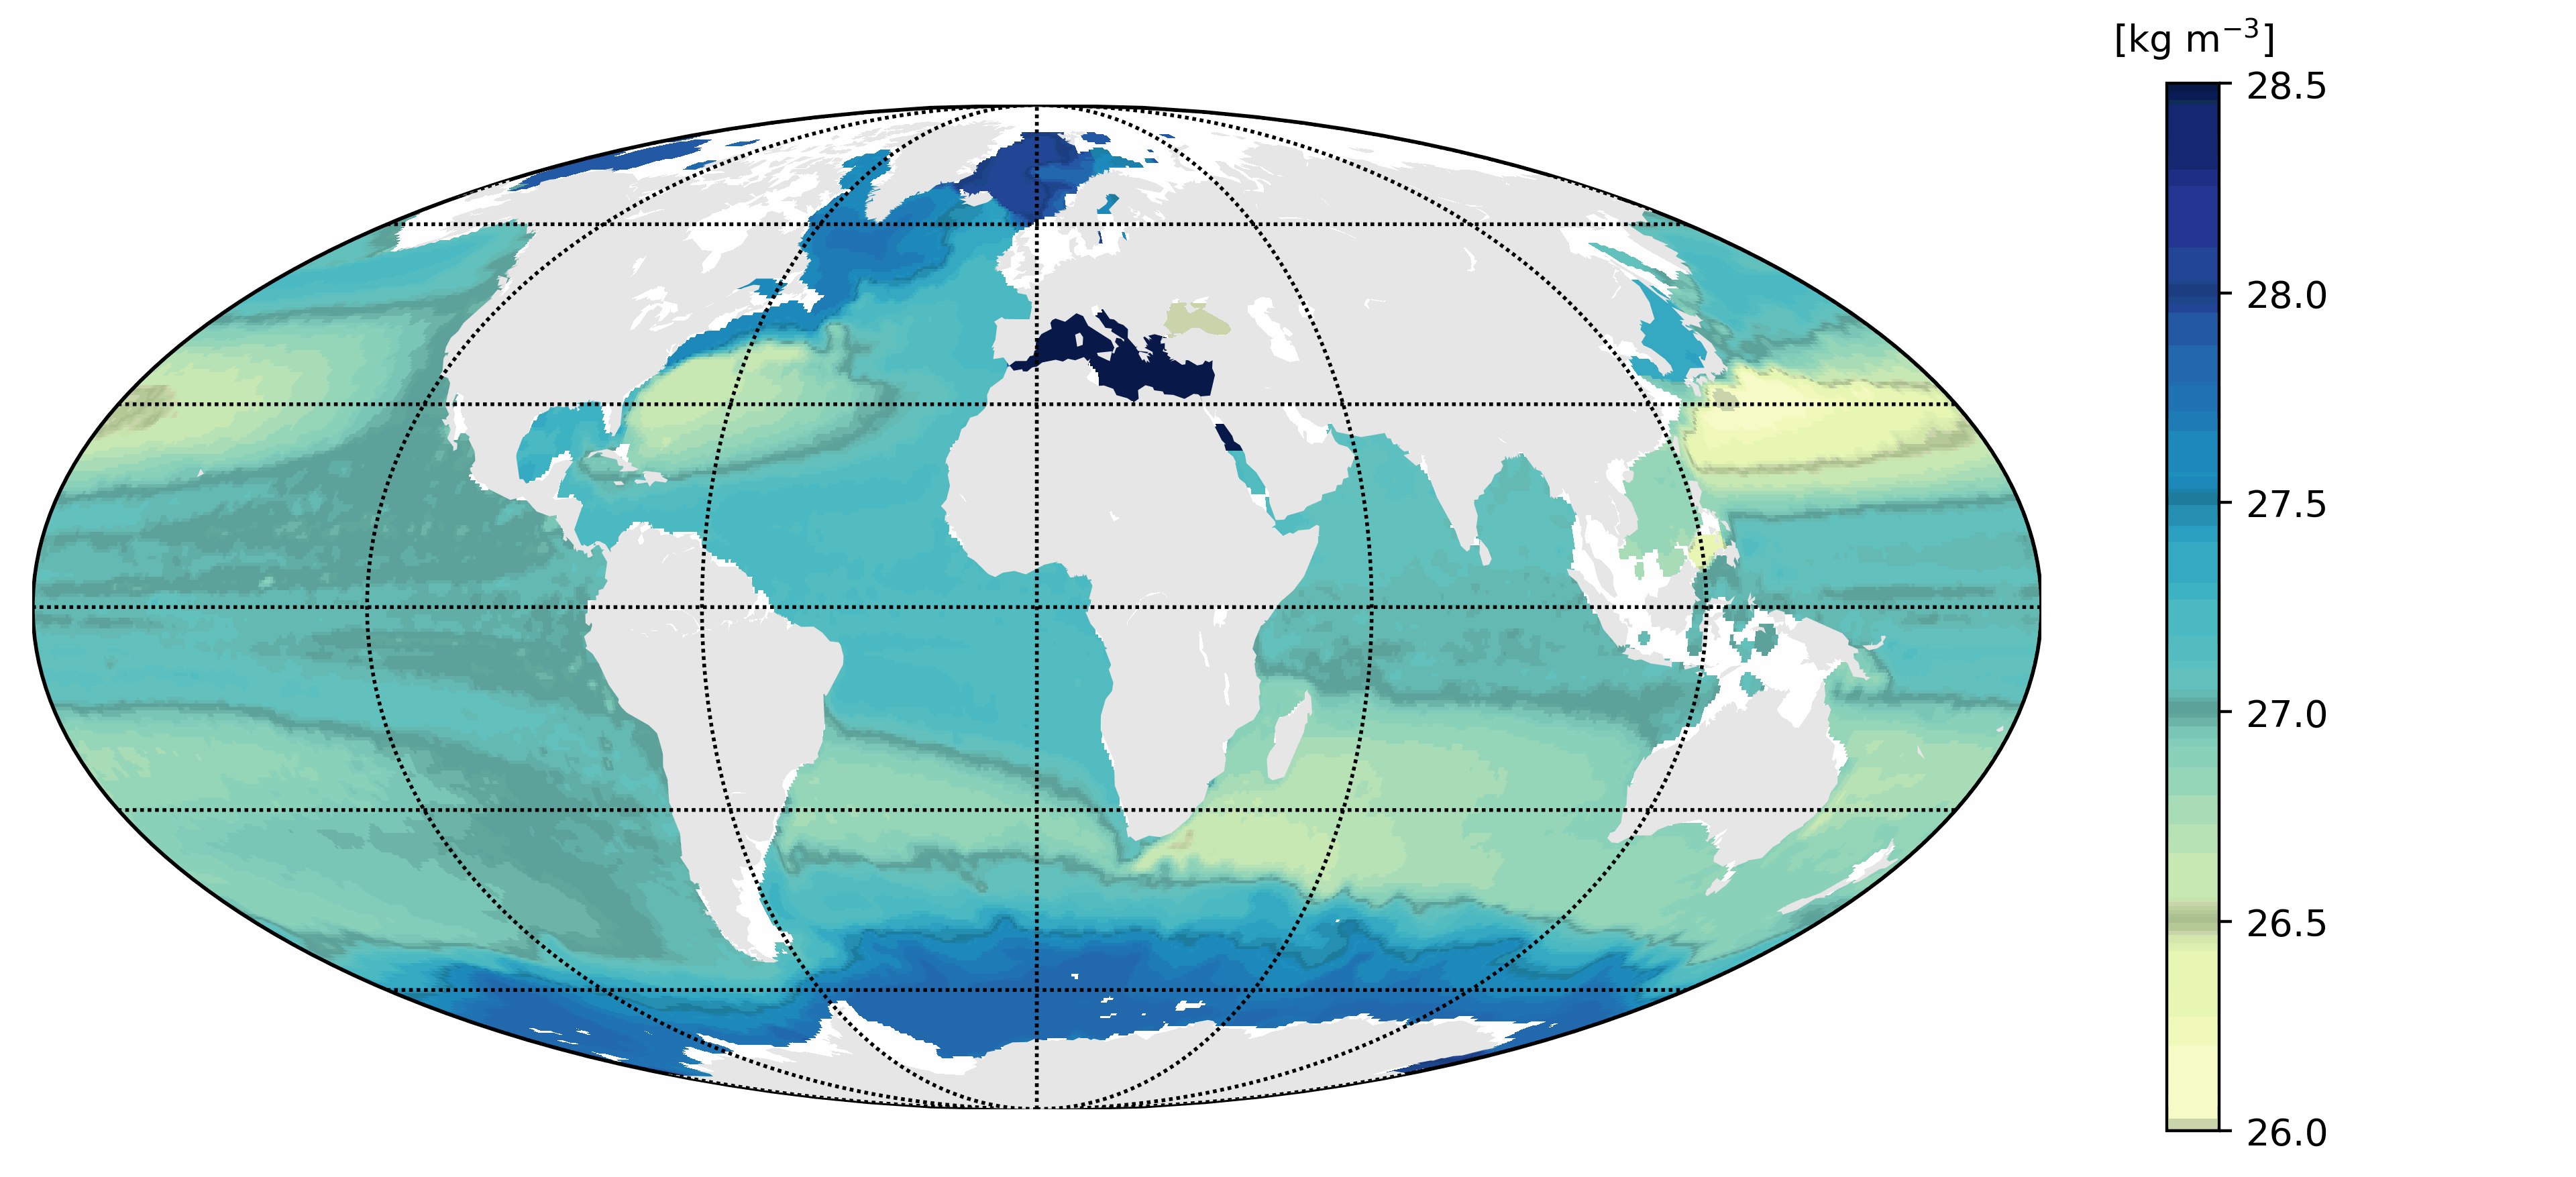
This dataset provides a World Ocean Atlas of Argo inferred statistics. The primary data are exclusively Argo profiles. The statistics are done using the whole time range covered by the Argo data, starting in July 1997. The atlas is provided with a 0.25° resolution in the horizontal and 63 depths from 0 m to 2,000 m in the vertical. The statistics include means of Conservative Temperature (CT), Absolute Salinity, compensated density, compressiblity factor and vertical isopycnal displacement (VID); standard deviations of CT, VID and the squared Brunt Vaisala frequency; skewness and kurtosis of VID; and Eddy Available Potential Energy (EAPE). The compensated density is the product of the in-situ density times the compressibility factor. It generalizes the virtual density used in Roullet et al. (2014). The compressibility factor is defined so as to remove the dependency with pressure of the in-situ density. The compensated density is used in the computation of the VID and the EAPE.
-
This dataset contains OAC-P results from application to Argo data in the World Ocean : - the 2000-2015 climatology of OAC-P results mapped onto a 0.5x0.5 grid with mapping error estimates; - the 2000-2015 probability density function of the permanent pycnocline potential density referenced to the sea surface vs Brunt-Väisälä frequency squared.OAC-P is an "Objective Algorithm for the Characterization of the permanent Pycnocline" developed to characterize subtropical gyre stratification features with both observed and modeled potential density profiles. OAC-P estimates the following properties: - for the permanent pycnocline: depth, upper and lower thicknesses, Brunt-Väisälä frequency squared, potential density, temperature and salinity; - for the surface mode water overlying the permanent pycnocline: depth, Brunt-Väisälä frequency squared, potential density, temperature and salinity. Argo data were download from Coriolis Argo GDAC on February, 8th 2016. Only Argo data with QC=1, 2, 5 or 8 were used.
-

This dataset provides a World Ocean Atlas of Argo inferred statistics. The primary data are exclusively Argo profiles. The statistics are done using the whole time range covered by the Argo data, starting in July 1997. The atlas is provided with a 0.25° resolution in the horizontal and 63 depths from 0 m to 2,000 m in the vertical. The statistics include means of Conservative Temperature (CT), Absolute Salinity, compensated density, compressiblity factor and vertical isopycnal displacement (VID); standard deviations of CT, VID and the squared Brunt Vaisala frequency; skewness and kurtosis of VID; and Eddy Available Potential Energy (EAPE). The compensated density is the product of the in-situ density times the compressibility factor. It generalizes the virtual density used in Roullet et al. (2014). The compressibility factor is defined so as to remove the dependency with pressure of the in-situ density. The compensated density is used in the computation of the VID and the EAPE.
-
10 years of L-Band remote sensing Sea Surface Salinity (SSS) measurements have proven the capability of satellite SSS to resolve large scale to mesoscale SSS features in tropical to subtropical ocean. In mid to high latitude, L-Band measurements still suffer from large scale and time varying biases. Here, a simple method is proposed to mitigate the large scale and time varying biases. First, in order to estimate these biases, an Optimal Interpolation (OI) using a large correlation scale is used to map SMOS and SMAP L3 products and is compared to equivalent mapping of in situ observations. Then, a second mapping is performed on corrected SSS at scale of SMOS/SMAP resolution (~45 km). This procedure allows to correct and merge both products, and to increase signal to noise ratio of the absolute SSS estimates. Using thermodynamic equation of state (TEOS-10), the resulting L4 SSS product is combined with microwave satellite SST products to produce sea surface density and spiciness, useful to fully characterize the surface ocean water masses. The new L4 SSS products is validated against independent in situ measurements from low to high latitudes. The L4 products exhibits a significant improvement in mid-and high latitude in comparison to the existing SMOS and SMAP L3 products. However, in the Arctic Ocean, L-Band SSS retrieval issues such as sea ice contamination and low sensitivity in cold water are still challenging to improve L-Band SSS data.
-
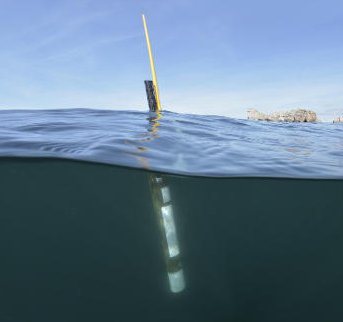
Argo is a global array of 3,000 free-drifting profiling floats that measures the temperature and salinity of the upper 2000 m of the ocean. This allows, for the first time, continuous monitoring of the temperature, salinity, and velocity of the upper ocean, with all data being relayed and made publicly available within hours after collection. The array provides 100,000 temperature/salinity profiles and velocity measurements per year distributed over the global oceans at an average of 3-degree spacing. Some floats provide additional bio-geo parameters such as oxygen or chlorophyll. All data collected by Argo floats are publically available in near real-time via the Global Data Assembly Centers (GDACs) in Brest (France) and Monterey (California) after an automated quality control (QC), and in scientifically quality controlled form, delayed mode data, via the GDACs within six months of collection. The BGC-Argo Sprof snapshot is a subset of the global Argo data snapshot. It is created to ease BGC-Argo data usage. The content is the same if you are to download the global Argo data snapshot, and then select all the BGC-Argo Sprof files. Please use the same DOI and citation as the global Argo data snapshot.
-
Argo is a global array of 3,000 free-drifting profiling floats that measures the temperature and salinity of the upper 2000 m of the ocean. This allows, for the first time, continuous monitoring of the temperature, salinity, and velocity of the upper ocean, with all data being relayed and made publicly available within hours after collection. The array provides 100,000 temperature/salinity profiles and velocity measurements per year distributed over the global oceans at an average of 3-degree spacing. Some floats provide additional bio-geo parameters such as oxygen or chlorophyll. All data collected by Argo floats are publically available in near real-time via the Global Data Assembly Centers (GDACs) in Brest (France) and Monterey (California) after an automated quality control (QC), and in scientifically quality controlled form, delayed mode data, via the GDACs within six months of collection.