Channel
Type of resources
Available actions
Topics
Keywords
Provided by
Representation types
Update frequencies
status
Scale
-
The bathymetric DEM of the atlantic facade with a resolution of 0.001° (~ 100 m) was prepared as part of the HOMONIM project. It encompasses part of the North Sea, the Channel and the Bay of Biscay. Offshore, this DTM extends beyond the slope to approximately 4800 m depth. The DEM is designed to be used in hydrodynamic models in order to produce high-precision forecasts for coastal water levels and sea conditions and therefore improve the pertinence of the Waves-Submersion monitoring programme. This product is available with the Lowest Astronomic Tide (LAT) or the Mean Sea Level (MSL) as a vertical datum.
-

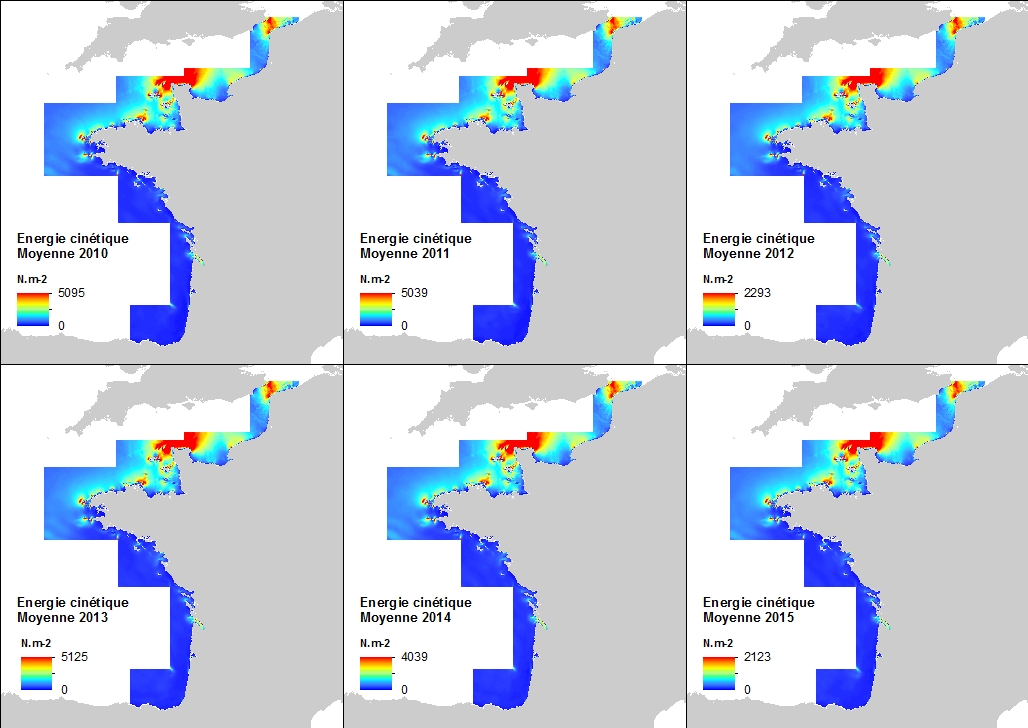
This annual statistics at 500m horizontal resolution was produced from the archived time series of MARS 3D physics model hindcast runs along French Atlantic Coast. The variable that is available here is the Kinetic Energy induced by currents caused by tide, water density gradients and action of winds. The formula used for the Kinetic Energy calculation is 0.5mv², where m is the density of seawater (1027 kg.m-3) and v is the current-induced velocity. Values are expressed in N.m-2 (Newton per square meter). In each pixel the value is an average of the values of the 40 vertical levels that are considered in the model.
-

This annual statistics at 500m horizontal resolution was produced from the archived time series of MARS 3D physics model hindcast runs along French Atlantic Coast. The variable that is available here is the Kinetic Energy induced by currents caused by tide, water density gradients and action of winds. The formula used for the Kinetic Energy calculation is 0.5mv², where m is the density of seawater (1027 kg.m-3) and v is the current-induced velocity. Values are expressed in N.m-2 (Newton per square meter). The vertical level is the seabed.
-

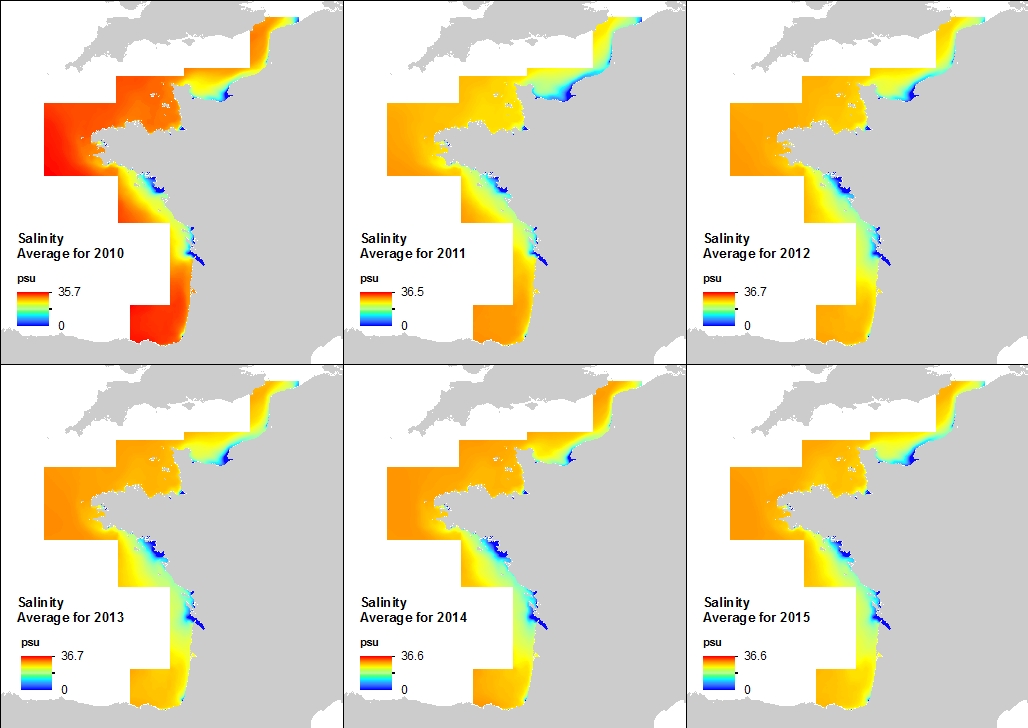
This annual statistics at 500m horizontal resolution was produced from the archived time series of MARS 3D physics model hindcast runs along French Atlantic Coast. The variable that is available here is the Salinity. Values are expressed in psu. The vertical level is the seabed.
-

This annual statistics at 500m horizontal resolution was produced from the archived time series of MARS 3D physics model hindcast runs along French Atlantic Coast. The variable that is available here is Salinity. Values are expressed in psu. In each pixel the value is an average of the values of the 40 vertical levels that are considered in the model.
-

This annual statistics at 500m horizontal resolution was produced from the archived time series of MARS 3D physics model hindcast runs along French Atlantic Coast. The variable that is available here is the Temperature. Values are expressed in Celsius Degrees. The vertical level is the sea surface.
-

This annual statistics at 500m horizontal resolution was produced from the archived time series of MARS 3D physics model hindcast runs along French Atlantic Coast. The variable that is available here is the Kinetic Energy induced by currents caused by tide, water density gradients and action of winds. The formula used for the Kinetic Energy calculation is 0.5mv², where m is the density of seawater (1027 kg.m-3) and v is the current-induced velocity. Values are expressed in N.m-2 (Newton per square meter). The vertical level is the sea surface.
-

This annual statistics at 500m horizontal resolution was produced from the archived time series of MARS 3D physics model hindcast runs along French Atlantic Coast. The variable that is available here is Temperature. Values are expressed in Celsius degrees. In each pixel the value is an average of the values of the 40 vertical levels that are considered in the model.
-

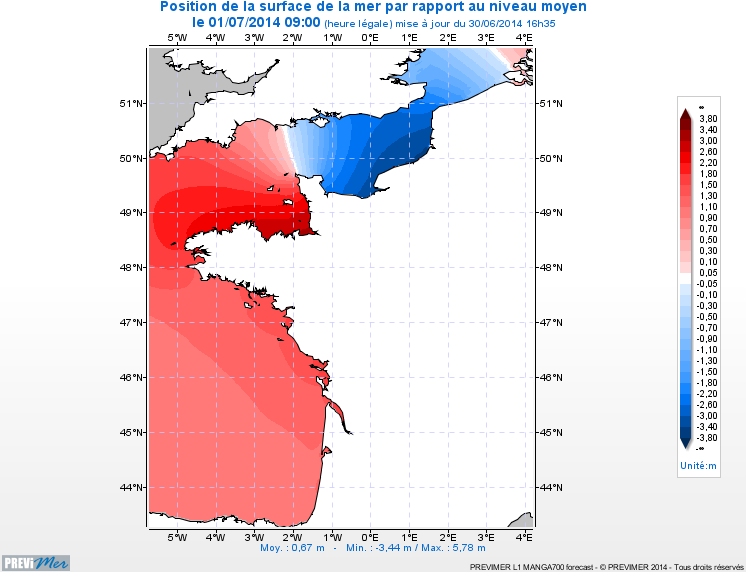
The hydrodynamic MARS 2D model on the Channel / Bay of Biscay coasts is a 2D model of 700m spatial resolution providing currents, sea levels, and maximum/minimum tide levels every hour (4-day forecasts).
-

This annual statistics at 500m horizontal resolution was produced from the archived time series of MARS 3D physics model hindcast runs along French Atlantic Coast. The variable that is available here is the Salinity. Values are expressed in psu. The vertical level is the sea surface.
 Catalogue PIGMA